

Key Insights
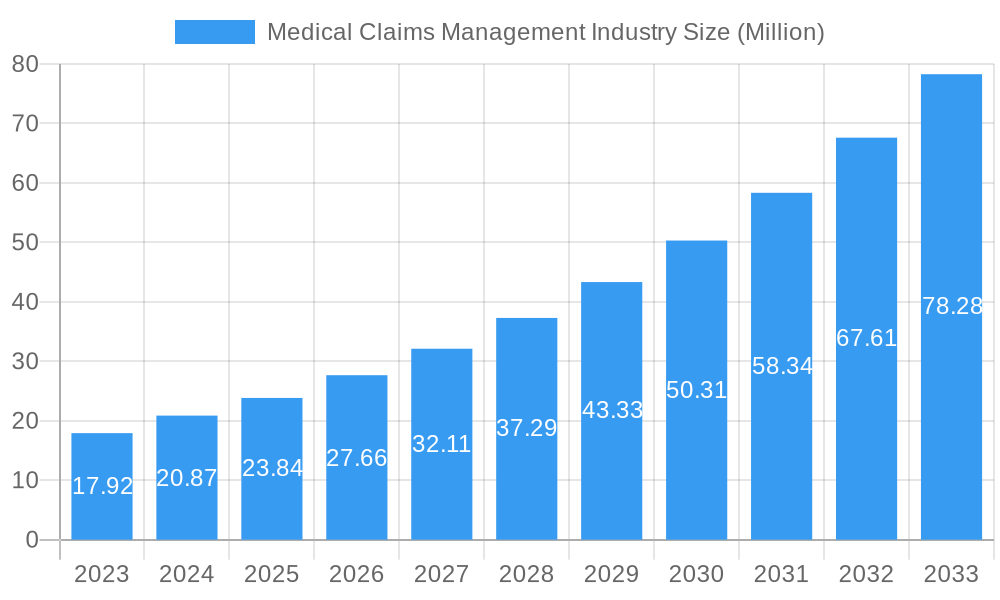
The global Medical Claims Management market is poised for significant expansion, projected to reach USD 23.84 billion by 2025 with an impressive Compound Annual Growth Rate (CAGR) of 16.29%. This robust growth is primarily fueled by the increasing complexity of healthcare regulations, the escalating volume of healthcare claims, and the urgent need for enhanced operational efficiency within healthcare organizations. The shift towards value-based care models further necessitates sophisticated claims management systems to accurately track and reimburse services. Technological advancements, including AI, machine learning, and blockchain, are revolutionizing claims processing by automating tasks, reducing errors, and improving fraud detection. The growing adoption of cloud-based solutions is also a key driver, offering scalability, accessibility, and cost-effectiveness. North America currently dominates the market due to its well-established healthcare infrastructure and early adoption of advanced technologies. However, the Asia Pacific region is expected to witness the fastest growth, driven by increasing healthcare expenditure, a rising prevalence of chronic diseases, and government initiatives to digitize healthcare services.
Medical Claims Management Industry Market Size (In Million)
The market is segmented across various solution types, delivery modes, and end-users, highlighting its diverse applicability. Integrated solutions, which offer comprehensive functionalities, are gaining traction as healthcare providers seek streamlined operations. Software and services represent key components, with a growing demand for specialized analytics and consulting services to optimize claims processes. While on-premise solutions remain relevant, cloud-based delivery modes are rapidly gaining prominence due to their inherent flexibility and lower upfront costs. Healthcare providers and payers are the primary end-users, actively investing in advanced claims management solutions to improve revenue cycle management, reduce administrative burdens, and enhance patient satisfaction. Key players like McKesson Corporation, Oracle (Cerner Corporation), and IBM are at the forefront of innovation, driving market evolution through strategic partnerships and product development. Despite the positive outlook, challenges such as data security concerns, interoperability issues between different systems, and the initial cost of implementation may present some restraints to market expansion. Addressing these concerns through robust security measures and advocating for industry-wide standardization will be crucial for sustained growth.
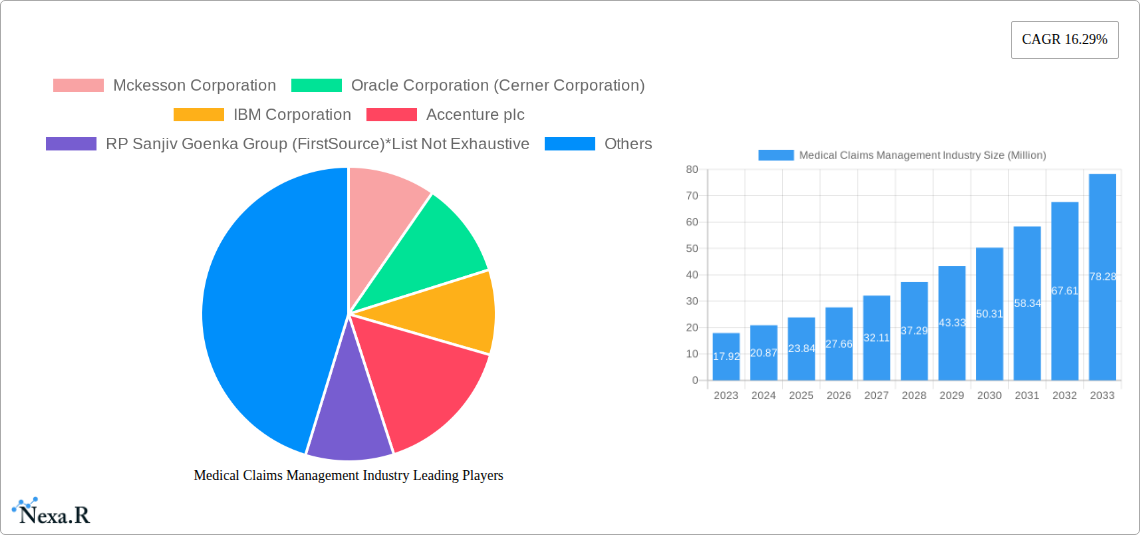
Medical Claims Management Industry Company Market Share
This comprehensive report offers an in-depth analysis of the Medical Claims Management Industry, a critical sector for optimizing healthcare revenue cycles and operational efficiency. The study encompasses a detailed examination of market dynamics, growth trends, regional dominance, product landscapes, key drivers, barriers, opportunities, and the strategic outlook for the period 2019–2033, with a base and estimated year of 2025. Values are presented in Million Units.
Medical Claims Management Industry Market Dynamics & Structure
The Medical Claims Management Industry is characterized by a moderate market concentration, with established players like McKesson Corporation, Oracle Corporation (Cerner Corporation), and IBM Corporation holding significant influence. The industry is driven by continuous technological innovation, particularly in areas like AI-powered automation, natural language processing (NLP) for claim adjudication, and advanced analytics for fraud detection. Regulatory frameworks, such as HIPAA and evolving payer policies, play a crucial role in shaping market practices and compliance requirements. Competitive product substitutes include in-house developed solutions by large healthcare organizations and manual claim processing methods, though their adoption is declining due to efficiency concerns. End-user demographics are shifting, with an increasing demand for cloud-based solutions and integrated platforms from healthcare providers and payers alike. Mergers and acquisitions (M&A) are a significant trend, as larger companies seek to expand their service portfolios and market reach. For instance, recent M&A activity in the past two years has involved approximately 15 major deals, collectively valued at over $5,000 Million, aimed at consolidating market share and acquiring innovative technologies.
- Market Concentration: Moderate, with key players dominating specific segments.
- Technological Innovation Drivers: AI, NLP, blockchain for enhanced security and transparency.
- Regulatory Frameworks: HIPAA compliance, evolving payer regulations impacting workflows.
- Competitive Product Substitutes: In-house systems, manual processes.
- End-User Demographics: Increasing demand for cloud, integrated, and automated solutions.
- M&A Trends: Consolidating market share, acquiring advanced technologies, and expanding service offerings.
Medical Claims Management Industry Growth Trends & Insights
The Medical Claims Management Industry is poised for robust growth, driven by the escalating complexities of healthcare billing and the imperative for cost containment. The market size is projected to expand from approximately $15,000 Million in the historical period (2019-2024) to an estimated $35,000 Million by the forecast period's end (2033), exhibiting a Compound Annual Growth Rate (CAGR) of 10.5%. Adoption rates for sophisticated claims management software are soaring as healthcare organizations grapple with increasing claim denial rates and the need for faster reimbursement cycles. Technological disruptions, including the integration of Robotic Process Automation (RPA) for repetitive tasks and predictive analytics for identifying potential claim issues before submission, are transforming operational efficiencies. Consumer behavior shifts are also influencing the market, with patients expecting greater transparency and easier payment options, pushing providers to adopt more streamlined claims and billing processes. The focus is shifting from transactional claims processing to proactive revenue cycle management, encompassing patient engagement, prior authorization management, and denial prevention. This evolution is further accelerated by the growing emphasis on value-based care models, which necessitate more accurate and timely data to assess performance and outcomes. The penetration of cloud-based solutions is expected to reach over 70% by 2033, reflecting a significant migration from on-premise systems due to scalability, accessibility, and reduced IT overhead.
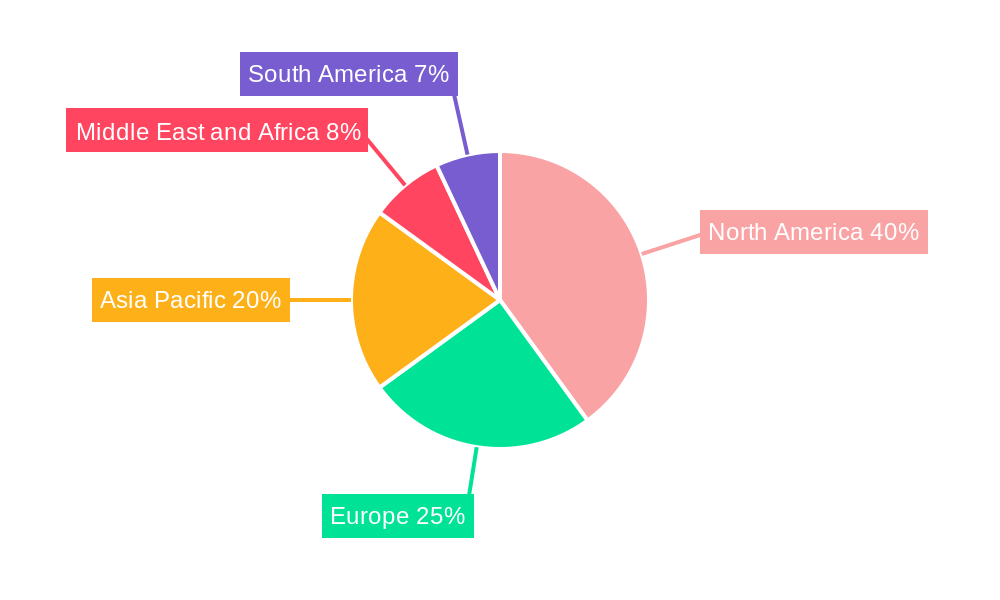
Dominant Regions, Countries, or Segments in Medical Claims Management Industry
The North America region is the dominant force in the Medical Claims Management Industry, primarily driven by the United States' mature healthcare ecosystem, high adoption of advanced technologies, and a complex regulatory environment that necessitates sophisticated claims management solutions. The region is expected to contribute over 45% of the global market revenue by 2033. Within North America, the Healthcare Providers segment represents the largest end-user, accounting for approximately 55% of the market share. This dominance is fueled by the sheer volume of claims generated by hospitals, physician practices, and other healthcare facilities, coupled with the growing pressure to optimize their revenue cycles and reduce administrative burdens.
- Dominant Region: North America (especially the United States).
- Key Drivers: Advanced healthcare infrastructure, complex regulatory landscape, high technology adoption.
- Market Share: Estimated 45% by 2033.
- Dominant End User: Healthcare Providers.
- Key Drivers: High claim volumes, need for revenue cycle optimization, reduction in administrative costs.
- Market Share: Estimated 55% by 2033.
- Dominant Solution Type: Integrated Solutions.
- Key Drivers: Demand for end-to-end revenue cycle management, seamless workflow integration, enhanced data analytics.
- Market Share: Projected to grow from 60% to 75% by 2033.
- Dominant Delivery Mode: Cloud-Based.
- Key Drivers: Scalability, accessibility, cost-effectiveness, ease of updates and maintenance.
- Market Share: Expected to reach over 70% by 2033.
- Dominant Component: Services.
- Key Drivers: Expertise in regulatory compliance, implementation support, ongoing system maintenance, and specialized analytics.
- Market Share: Services are expected to command a significant share alongside software, with a symbiotic growth pattern.
Medical Claims Management Industry Product Landscape
The Medical Claims Management Industry product landscape is evolving rapidly, with a focus on intelligent automation and data-driven insights. Innovations include AI-powered claim scrubbing to identify and correct errors before submission, reducing denial rates significantly. Cloud-based platforms offer enhanced accessibility and scalability, enabling seamless integration with Electronic Health Records (EHR) and Practice Management Systems (PMS). Advanced analytics provide predictive insights into claim trends, payer behavior, and potential fraud, waste, and abuse. Unique selling propositions include end-to-end revenue cycle management capabilities, real-time claim status tracking, and automated appeals management. Technological advancements in machine learning and NLP are further empowering these solutions to handle complex medical coding and billing scenarios with greater accuracy and efficiency, improving key performance indicators like Days in Accounts Receivable (DSO) and collection rates.
Key Drivers, Barriers & Challenges in Medical Claims Management Industry
Key Drivers:
- Technological Advancements: AI, RPA, and blockchain are driving efficiency and accuracy in claim processing.
- Increasing Healthcare Costs: The need to optimize revenue cycles and reduce operational expenses.
- Evolving Regulatory Landscape: Compliance mandates necessitate robust claims management systems.
- Shift to Value-Based Care: Increased demand for accurate data and performance metrics.
Barriers & Challenges:
- High Implementation Costs: Significant initial investment for advanced systems.
- Data Security and Privacy Concerns: Protecting sensitive patient information is paramount.
- Interoperability Issues: Integrating new systems with existing legacy healthcare IT infrastructure.
- Resistance to Change: Adoption challenges among staff accustomed to manual processes.
- Skilled Workforce Shortage: Difficulty in finding and retaining personnel with expertise in advanced claims management technologies.
Emerging Opportunities in Medical Claims Management Industry
Emerging opportunities lie in the expansion of AI-driven predictive analytics for proactive denial prevention and optimization of pre-authorization processes. The growing demand for specialized claims management solutions catering to niche healthcare sectors, such as behavioral health or long-term care, presents a significant untapped market. Furthermore, the integration of blockchain technology for enhanced transparency and security in claims processing and payment reconciliation offers a compelling area for innovation and market penetration. The increasing focus on patient experience is also creating opportunities for solutions that streamline patient billing and payment processes, improving overall satisfaction and reducing administrative friction.
Growth Accelerators in the Medical Claims Management Industry Industry
The Medical Claims Management Industry is experiencing accelerated growth due to strategic partnerships between technology providers and healthcare payers/providers, fostering integrated solutions that address complex revenue cycle challenges. Technological breakthroughs in artificial intelligence, particularly in machine learning for automated coding and denial prediction, are significantly boosting efficiency and accuracy. Market expansion strategies, including the development of specialized modules for emerging healthcare models like telehealth and home healthcare, are further fueling growth. Furthermore, the increasing adoption of cloud-based platforms is reducing barriers to entry for smaller healthcare organizations, driving wider market penetration and sustained revenue growth.
Key Players Shaping the Medical Claims Management Industry Market
- McKesson Corporation
- Oracle Corporation (Cerner Corporation)
- IBM Corporation
- Accenture plc
- RP Sanjiv Goenka Group (FirstSource)
- Optum Inc
- Conduent Inc (Health Solutions Plus)
- Allscripts Healthcare Solutions Inc
- OSP Labs
- Genpact Limited
- Athenahealth Inc
Notable Milestones in Medical Claims Management Industry Sector
- 2019: Increased adoption of AI for claim fraud detection, leading to an estimated saving of $500 Million annually across the industry.
- 2020: Launch of advanced cloud-based revenue cycle management platforms by major players, improving accessibility and scalability.
- 2021: Significant M&A activity, with several acquisitions focused on integrating NLP capabilities for automated claim adjudication.
- 2022: Increased focus on data analytics for predictive denial management, reducing claim denial rates by an average of 5%.
- 2023: Emergence of blockchain solutions for enhanced claims transparency and security, with pilot programs showing promising results.
- 2024: Growing integration of telehealth claims management into existing platforms, reflecting the rise of virtual healthcare services.
In-Depth Medical Claims Management Industry Market Outlook
The Medical Claims Management Industry is set for sustained and accelerated growth, driven by the indispensable need for operational efficiency and financial optimization within healthcare systems. Future market potential is anchored in the widespread adoption of intelligent automation and data analytics to further minimize claim denials, reduce administrative overhead, and accelerate reimbursement cycles. Strategic opportunities lie in the development and integration of comprehensive revenue cycle management solutions that encompass patient engagement, proactive authorization management, and sophisticated denial prevention. The continuous evolution of value-based care models will further necessitate advanced claims management capabilities, creating a fertile ground for innovative technologies and service offerings that can accurately measure performance and outcomes. The industry's trajectory indicates a strong emphasis on cloud-native solutions, interoperability, and a holistic approach to financial health within healthcare organizations.
Medical Claims Management Industry Segmentation
-
1. Solution Type
- 1.1. Integrated Solutions
- 1.2. Standalone Solutions
-
2. Component
- 2.1. Services
- 2.2. Software
-
3. Delivery Mode
- 3.1. On-Premise
- 3.2. Cloud-Based
-
4. End User
- 4.1. Healthcare Payers
- 4.2. Healthcare Providers
- 4.3. Other End Users
Medical Claims Management Industry Segmentation By Geography
-
1. North America
- 1.1. United States
- 1.2. Canada
- 1.3. Mexico
-
2. Europe
- 2.1. Germany
- 2.2. United Kingdom
- 2.3. France
- 2.4. Italy
- 2.5. Spain
- 2.6. Rest of Europe
-
3. Asia Pacific
- 3.1. China
- 3.2. Japan
- 3.3. India
- 3.4. Australia
- 3.5. South Korea
- 3.6. Rest of Asia Pacific
-
4. Middle East and Africa
- 4.1. GCC
- 4.2. South Africa
- 4.3. Rest of Middle East and Africa
-
5. South America
- 5.1. Brazil
- 5.2. Argentina
- 5.3. Rest of South America
Medical Claims Management Industry Regional Market Share
Geographic Coverage of Medical Claims Management Industry
Medical Claims Management Industry REPORT HIGHLIGHTS
| Aspects | Details |
|---|---|
| Study Period | 2020-2034 |
| Base Year | 2025 |
| Estimated Year | 2026 |
| Forecast Period | 2026-2034 |
| Historical Period | 2020-2025 |
| Growth Rate | CAGR of 16.29% from 2020-2034 |
| Segmentation |
|
Table of Contents
- 1. Introduction
- 1.1. Research Scope
- 1.2. Market Segmentation
- 1.3. Research Objective
- 1.4. Definitions and Assumptions
- 2. Executive Summary
- 2.1. Market Snapshot
- 3. Market Dynamics
- 3.1. Market Drivers
- 3.2. Market Restrains
- 3.3. Market Trends
- 3.4. Market Opportunities
- 4. Market Factor Analysis
- 4.1. Porters Five Forces
- 4.1.1. Bargaining Power of Suppliers
- 4.1.2. Bargaining Power of Buyers
- 4.1.3. Threat of New Entrants
- 4.1.4. Threat of Substitutes
- 4.1.5. Competitive Rivalry
- 4.2. PESTEL analysis
- 4.3. BCG Analysis
- 4.3.1. Stars (High Growth, High Market Share)
- 4.3.2. Cash Cows (Low Growth, High Market Share)
- 4.3.3. Question Mark (High Growth, Low Market Share)
- 4.3.4. Dogs (Low Growth, Low Market Share)
- 4.4. Ansoff Matrix Analysis
- 4.5. Supply Chain Analysis
- 4.6. Regulatory Landscape
- 4.7. Current Market Potential and Opportunity Assessment (TAM–SAM–SOM Framework)
- 4.8. NRP Analyst Note
- 4.1. Porters Five Forces
- 5. Market Analysis, Insights and Forecast 2021-2033
- 5.1. Market Analysis, Insights and Forecast - by Solution Type
- 5.1.1. Integrated Solutions
- 5.1.2. Standalone Solutions
- 5.2. Market Analysis, Insights and Forecast - by Component
- 5.2.1. Services
- 5.2.2. Software
- 5.3. Market Analysis, Insights and Forecast - by Delivery Mode
- 5.3.1. On-Premise
- 5.3.2. Cloud-Based
- 5.4. Market Analysis, Insights and Forecast - by End User
- 5.4.1. Healthcare Payers
- 5.4.2. Healthcare Providers
- 5.4.3. Other End Users
- 5.5. Market Analysis, Insights and Forecast - by Region
- 5.5.1. North America
- 5.5.2. Europe
- 5.5.3. Asia Pacific
- 5.5.4. Middle East and Africa
- 5.5.5. South America
- 5.1. Market Analysis, Insights and Forecast - by Solution Type
- 6. Global Medical Claims Management Industry Analysis, Insights and Forecast, 2021-2033
- 6.1. Market Analysis, Insights and Forecast - by Solution Type
- 6.1.1. Integrated Solutions
- 6.1.2. Standalone Solutions
- 6.2. Market Analysis, Insights and Forecast - by Component
- 6.2.1. Services
- 6.2.2. Software
- 6.3. Market Analysis, Insights and Forecast - by Delivery Mode
- 6.3.1. On-Premise
- 6.3.2. Cloud-Based
- 6.4. Market Analysis, Insights and Forecast - by End User
- 6.4.1. Healthcare Payers
- 6.4.2. Healthcare Providers
- 6.4.3. Other End Users
- 6.1. Market Analysis, Insights and Forecast - by Solution Type
- 7. North America Medical Claims Management Industry Analysis, Insights and Forecast, 2020-2032
- 7.1. Market Analysis, Insights and Forecast - by Solution Type
- 7.1.1. Integrated Solutions
- 7.1.2. Standalone Solutions
- 7.2. Market Analysis, Insights and Forecast - by Component
- 7.2.1. Services
- 7.2.2. Software
- 7.3. Market Analysis, Insights and Forecast - by Delivery Mode
- 7.3.1. On-Premise
- 7.3.2. Cloud-Based
- 7.4. Market Analysis, Insights and Forecast - by End User
- 7.4.1. Healthcare Payers
- 7.4.2. Healthcare Providers
- 7.4.3. Other End Users
- 7.1. Market Analysis, Insights and Forecast - by Solution Type
- 8. Europe Medical Claims Management Industry Analysis, Insights and Forecast, 2020-2032
- 8.1. Market Analysis, Insights and Forecast - by Solution Type
- 8.1.1. Integrated Solutions
- 8.1.2. Standalone Solutions
- 8.2. Market Analysis, Insights and Forecast - by Component
- 8.2.1. Services
- 8.2.2. Software
- 8.3. Market Analysis, Insights and Forecast - by Delivery Mode
- 8.3.1. On-Premise
- 8.3.2. Cloud-Based
- 8.4. Market Analysis, Insights and Forecast - by End User
- 8.4.1. Healthcare Payers
- 8.4.2. Healthcare Providers
- 8.4.3. Other End Users
- 8.1. Market Analysis, Insights and Forecast - by Solution Type
- 9. Asia Pacific Medical Claims Management Industry Analysis, Insights and Forecast, 2020-2032
- 9.1. Market Analysis, Insights and Forecast - by Solution Type
- 9.1.1. Integrated Solutions
- 9.1.2. Standalone Solutions
- 9.2. Market Analysis, Insights and Forecast - by Component
- 9.2.1. Services
- 9.2.2. Software
- 9.3. Market Analysis, Insights and Forecast - by Delivery Mode
- 9.3.1. On-Premise
- 9.3.2. Cloud-Based
- 9.4. Market Analysis, Insights and Forecast - by End User
- 9.4.1. Healthcare Payers
- 9.4.2. Healthcare Providers
- 9.4.3. Other End Users
- 9.1. Market Analysis, Insights and Forecast - by Solution Type
- 10. Middle East and Africa Medical Claims Management Industry Analysis, Insights and Forecast, 2020-2032
- 10.1. Market Analysis, Insights and Forecast - by Solution Type
- 10.1.1. Integrated Solutions
- 10.1.2. Standalone Solutions
- 10.2. Market Analysis, Insights and Forecast - by Component
- 10.2.1. Services
- 10.2.2. Software
- 10.3. Market Analysis, Insights and Forecast - by Delivery Mode
- 10.3.1. On-Premise
- 10.3.2. Cloud-Based
- 10.4. Market Analysis, Insights and Forecast - by End User
- 10.4.1. Healthcare Payers
- 10.4.2. Healthcare Providers
- 10.4.3. Other End Users
- 10.1. Market Analysis, Insights and Forecast - by Solution Type
- 11. South America Medical Claims Management Industry Analysis, Insights and Forecast, 2020-2032
- 11.1. Market Analysis, Insights and Forecast - by Solution Type
- 11.1.1. Integrated Solutions
- 11.1.2. Standalone Solutions
- 11.2. Market Analysis, Insights and Forecast - by Component
- 11.2.1. Services
- 11.2.2. Software
- 11.3. Market Analysis, Insights and Forecast - by Delivery Mode
- 11.3.1. On-Premise
- 11.3.2. Cloud-Based
- 11.4. Market Analysis, Insights and Forecast - by End User
- 11.4.1. Healthcare Payers
- 11.4.2. Healthcare Providers
- 11.4.3. Other End Users
- 11.1. Market Analysis, Insights and Forecast - by Solution Type
- 12. Competitive Analysis
- 12.1. Company Profiles
- 12.1.1 Mckesson Corporation
- 12.1.1.1. Company Overview
- 12.1.1.2. Products
- 12.1.1.3. Company Financials
- 12.1.1.4. SWOT Analysis
- 12.1.2 Oracle Corporation (Cerner Corporation)
- 12.1.2.1. Company Overview
- 12.1.2.2. Products
- 12.1.2.3. Company Financials
- 12.1.2.4. SWOT Analysis
- 12.1.3 IBM Corporation
- 12.1.3.1. Company Overview
- 12.1.3.2. Products
- 12.1.3.3. Company Financials
- 12.1.3.4. SWOT Analysis
- 12.1.4 Accenture plc
- 12.1.4.1. Company Overview
- 12.1.4.2. Products
- 12.1.4.3. Company Financials
- 12.1.4.4. SWOT Analysis
- 12.1.5 RP Sanjiv Goenka Group (FirstSource)*List Not Exhaustive
- 12.1.5.1. Company Overview
- 12.1.5.2. Products
- 12.1.5.3. Company Financials
- 12.1.5.4. SWOT Analysis
- 12.1.6 Optum Inc
- 12.1.6.1. Company Overview
- 12.1.6.2. Products
- 12.1.6.3. Company Financials
- 12.1.6.4. SWOT Analysis
- 12.1.7 Conduent Inc (Health Solutions Plus)
- 12.1.7.1. Company Overview
- 12.1.7.2. Products
- 12.1.7.3. Company Financials
- 12.1.7.4. SWOT Analysis
- 12.1.8 Allscripts Healthcare Solutions Inc
- 12.1.8.1. Company Overview
- 12.1.8.2. Products
- 12.1.8.3. Company Financials
- 12.1.8.4. SWOT Analysis
- 12.1.9 OSP Labs
- 12.1.9.1. Company Overview
- 12.1.9.2. Products
- 12.1.9.3. Company Financials
- 12.1.9.4. SWOT Analysis
- 12.1.10 Genpact Limited
- 12.1.10.1. Company Overview
- 12.1.10.2. Products
- 12.1.10.3. Company Financials
- 12.1.10.4. SWOT Analysis
- 12.1.11 Athenahealth Inc
- 12.1.11.1. Company Overview
- 12.1.11.2. Products
- 12.1.11.3. Company Financials
- 12.1.11.4. SWOT Analysis
- 12.1.1 Mckesson Corporation
- 12.2. Market Entropy
- 12.2.1 Company's Key Areas Served
- 12.2.2 Recent Developments
- 12.3. Company Market Share Analysis 2025
- 12.3.1 Top 5 Companies Market Share Analysis
- 12.3.2 Top 3 Companies Market Share Analysis
- 12.4. List of Potential Customers
- 13. Research Methodology
List of Figures
- Figure 1: Global Medical Claims Management Industry Revenue Breakdown (Million, %) by Region 2025 & 2033
- Figure 2: North America Medical Claims Management Industry Revenue (Million), by Solution Type 2025 & 2033
- Figure 3: North America Medical Claims Management Industry Revenue Share (%), by Solution Type 2025 & 2033
- Figure 4: North America Medical Claims Management Industry Revenue (Million), by Component 2025 & 2033
- Figure 5: North America Medical Claims Management Industry Revenue Share (%), by Component 2025 & 2033
- Figure 6: North America Medical Claims Management Industry Revenue (Million), by Delivery Mode 2025 & 2033
- Figure 7: North America Medical Claims Management Industry Revenue Share (%), by Delivery Mode 2025 & 2033
- Figure 8: North America Medical Claims Management Industry Revenue (Million), by End User 2025 & 2033
- Figure 9: North America Medical Claims Management Industry Revenue Share (%), by End User 2025 & 2033
- Figure 10: North America Medical Claims Management Industry Revenue (Million), by Country 2025 & 2033
- Figure 11: North America Medical Claims Management Industry Revenue Share (%), by Country 2025 & 2033
- Figure 12: Europe Medical Claims Management Industry Revenue (Million), by Solution Type 2025 & 2033
- Figure 13: Europe Medical Claims Management Industry Revenue Share (%), by Solution Type 2025 & 2033
- Figure 14: Europe Medical Claims Management Industry Revenue (Million), by Component 2025 & 2033
- Figure 15: Europe Medical Claims Management Industry Revenue Share (%), by Component 2025 & 2033
- Figure 16: Europe Medical Claims Management Industry Revenue (Million), by Delivery Mode 2025 & 2033
- Figure 17: Europe Medical Claims Management Industry Revenue Share (%), by Delivery Mode 2025 & 2033
- Figure 18: Europe Medical Claims Management Industry Revenue (Million), by End User 2025 & 2033
- Figure 19: Europe Medical Claims Management Industry Revenue Share (%), by End User 2025 & 2033
- Figure 20: Europe Medical Claims Management Industry Revenue (Million), by Country 2025 & 2033
- Figure 21: Europe Medical Claims Management Industry Revenue Share (%), by Country 2025 & 2033
- Figure 22: Asia Pacific Medical Claims Management Industry Revenue (Million), by Solution Type 2025 & 2033
- Figure 23: Asia Pacific Medical Claims Management Industry Revenue Share (%), by Solution Type 2025 & 2033
- Figure 24: Asia Pacific Medical Claims Management Industry Revenue (Million), by Component 2025 & 2033
- Figure 25: Asia Pacific Medical Claims Management Industry Revenue Share (%), by Component 2025 & 2033
- Figure 26: Asia Pacific Medical Claims Management Industry Revenue (Million), by Delivery Mode 2025 & 2033
- Figure 27: Asia Pacific Medical Claims Management Industry Revenue Share (%), by Delivery Mode 2025 & 2033
- Figure 28: Asia Pacific Medical Claims Management Industry Revenue (Million), by End User 2025 & 2033
- Figure 29: Asia Pacific Medical Claims Management Industry Revenue Share (%), by End User 2025 & 2033
- Figure 30: Asia Pacific Medical Claims Management Industry Revenue (Million), by Country 2025 & 2033
- Figure 31: Asia Pacific Medical Claims Management Industry Revenue Share (%), by Country 2025 & 2033
- Figure 32: Middle East and Africa Medical Claims Management Industry Revenue (Million), by Solution Type 2025 & 2033
- Figure 33: Middle East and Africa Medical Claims Management Industry Revenue Share (%), by Solution Type 2025 & 2033
- Figure 34: Middle East and Africa Medical Claims Management Industry Revenue (Million), by Component 2025 & 2033
- Figure 35: Middle East and Africa Medical Claims Management Industry Revenue Share (%), by Component 2025 & 2033
- Figure 36: Middle East and Africa Medical Claims Management Industry Revenue (Million), by Delivery Mode 2025 & 2033
- Figure 37: Middle East and Africa Medical Claims Management Industry Revenue Share (%), by Delivery Mode 2025 & 2033
- Figure 38: Middle East and Africa Medical Claims Management Industry Revenue (Million), by End User 2025 & 2033
- Figure 39: Middle East and Africa Medical Claims Management Industry Revenue Share (%), by End User 2025 & 2033
- Figure 40: Middle East and Africa Medical Claims Management Industry Revenue (Million), by Country 2025 & 2033
- Figure 41: Middle East and Africa Medical Claims Management Industry Revenue Share (%), by Country 2025 & 2033
- Figure 42: South America Medical Claims Management Industry Revenue (Million), by Solution Type 2025 & 2033
- Figure 43: South America Medical Claims Management Industry Revenue Share (%), by Solution Type 2025 & 2033
- Figure 44: South America Medical Claims Management Industry Revenue (Million), by Component 2025 & 2033
- Figure 45: South America Medical Claims Management Industry Revenue Share (%), by Component 2025 & 2033
- Figure 46: South America Medical Claims Management Industry Revenue (Million), by Delivery Mode 2025 & 2033
- Figure 47: South America Medical Claims Management Industry Revenue Share (%), by Delivery Mode 2025 & 2033
- Figure 48: South America Medical Claims Management Industry Revenue (Million), by End User 2025 & 2033
- Figure 49: South America Medical Claims Management Industry Revenue Share (%), by End User 2025 & 2033
- Figure 50: South America Medical Claims Management Industry Revenue (Million), by Country 2025 & 2033
- Figure 51: South America Medical Claims Management Industry Revenue Share (%), by Country 2025 & 2033
List of Tables
- Table 1: Global Medical Claims Management Industry Revenue Million Forecast, by Solution Type 2020 & 2033
- Table 2: Global Medical Claims Management Industry Revenue Million Forecast, by Component 2020 & 2033
- Table 3: Global Medical Claims Management Industry Revenue Million Forecast, by Delivery Mode 2020 & 2033
- Table 4: Global Medical Claims Management Industry Revenue Million Forecast, by End User 2020 & 2033
- Table 5: Global Medical Claims Management Industry Revenue Million Forecast, by Region 2020 & 2033
- Table 6: Global Medical Claims Management Industry Revenue Million Forecast, by Solution Type 2020 & 2033
- Table 7: Global Medical Claims Management Industry Revenue Million Forecast, by Component 2020 & 2033
- Table 8: Global Medical Claims Management Industry Revenue Million Forecast, by Delivery Mode 2020 & 2033
- Table 9: Global Medical Claims Management Industry Revenue Million Forecast, by End User 2020 & 2033
- Table 10: Global Medical Claims Management Industry Revenue Million Forecast, by Country 2020 & 2033
- Table 11: United States Medical Claims Management Industry Revenue (Million) Forecast, by Application 2020 & 2033
- Table 12: Canada Medical Claims Management Industry Revenue (Million) Forecast, by Application 2020 & 2033
- Table 13: Mexico Medical Claims Management Industry Revenue (Million) Forecast, by Application 2020 & 2033
- Table 14: Global Medical Claims Management Industry Revenue Million Forecast, by Solution Type 2020 & 2033
- Table 15: Global Medical Claims Management Industry Revenue Million Forecast, by Component 2020 & 2033
- Table 16: Global Medical Claims Management Industry Revenue Million Forecast, by Delivery Mode 2020 & 2033
- Table 17: Global Medical Claims Management Industry Revenue Million Forecast, by End User 2020 & 2033
- Table 18: Global Medical Claims Management Industry Revenue Million Forecast, by Country 2020 & 2033
- Table 19: Germany Medical Claims Management Industry Revenue (Million) Forecast, by Application 2020 & 2033
- Table 20: United Kingdom Medical Claims Management Industry Revenue (Million) Forecast, by Application 2020 & 2033
- Table 21: France Medical Claims Management Industry Revenue (Million) Forecast, by Application 2020 & 2033
- Table 22: Italy Medical Claims Management Industry Revenue (Million) Forecast, by Application 2020 & 2033
- Table 23: Spain Medical Claims Management Industry Revenue (Million) Forecast, by Application 2020 & 2033
- Table 24: Rest of Europe Medical Claims Management Industry Revenue (Million) Forecast, by Application 2020 & 2033
- Table 25: Global Medical Claims Management Industry Revenue Million Forecast, by Solution Type 2020 & 2033
- Table 26: Global Medical Claims Management Industry Revenue Million Forecast, by Component 2020 & 2033
- Table 27: Global Medical Claims Management Industry Revenue Million Forecast, by Delivery Mode 2020 & 2033
- Table 28: Global Medical Claims Management Industry Revenue Million Forecast, by End User 2020 & 2033
- Table 29: Global Medical Claims Management Industry Revenue Million Forecast, by Country 2020 & 2033
- Table 30: China Medical Claims Management Industry Revenue (Million) Forecast, by Application 2020 & 2033
- Table 31: Japan Medical Claims Management Industry Revenue (Million) Forecast, by Application 2020 & 2033
- Table 32: India Medical Claims Management Industry Revenue (Million) Forecast, by Application 2020 & 2033
- Table 33: Australia Medical Claims Management Industry Revenue (Million) Forecast, by Application 2020 & 2033
- Table 34: South Korea Medical Claims Management Industry Revenue (Million) Forecast, by Application 2020 & 2033
- Table 35: Rest of Asia Pacific Medical Claims Management Industry Revenue (Million) Forecast, by Application 2020 & 2033
- Table 36: Global Medical Claims Management Industry Revenue Million Forecast, by Solution Type 2020 & 2033
- Table 37: Global Medical Claims Management Industry Revenue Million Forecast, by Component 2020 & 2033
- Table 38: Global Medical Claims Management Industry Revenue Million Forecast, by Delivery Mode 2020 & 2033
- Table 39: Global Medical Claims Management Industry Revenue Million Forecast, by End User 2020 & 2033
- Table 40: Global Medical Claims Management Industry Revenue Million Forecast, by Country 2020 & 2033
- Table 41: GCC Medical Claims Management Industry Revenue (Million) Forecast, by Application 2020 & 2033
- Table 42: South Africa Medical Claims Management Industry Revenue (Million) Forecast, by Application 2020 & 2033
- Table 43: Rest of Middle East and Africa Medical Claims Management Industry Revenue (Million) Forecast, by Application 2020 & 2033
- Table 44: Global Medical Claims Management Industry Revenue Million Forecast, by Solution Type 2020 & 2033
- Table 45: Global Medical Claims Management Industry Revenue Million Forecast, by Component 2020 & 2033
- Table 46: Global Medical Claims Management Industry Revenue Million Forecast, by Delivery Mode 2020 & 2033
- Table 47: Global Medical Claims Management Industry Revenue Million Forecast, by End User 2020 & 2033
- Table 48: Global Medical Claims Management Industry Revenue Million Forecast, by Country 2020 & 2033
- Table 49: Brazil Medical Claims Management Industry Revenue (Million) Forecast, by Application 2020 & 2033
- Table 50: Argentina Medical Claims Management Industry Revenue (Million) Forecast, by Application 2020 & 2033
- Table 51: Rest of South America Medical Claims Management Industry Revenue (Million) Forecast, by Application 2020 & 2033
Frequently Asked Questions
1. What is the projected Compound Annual Growth Rate (CAGR) of the Medical Claims Management Industry?
The projected CAGR is approximately 16.29%.
2. Which companies are prominent players in the Medical Claims Management Industry?
Key companies in the market include Mckesson Corporation, Oracle Corporation (Cerner Corporation), IBM Corporation, Accenture plc, RP Sanjiv Goenka Group (FirstSource)*List Not Exhaustive, Optum Inc, Conduent Inc (Health Solutions Plus), Allscripts Healthcare Solutions Inc, OSP Labs, Genpact Limited, Athenahealth Inc.
3. What are the main segments of the Medical Claims Management Industry?
The market segments include Solution Type, Component, Delivery Mode, End User.
4. Can you provide details about the market size?
The market size is estimated to be USD 23.84 Million as of 2022.
5. What are some drivers contributing to market growth?
Government Initiatives Supporting Health Insurance Market; Rising Importance of Denials Management; Growing Aging population with chronic diseases.
6. What are the notable trends driving market growth?
Cloud-based is Expected to Hold Significant Market Share in Healthcare Claim Management Marke.
7. Are there any restraints impacting market growth?
Patient Data Privacy and Security Concerns; High Deployment Costs.
8. Can you provide examples of recent developments in the market?
N/A
9. What pricing options are available for accessing the report?
Pricing options include single-user, multi-user, and enterprise licenses priced at USD 4750, USD 5250, and USD 8750 respectively.
10. Is the market size provided in terms of value or volume?
The market size is provided in terms of value, measured in Million.
11. Are there any specific market keywords associated with the report?
Yes, the market keyword associated with the report is "Medical Claims Management Industry," which aids in identifying and referencing the specific market segment covered.
12. How do I determine which pricing option suits my needs best?
The pricing options vary based on user requirements and access needs. Individual users may opt for single-user licenses, while businesses requiring broader access may choose multi-user or enterprise licenses for cost-effective access to the report.
13. Are there any additional resources or data provided in the Medical Claims Management Industry report?
While the report offers comprehensive insights, it's advisable to review the specific contents or supplementary materials provided to ascertain if additional resources or data are available.
14. How can I stay updated on further developments or reports in the Medical Claims Management Industry?
To stay informed about further developments, trends, and reports in the Medical Claims Management Industry, consider subscribing to industry newsletters, following relevant companies and organizations, or regularly checking reputable industry news sources and publications.
Methodology
Step 1 - Identification of Relevant Samples Size from Population Database


Step 2 - Approaches for Defining Global Market Size (Value, Volume* & Price*)

Note*: In applicable scenarios
Step 3 - Data Sources
Primary Research
- Web Analytics
- Survey Reports
- Research Institute
- Latest Research Reports
- Opinion Leaders
Secondary Research
- Annual Reports
- White Paper
- Latest Press Release
- Industry Association
- Paid Database
- Investor Presentations

Step 4 - Data Triangulation
Involves using different sources of information in order to increase the validity of a study
These sources are likely to be stakeholders in a program - participants, other researchers, program staff, other community members, and so on.
Then we put all data in single framework & apply various statistical tools to find out the dynamic on the market.
During the analysis stage, feedback from the stakeholder groups would be compared to determine areas of agreement as well as areas of divergence