

Key Insights
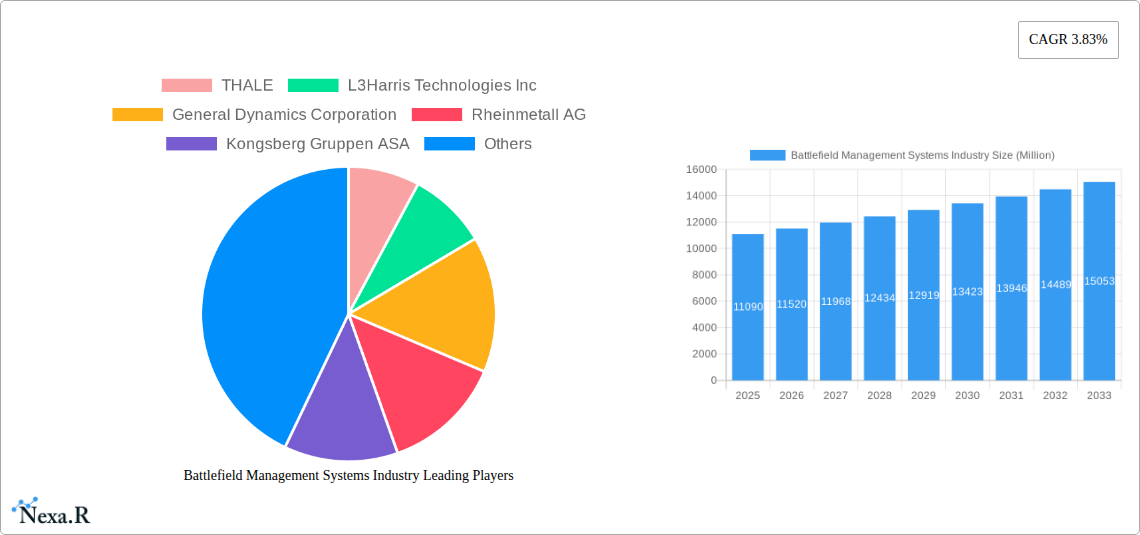
The Battlefield Management Systems (BMS) market, valued at $11.09 billion in 2025, is projected to experience robust growth, driven by escalating geopolitical tensions, modernization of armed forces globally, and the increasing demand for enhanced situational awareness and real-time decision-making capabilities on the battlefield. A Compound Annual Growth Rate (CAGR) of 3.83% from 2025 to 2033 indicates a steady expansion, primarily fueled by technological advancements such as artificial intelligence (AI), machine learning (ML), and improved communication technologies integrating diverse data sources. Key segments contributing significantly to this growth include navigation, communication and networking, command and control, and weapon systems. The Army segment is expected to dominate the end-user landscape due to its substantial operational requirements and continuous investment in modernization programs. North America and Europe currently hold a significant share of the market, driven by strong defense budgets and established technological infrastructure. However, the Asia-Pacific region is poised for significant growth in the coming years due to rising defense spending and increasing adoption of advanced BMS technologies across various nations within the region. Competitive dynamics are shaped by established defense contractors such as Thales, L3Harris, General Dynamics, and Rheinmetall, along with emerging players constantly innovating to provide superior solutions.
The market's growth is, however, subject to certain restraints. These include the high initial investment costs associated with BMS implementation, the complexity of integrating diverse systems, and the need for continuous software and hardware upgrades to maintain operational effectiveness. Furthermore, budgetary constraints in certain regions and the potential for cybersecurity threats pose challenges for sustained market growth. Despite these challenges, the ongoing emphasis on improving battlefield efficiency, reducing friendly fire incidents, and enhancing operational coordination is expected to drive substantial investment in BMS, leading to consistent market expansion throughout the forecast period. The integration of autonomous systems and the development of more resilient communication networks will be key factors influencing future growth.
This comprehensive report provides an in-depth analysis of the Battlefield Management Systems (BMS) industry, encompassing market dynamics, growth trends, regional segmentation, product landscape, competitive analysis, and future outlook. The report covers the period from 2019 to 2033, with a focus on the forecast period of 2025-2033 and a base year of 2025. The total market size in 2025 is estimated at xx Million, with a projected CAGR of xx% during the forecast period.
Battlefield Management Systems Industry Market Dynamics & Structure
The Battlefield Management Systems market is characterized by moderate concentration, with a few major players holding significant market share. Technological innovation, particularly in areas like AI, machine learning, and advanced communication technologies, is a key driver. Stringent regulatory frameworks governing defense procurement and data security significantly impact market dynamics. Competitive substitutes include legacy systems and emerging technologies, creating pressure on pricing and innovation. The end-user demographic primarily consists of government defense departments (Army, Air Force, and Navy) globally, with varying adoption rates based on budgetary allocations and technological readiness. M&A activity in the sector has been relatively consistent, with xx deals recorded between 2019 and 2024, primarily focused on expanding product portfolios and geographic reach.
- Market Concentration: Moderately concentrated, with top 5 players holding approximately xx% of market share in 2025.
- Technological Innovation: AI, machine learning, and advanced communication systems are driving growth.
- Regulatory Frameworks: Stringent regulations related to data security and defense procurement influence market entry.
- Competitive Substitutes: Legacy systems and emerging technologies pose competitive pressure.
- M&A Activity: xx deals between 2019 and 2024, focused on expansion and diversification.
- Innovation Barriers: High R&D costs, stringent testing & certification, and integration complexities.
Battlefield Management Systems Industry Growth Trends & Insights
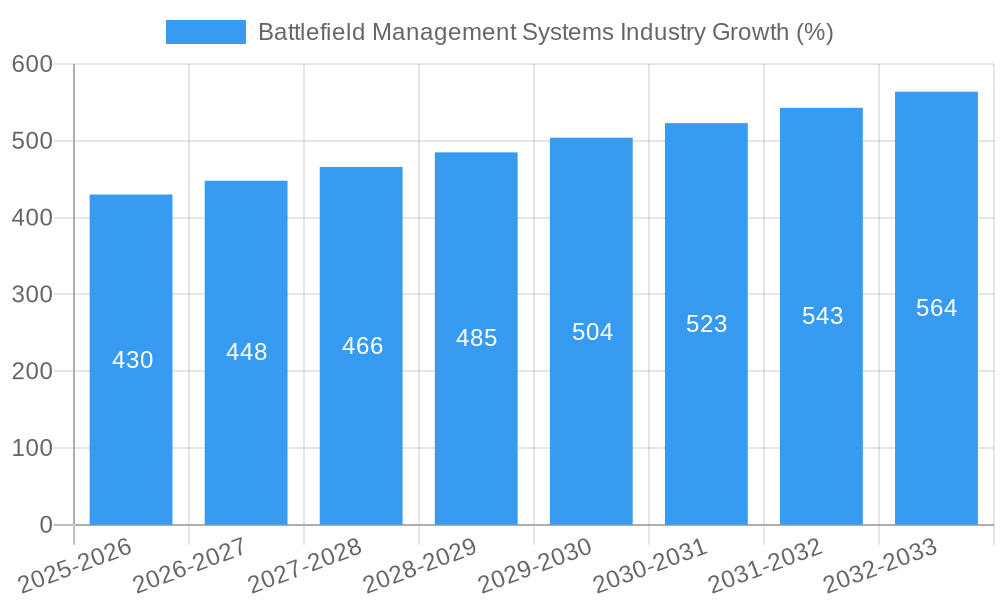
The Battlefield Management Systems market experienced steady growth from 2019 to 2024, driven by increasing defense budgets globally and the demand for enhanced situational awareness and coordinated operations. The market size increased from xx Million in 2019 to xx Million in 2024. Adoption rates vary across regions and end-users, with advanced economies exhibiting higher penetration. Technological disruptions, such as the integration of AI and cloud computing, are accelerating the transition to more intelligent and interconnected BMS. Shifting consumer behavior, primarily driven by the need for improved interoperability and enhanced data security, fuels the demand for advanced BMS solutions.
- Market Size Evolution: Grew from xx Million in 2019 to xx Million in 2024.
- CAGR (2019-2024): xx%
- Market Penetration: xx% in advanced economies in 2024.
- Technological Disruptions: AI, cloud computing, and IoT are driving innovation.
- Consumer Behavior Shifts: Demand for interoperability and enhanced data security is increasing.
Dominant Regions, Countries, or Segments in Battlefield Management Systems Industry
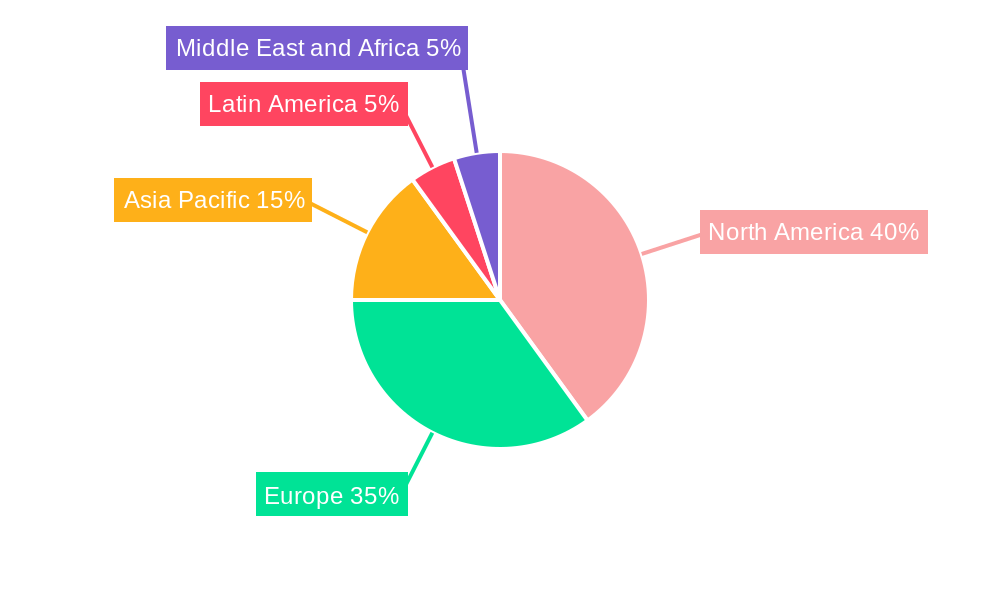
North America currently holds the largest market share in the BMS industry, followed by Europe. Within North America, the US military's significant investment in modernization programs significantly contributes to its dominance. Key drivers include robust defense budgets, technological advancements, and strong industry presence. In Europe, increasing geopolitical uncertainties and defense modernization initiatives in various countries contribute to market growth. Among the system segments, Command and Control systems hold the largest market share, driven by the demand for centralized and integrated battlefield management capabilities. The Army segment accounts for the largest end-user share, owing to the extensive use of BMS across various operational scenarios.
- Dominant Region: North America (Market Share: xx% in 2025)
- Key Drivers (North America): High defense spending, technological innovation, strong industry presence.
- Key Drivers (Europe): Geopolitical uncertainties, defense modernization initiatives.
- Largest System Segment: Command and Control Systems (Market Share: xx% in 2025)
- Largest End-User Segment: Army (Market Share: xx% in 2025)
Battlefield Management Systems Industry Product Landscape
The Battlefield Management Systems market offers a diverse range of products, including navigation systems, communication and networking systems, command and control systems, and weapon systems. Recent innovations focus on improving interoperability, data security, and situational awareness. Products incorporate advanced technologies like AI, machine learning, and cloud computing to enhance decision-making capabilities. Key performance metrics include data transmission speeds, latency, accuracy, and system resilience. Unique selling propositions often center on superior integration capabilities, enhanced user interfaces, and robust security features.
Key Drivers, Barriers & Challenges in Battlefield Management Systems Industry
Key Drivers:
- Increasing defense budgets globally.
- Growing demand for improved situational awareness.
- Technological advancements in AI, machine learning, and communication technologies.
- Need for enhanced interoperability and data security.
Key Challenges & Restraints:
- High R&D and integration costs.
- Complex certification and testing requirements.
- Potential supply chain disruptions due to geopolitical factors.
- Cybersecurity threats and data breaches.
- Intense competition from established and emerging players. This results in xx Million units lost annually.
Emerging Opportunities in Battlefield Management Systems Industry
- Expanding adoption of AI and machine learning in BMS.
- Integration of IoT devices for improved situational awareness.
- Growth in unmanned systems and autonomous capabilities.
- Development of robust cybersecurity solutions to mitigate threats.
- Increased focus on interoperability and data sharing across different platforms.
Growth Accelerators in the Battlefield Management Systems Industry Industry
Technological breakthroughs in areas like AI, cloud computing, and advanced communication systems are driving long-term growth. Strategic partnerships between defense contractors and technology companies are accelerating innovation and market penetration. Expansion into new markets, particularly in developing economies, presents significant growth opportunities.
Key Players Shaping the Battlefield Management Systems Market
- THALES
- L3Harris Technologies Inc
- General Dynamics Corporation
- Rheinmetall AG
- Kongsberg Gruppen ASA
- Elbit Systems Ltd
- RTX Corporation
- ASELSAN A.Ş
- Leonardo DRS Inc (Leonardo S.p.A)
- BAE Systems plc
- Indra Sistemas S.A
- Saab AB
Notable Milestones in Battlefield Management Systems Industry Sector
- 2021: Introduction of AI-powered situational awareness system by THALES.
- 2022: Strategic partnership between L3Harris and RTX for joint development of next-gen BMS.
- 2023: Acquisition of a smaller BMS provider by General Dynamics.
- 2024: Launch of a new communication and networking system by Rheinmetall.
In-Depth Battlefield Management Systems Industry Market Outlook
The Battlefield Management Systems market is poised for robust growth over the next decade. Continuous technological advancements, increasing defense spending, and the growing need for enhanced battlefield coordination will drive market expansion. Strategic partnerships, M&A activities, and expansion into emerging markets will further fuel growth. The focus on improved interoperability, cybersecurity, and AI-powered capabilities will shape the future landscape of the BMS industry, presenting lucrative opportunities for innovative players.
Battlefield Management Systems Industry Segmentation
-
1. System
- 1.1. Navigation Systems
- 1.2. Communication and Networking Systems
- 1.3. Command and Control Systems
- 1.4. Weapon Systems
-
2. End User
- 2.1. Army
- 2.2. Air Force
- 2.3. Navy
Battlefield Management Systems Industry Segmentation By Geography
-
1. North America
- 1.1. United States
- 1.2. Canada
-
2. Europe
- 2.1. United Kingdom
- 2.2. Germany
- 2.3. France
- 2.4. Rest of Europe
-
3. Asia Pacific
- 3.1. China
- 3.2. India
- 3.3. Japan
- 3.4. South Korea
- 3.5. Rest of Asia Pacific
-
4. Latin America
- 4.1. Brazil
- 4.2. Rest of Latin America
-
5. Middle East and Africa
- 5.1. United Arab Emirates
- 5.2. Saudi Arabia
- 5.3. Israel
- 5.4. Rest of Middle East and Africa
Battlefield Management Systems Industry REPORT HIGHLIGHTS
| Aspects | Details |
|---|---|
| Study Period | 2019-2033 |
| Base Year | 2024 |
| Estimated Year | 2025 |
| Forecast Period | 2025-2033 |
| Historical Period | 2019-2024 |
| Growth Rate | CAGR of 3.83% from 2019-2033 |
| Segmentation |
|
Table of Contents
- 1. Introduction
- 1.1. Research Scope
- 1.2. Market Segmentation
- 1.3. Research Methodology
- 1.4. Definitions and Assumptions
- 2. Executive Summary
- 2.1. Introduction
- 3. Market Dynamics
- 3.1. Introduction
- 3.2. Market Drivers
- 3.3. Market Restrains
- 3.4. Market Trends
- 3.4.1. Army Segment To Witness Highest Growth During the Forecast Period
- 4. Market Factor Analysis
- 4.1. Porters Five Forces
- 4.2. Supply/Value Chain
- 4.3. PESTEL analysis
- 4.4. Market Entropy
- 4.5. Patent/Trademark Analysis
- 5. Global Battlefield Management Systems Industry Analysis, Insights and Forecast, 2019-2031
- 5.1. Market Analysis, Insights and Forecast - by System
- 5.1.1. Navigation Systems
- 5.1.2. Communication and Networking Systems
- 5.1.3. Command and Control Systems
- 5.1.4. Weapon Systems
- 5.2. Market Analysis, Insights and Forecast - by End User
- 5.2.1. Army
- 5.2.2. Air Force
- 5.2.3. Navy
- 5.3. Market Analysis, Insights and Forecast - by Region
- 5.3.1. North America
- 5.3.2. Europe
- 5.3.3. Asia Pacific
- 5.3.4. Latin America
- 5.3.5. Middle East and Africa
- 5.1. Market Analysis, Insights and Forecast - by System
- 6. North America Battlefield Management Systems Industry Analysis, Insights and Forecast, 2019-2031
- 6.1. Market Analysis, Insights and Forecast - by System
- 6.1.1. Navigation Systems
- 6.1.2. Communication and Networking Systems
- 6.1.3. Command and Control Systems
- 6.1.4. Weapon Systems
- 6.2. Market Analysis, Insights and Forecast - by End User
- 6.2.1. Army
- 6.2.2. Air Force
- 6.2.3. Navy
- 6.1. Market Analysis, Insights and Forecast - by System
- 7. Europe Battlefield Management Systems Industry Analysis, Insights and Forecast, 2019-2031
- 7.1. Market Analysis, Insights and Forecast - by System
- 7.1.1. Navigation Systems
- 7.1.2. Communication and Networking Systems
- 7.1.3. Command and Control Systems
- 7.1.4. Weapon Systems
- 7.2. Market Analysis, Insights and Forecast - by End User
- 7.2.1. Army
- 7.2.2. Air Force
- 7.2.3. Navy
- 7.1. Market Analysis, Insights and Forecast - by System
- 8. Asia Pacific Battlefield Management Systems Industry Analysis, Insights and Forecast, 2019-2031
- 8.1. Market Analysis, Insights and Forecast - by System
- 8.1.1. Navigation Systems
- 8.1.2. Communication and Networking Systems
- 8.1.3. Command and Control Systems
- 8.1.4. Weapon Systems
- 8.2. Market Analysis, Insights and Forecast - by End User
- 8.2.1. Army
- 8.2.2. Air Force
- 8.2.3. Navy
- 8.1. Market Analysis, Insights and Forecast - by System
- 9. Latin America Battlefield Management Systems Industry Analysis, Insights and Forecast, 2019-2031
- 9.1. Market Analysis, Insights and Forecast - by System
- 9.1.1. Navigation Systems
- 9.1.2. Communication and Networking Systems
- 9.1.3. Command and Control Systems
- 9.1.4. Weapon Systems
- 9.2. Market Analysis, Insights and Forecast - by End User
- 9.2.1. Army
- 9.2.2. Air Force
- 9.2.3. Navy
- 9.1. Market Analysis, Insights and Forecast - by System
- 10. Middle East and Africa Battlefield Management Systems Industry Analysis, Insights and Forecast, 2019-2031
- 10.1. Market Analysis, Insights and Forecast - by System
- 10.1.1. Navigation Systems
- 10.1.2. Communication and Networking Systems
- 10.1.3. Command and Control Systems
- 10.1.4. Weapon Systems
- 10.2. Market Analysis, Insights and Forecast - by End User
- 10.2.1. Army
- 10.2.2. Air Force
- 10.2.3. Navy
- 10.1. Market Analysis, Insights and Forecast - by System
- 11. North America Battlefield Management Systems Industry Analysis, Insights and Forecast, 2019-2031
- 11.1. Market Analysis, Insights and Forecast - By Country/Sub-region
- 11.1.1 United States
- 11.1.2 Canda
- 12. Europe Battlefield Management Systems Industry Analysis, Insights and Forecast, 2019-2031
- 12.1. Market Analysis, Insights and Forecast - By Country/Sub-region
- 12.1.1 United Kingdom
- 12.1.2 Germany
- 12.1.3 France
- 12.1.4 Rest of Europe
- 13. Asia Pacific Battlefield Management Systems Industry Analysis, Insights and Forecast, 2019-2031
- 13.1. Market Analysis, Insights and Forecast - By Country/Sub-region
- 13.1.1 China
- 13.1.2 India
- 13.1.3 Japan
- 13.1.4 South Korea
- 13.1.5 Rest of Asia Pacific
- 14. Latin America Battlefield Management Systems Industry Analysis, Insights and Forecast, 2019-2031
- 14.1. Market Analysis, Insights and Forecast - By Country/Sub-region
- 14.1.1 Brazil
- 14.1.2 Mexico
- 14.1.3 Rest of Latin America
- 15. Middle East and Africa Battlefield Management Systems Industry Analysis, Insights and Forecast, 2019-2031
- 15.1. Market Analysis, Insights and Forecast - By Country/Sub-region
- 15.1.1 United Arab Emirates
- 15.1.2 Saudi Arabia
- 15.1.3 Israel
- 15.1.4 Egypt
- 15.1.5 Rest of Middle East and Africa
- 16. Competitive Analysis
- 16.1. Global Market Share Analysis 2024
- 16.2. Company Profiles
- 16.2.1 THALE
- 16.2.1.1. Overview
- 16.2.1.2. Products
- 16.2.1.3. SWOT Analysis
- 16.2.1.4. Recent Developments
- 16.2.1.5. Financials (Based on Availability)
- 16.2.2 L3Harris Technologies Inc
- 16.2.2.1. Overview
- 16.2.2.2. Products
- 16.2.2.3. SWOT Analysis
- 16.2.2.4. Recent Developments
- 16.2.2.5. Financials (Based on Availability)
- 16.2.3 General Dynamics Corporation
- 16.2.3.1. Overview
- 16.2.3.2. Products
- 16.2.3.3. SWOT Analysis
- 16.2.3.4. Recent Developments
- 16.2.3.5. Financials (Based on Availability)
- 16.2.4 Rheinmetall AG
- 16.2.4.1. Overview
- 16.2.4.2. Products
- 16.2.4.3. SWOT Analysis
- 16.2.4.4. Recent Developments
- 16.2.4.5. Financials (Based on Availability)
- 16.2.5 Kongsberg Gruppen ASA
- 16.2.5.1. Overview
- 16.2.5.2. Products
- 16.2.5.3. SWOT Analysis
- 16.2.5.4. Recent Developments
- 16.2.5.5. Financials (Based on Availability)
- 16.2.6 Elbit Systems Ltd
- 16.2.6.1. Overview
- 16.2.6.2. Products
- 16.2.6.3. SWOT Analysis
- 16.2.6.4. Recent Developments
- 16.2.6.5. Financials (Based on Availability)
- 16.2.7 RTX Corporation
- 16.2.7.1. Overview
- 16.2.7.2. Products
- 16.2.7.3. SWOT Analysis
- 16.2.7.4. Recent Developments
- 16.2.7.5. Financials (Based on Availability)
- 16.2.8 ASELSAN A S
- 16.2.8.1. Overview
- 16.2.8.2. Products
- 16.2.8.3. SWOT Analysis
- 16.2.8.4. Recent Developments
- 16.2.8.5. Financials (Based on Availability)
- 16.2.9 Leonardo DRS Inc (Leonardo S p A )
- 16.2.9.1. Overview
- 16.2.9.2. Products
- 16.2.9.3. SWOT Analysis
- 16.2.9.4. Recent Developments
- 16.2.9.5. Financials (Based on Availability)
- 16.2.10 BAE Systems plc
- 16.2.10.1. Overview
- 16.2.10.2. Products
- 16.2.10.3. SWOT Analysis
- 16.2.10.4. Recent Developments
- 16.2.10.5. Financials (Based on Availability)
- 16.2.11 Indra Sistemas S A
- 16.2.11.1. Overview
- 16.2.11.2. Products
- 16.2.11.3. SWOT Analysis
- 16.2.11.4. Recent Developments
- 16.2.11.5. Financials (Based on Availability)
- 16.2.12 Saab AB
- 16.2.12.1. Overview
- 16.2.12.2. Products
- 16.2.12.3. SWOT Analysis
- 16.2.12.4. Recent Developments
- 16.2.12.5. Financials (Based on Availability)
- 16.2.1 THALE
List of Figures
- Figure 1: Global Battlefield Management Systems Industry Revenue Breakdown (Million, %) by Region 2024 & 2032
- Figure 2: North America Battlefield Management Systems Industry Revenue (Million), by Country 2024 & 2032
- Figure 3: North America Battlefield Management Systems Industry Revenue Share (%), by Country 2024 & 2032
- Figure 4: Europe Battlefield Management Systems Industry Revenue (Million), by Country 2024 & 2032
- Figure 5: Europe Battlefield Management Systems Industry Revenue Share (%), by Country 2024 & 2032
- Figure 6: Asia Pacific Battlefield Management Systems Industry Revenue (Million), by Country 2024 & 2032
- Figure 7: Asia Pacific Battlefield Management Systems Industry Revenue Share (%), by Country 2024 & 2032
- Figure 8: Latin America Battlefield Management Systems Industry Revenue (Million), by Country 2024 & 2032
- Figure 9: Latin America Battlefield Management Systems Industry Revenue Share (%), by Country 2024 & 2032
- Figure 10: Middle East and Africa Battlefield Management Systems Industry Revenue (Million), by Country 2024 & 2032
- Figure 11: Middle East and Africa Battlefield Management Systems Industry Revenue Share (%), by Country 2024 & 2032
- Figure 12: North America Battlefield Management Systems Industry Revenue (Million), by System 2024 & 2032
- Figure 13: North America Battlefield Management Systems Industry Revenue Share (%), by System 2024 & 2032
- Figure 14: North America Battlefield Management Systems Industry Revenue (Million), by End User 2024 & 2032
- Figure 15: North America Battlefield Management Systems Industry Revenue Share (%), by End User 2024 & 2032
- Figure 16: North America Battlefield Management Systems Industry Revenue (Million), by Country 2024 & 2032
- Figure 17: North America Battlefield Management Systems Industry Revenue Share (%), by Country 2024 & 2032
- Figure 18: Europe Battlefield Management Systems Industry Revenue (Million), by System 2024 & 2032
- Figure 19: Europe Battlefield Management Systems Industry Revenue Share (%), by System 2024 & 2032
- Figure 20: Europe Battlefield Management Systems Industry Revenue (Million), by End User 2024 & 2032
- Figure 21: Europe Battlefield Management Systems Industry Revenue Share (%), by End User 2024 & 2032
- Figure 22: Europe Battlefield Management Systems Industry Revenue (Million), by Country 2024 & 2032
- Figure 23: Europe Battlefield Management Systems Industry Revenue Share (%), by Country 2024 & 2032
- Figure 24: Asia Pacific Battlefield Management Systems Industry Revenue (Million), by System 2024 & 2032
- Figure 25: Asia Pacific Battlefield Management Systems Industry Revenue Share (%), by System 2024 & 2032
- Figure 26: Asia Pacific Battlefield Management Systems Industry Revenue (Million), by End User 2024 & 2032
- Figure 27: Asia Pacific Battlefield Management Systems Industry Revenue Share (%), by End User 2024 & 2032
- Figure 28: Asia Pacific Battlefield Management Systems Industry Revenue (Million), by Country 2024 & 2032
- Figure 29: Asia Pacific Battlefield Management Systems Industry Revenue Share (%), by Country 2024 & 2032
- Figure 30: Latin America Battlefield Management Systems Industry Revenue (Million), by System 2024 & 2032
- Figure 31: Latin America Battlefield Management Systems Industry Revenue Share (%), by System 2024 & 2032
- Figure 32: Latin America Battlefield Management Systems Industry Revenue (Million), by End User 2024 & 2032
- Figure 33: Latin America Battlefield Management Systems Industry Revenue Share (%), by End User 2024 & 2032
- Figure 34: Latin America Battlefield Management Systems Industry Revenue (Million), by Country 2024 & 2032
- Figure 35: Latin America Battlefield Management Systems Industry Revenue Share (%), by Country 2024 & 2032
- Figure 36: Middle East and Africa Battlefield Management Systems Industry Revenue (Million), by System 2024 & 2032
- Figure 37: Middle East and Africa Battlefield Management Systems Industry Revenue Share (%), by System 2024 & 2032
- Figure 38: Middle East and Africa Battlefield Management Systems Industry Revenue (Million), by End User 2024 & 2032
- Figure 39: Middle East and Africa Battlefield Management Systems Industry Revenue Share (%), by End User 2024 & 2032
- Figure 40: Middle East and Africa Battlefield Management Systems Industry Revenue (Million), by Country 2024 & 2032
- Figure 41: Middle East and Africa Battlefield Management Systems Industry Revenue Share (%), by Country 2024 & 2032
List of Tables
- Table 1: Global Battlefield Management Systems Industry Revenue Million Forecast, by Region 2019 & 2032
- Table 2: Global Battlefield Management Systems Industry Revenue Million Forecast, by System 2019 & 2032
- Table 3: Global Battlefield Management Systems Industry Revenue Million Forecast, by End User 2019 & 2032
- Table 4: Global Battlefield Management Systems Industry Revenue Million Forecast, by Region 2019 & 2032
- Table 5: Global Battlefield Management Systems Industry Revenue Million Forecast, by Country 2019 & 2032
- Table 6: United States Battlefield Management Systems Industry Revenue (Million) Forecast, by Application 2019 & 2032
- Table 7: Canda Battlefield Management Systems Industry Revenue (Million) Forecast, by Application 2019 & 2032
- Table 8: Global Battlefield Management Systems Industry Revenue Million Forecast, by Country 2019 & 2032
- Table 9: United Kingdom Battlefield Management Systems Industry Revenue (Million) Forecast, by Application 2019 & 2032
- Table 10: Germany Battlefield Management Systems Industry Revenue (Million) Forecast, by Application 2019 & 2032
- Table 11: France Battlefield Management Systems Industry Revenue (Million) Forecast, by Application 2019 & 2032
- Table 12: Rest of Europe Battlefield Management Systems Industry Revenue (Million) Forecast, by Application 2019 & 2032
- Table 13: Global Battlefield Management Systems Industry Revenue Million Forecast, by Country 2019 & 2032
- Table 14: China Battlefield Management Systems Industry Revenue (Million) Forecast, by Application 2019 & 2032
- Table 15: India Battlefield Management Systems Industry Revenue (Million) Forecast, by Application 2019 & 2032
- Table 16: Japan Battlefield Management Systems Industry Revenue (Million) Forecast, by Application 2019 & 2032
- Table 17: South Korea Battlefield Management Systems Industry Revenue (Million) Forecast, by Application 2019 & 2032
- Table 18: Rest of Asia Pacific Battlefield Management Systems Industry Revenue (Million) Forecast, by Application 2019 & 2032
- Table 19: Global Battlefield Management Systems Industry Revenue Million Forecast, by Country 2019 & 2032
- Table 20: Brazil Battlefield Management Systems Industry Revenue (Million) Forecast, by Application 2019 & 2032
- Table 21: Mexico Battlefield Management Systems Industry Revenue (Million) Forecast, by Application 2019 & 2032
- Table 22: Rest of Latin America Battlefield Management Systems Industry Revenue (Million) Forecast, by Application 2019 & 2032
- Table 23: Global Battlefield Management Systems Industry Revenue Million Forecast, by Country 2019 & 2032
- Table 24: United Arab Emirates Battlefield Management Systems Industry Revenue (Million) Forecast, by Application 2019 & 2032
- Table 25: Saudi Arabia Battlefield Management Systems Industry Revenue (Million) Forecast, by Application 2019 & 2032
- Table 26: Israel Battlefield Management Systems Industry Revenue (Million) Forecast, by Application 2019 & 2032
- Table 27: Egypt Battlefield Management Systems Industry Revenue (Million) Forecast, by Application 2019 & 2032
- Table 28: Rest of Middle East and Africa Battlefield Management Systems Industry Revenue (Million) Forecast, by Application 2019 & 2032
- Table 29: Global Battlefield Management Systems Industry Revenue Million Forecast, by System 2019 & 2032
- Table 30: Global Battlefield Management Systems Industry Revenue Million Forecast, by End User 2019 & 2032
- Table 31: Global Battlefield Management Systems Industry Revenue Million Forecast, by Country 2019 & 2032
- Table 32: United States Battlefield Management Systems Industry Revenue (Million) Forecast, by Application 2019 & 2032
- Table 33: Canada Battlefield Management Systems Industry Revenue (Million) Forecast, by Application 2019 & 2032
- Table 34: Global Battlefield Management Systems Industry Revenue Million Forecast, by System 2019 & 2032
- Table 35: Global Battlefield Management Systems Industry Revenue Million Forecast, by End User 2019 & 2032
- Table 36: Global Battlefield Management Systems Industry Revenue Million Forecast, by Country 2019 & 2032
- Table 37: United Kingdom Battlefield Management Systems Industry Revenue (Million) Forecast, by Application 2019 & 2032
- Table 38: Germany Battlefield Management Systems Industry Revenue (Million) Forecast, by Application 2019 & 2032
- Table 39: France Battlefield Management Systems Industry Revenue (Million) Forecast, by Application 2019 & 2032
- Table 40: Rest of Europe Battlefield Management Systems Industry Revenue (Million) Forecast, by Application 2019 & 2032
- Table 41: Global Battlefield Management Systems Industry Revenue Million Forecast, by System 2019 & 2032
- Table 42: Global Battlefield Management Systems Industry Revenue Million Forecast, by End User 2019 & 2032
- Table 43: Global Battlefield Management Systems Industry Revenue Million Forecast, by Country 2019 & 2032
- Table 44: China Battlefield Management Systems Industry Revenue (Million) Forecast, by Application 2019 & 2032
- Table 45: India Battlefield Management Systems Industry Revenue (Million) Forecast, by Application 2019 & 2032
- Table 46: Japan Battlefield Management Systems Industry Revenue (Million) Forecast, by Application 2019 & 2032
- Table 47: South Korea Battlefield Management Systems Industry Revenue (Million) Forecast, by Application 2019 & 2032
- Table 48: Rest of Asia Pacific Battlefield Management Systems Industry Revenue (Million) Forecast, by Application 2019 & 2032
- Table 49: Global Battlefield Management Systems Industry Revenue Million Forecast, by System 2019 & 2032
- Table 50: Global Battlefield Management Systems Industry Revenue Million Forecast, by End User 2019 & 2032
- Table 51: Global Battlefield Management Systems Industry Revenue Million Forecast, by Country 2019 & 2032
- Table 52: Brazil Battlefield Management Systems Industry Revenue (Million) Forecast, by Application 2019 & 2032
- Table 53: Rest of Latin America Battlefield Management Systems Industry Revenue (Million) Forecast, by Application 2019 & 2032
- Table 54: Global Battlefield Management Systems Industry Revenue Million Forecast, by System 2019 & 2032
- Table 55: Global Battlefield Management Systems Industry Revenue Million Forecast, by End User 2019 & 2032
- Table 56: Global Battlefield Management Systems Industry Revenue Million Forecast, by Country 2019 & 2032
- Table 57: United Arab Emirates Battlefield Management Systems Industry Revenue (Million) Forecast, by Application 2019 & 2032
- Table 58: Saudi Arabia Battlefield Management Systems Industry Revenue (Million) Forecast, by Application 2019 & 2032
- Table 59: Israel Battlefield Management Systems Industry Revenue (Million) Forecast, by Application 2019 & 2032
- Table 60: Rest of Middle East and Africa Battlefield Management Systems Industry Revenue (Million) Forecast, by Application 2019 & 2032
Frequently Asked Questions
1. What is the projected Compound Annual Growth Rate (CAGR) of the Battlefield Management Systems Industry?
The projected CAGR is approximately 3.83%.
2. Which companies are prominent players in the Battlefield Management Systems Industry?
Key companies in the market include THALE, L3Harris Technologies Inc, General Dynamics Corporation, Rheinmetall AG, Kongsberg Gruppen ASA, Elbit Systems Ltd, RTX Corporation, ASELSAN A S, Leonardo DRS Inc (Leonardo S p A ), BAE Systems plc, Indra Sistemas S A, Saab AB.
3. What are the main segments of the Battlefield Management Systems Industry?
The market segments include System, End User.
4. Can you provide details about the market size?
The market size is estimated to be USD 11.09 Million as of 2022.
5. What are some drivers contributing to market growth?
N/A
6. What are the notable trends driving market growth?
Army Segment To Witness Highest Growth During the Forecast Period.
7. Are there any restraints impacting market growth?
N/A
8. Can you provide examples of recent developments in the market?
N/A
9. What pricing options are available for accessing the report?
Pricing options include single-user, multi-user, and enterprise licenses priced at USD 4750, USD 5250, and USD 8750 respectively.
10. Is the market size provided in terms of value or volume?
The market size is provided in terms of value, measured in Million.
11. Are there any specific market keywords associated with the report?
Yes, the market keyword associated with the report is "Battlefield Management Systems Industry," which aids in identifying and referencing the specific market segment covered.
12. How do I determine which pricing option suits my needs best?
The pricing options vary based on user requirements and access needs. Individual users may opt for single-user licenses, while businesses requiring broader access may choose multi-user or enterprise licenses for cost-effective access to the report.
13. Are there any additional resources or data provided in the Battlefield Management Systems Industry report?
While the report offers comprehensive insights, it's advisable to review the specific contents or supplementary materials provided to ascertain if additional resources or data are available.
14. How can I stay updated on further developments or reports in the Battlefield Management Systems Industry?
To stay informed about further developments, trends, and reports in the Battlefield Management Systems Industry, consider subscribing to industry newsletters, following relevant companies and organizations, or regularly checking reputable industry news sources and publications.
Methodology
Step 1 - Identification of Relevant Samples Size from Population Database


Step 2 - Approaches for Defining Global Market Size (Value, Volume* & Price*)

Note*: In applicable scenarios
Step 3 - Data Sources
Primary Research
- Web Analytics
- Survey Reports
- Research Institute
- Latest Research Reports
- Opinion Leaders
Secondary Research
- Annual Reports
- White Paper
- Latest Press Release
- Industry Association
- Paid Database
- Investor Presentations

Step 4 - Data Triangulation
Involves using different sources of information in order to increase the validity of a study
These sources are likely to be stakeholders in a program - participants, other researchers, program staff, other community members, and so on.
Then we put all data in single framework & apply various statistical tools to find out the dynamic on the market.
During the analysis stage, feedback from the stakeholder groups would be compared to determine areas of agreement as well as areas of divergence
