

Key Insights
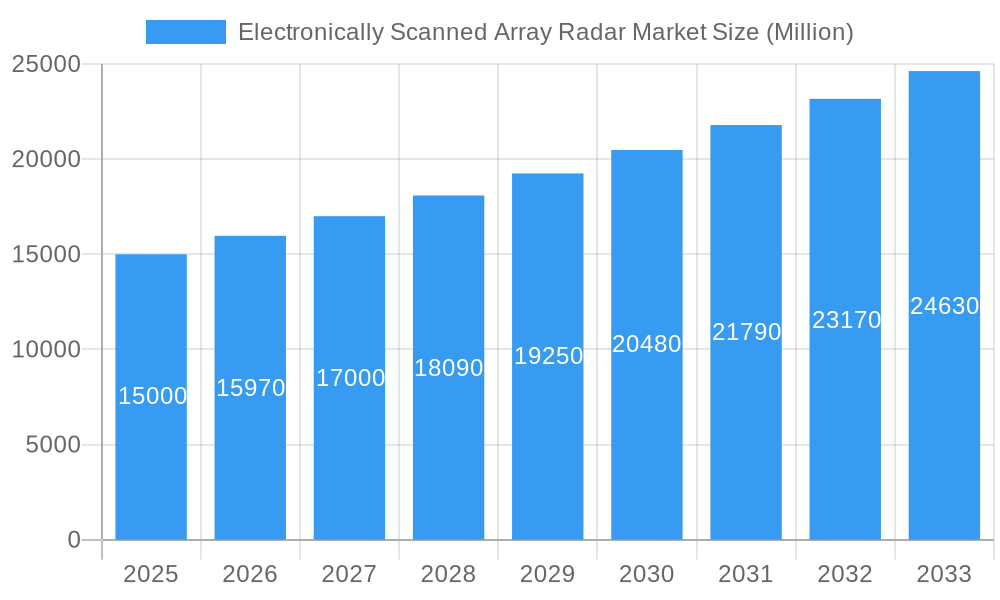
The Electronically Scanned Array (ESA) radar market is experiencing substantial expansion, fueled by the escalating demand for sophisticated surveillance and defense solutions. Projections indicate a Compound Annual Growth Rate (CAGR) of 9.7%, propelling the market to an estimated size of $12.35 billion by 2025. Key growth drivers include the imperative for enhanced situational awareness, superior target detection, and the seamless integration of ESA radars into autonomous platforms. Innovations in miniaturization and advanced signal processing further bolster market momentum. The market is segmented by technology into Active ESA and Passive ESA, with applications across land, air, and maritime domains. The retrofit segment presents significant opportunities as legacy systems are upgraded. Leading industry players, including Raytheon Technologies Corporation, Thales, and Lockheed Martin, are actively investing in research and development and forging strategic alliances. North America currently leads the market, attributed to robust defense expenditures and technological leadership. However, the Asia-Pacific region is poised for rapid growth, driven by increasing defense investments and modernization initiatives in key economies.
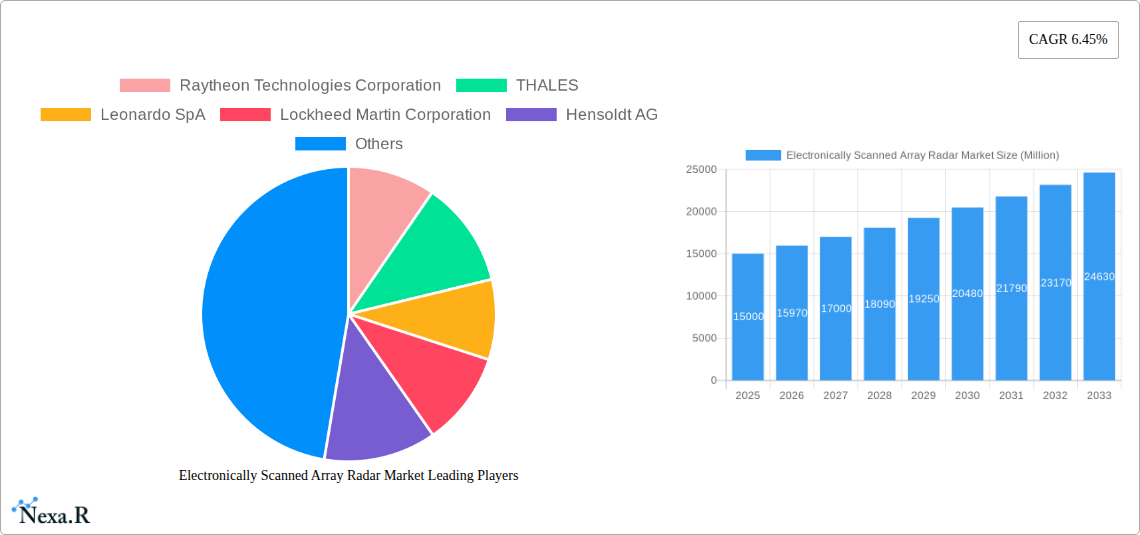
Electronically Scanned Array Radar Market Market Size (In Billion)
Market challenges, such as the high initial investment for ESA radar systems and integration complexities, are being mitigated by the long-term performance and efficiency benefits. The expanding adoption of ESA radars in civilian sectors, including air traffic control and meteorology, is broadening the market's scope. Future developments will concentrate on creating more compact, cost-effective, and energy-efficient ESA radar systems, complemented by advancements in artificial intelligence and machine learning for superior target identification and tracking. These innovations will solidify ESA radar's role as a cornerstone of modern surveillance and defense infrastructure.
Electronically Scanned Array Radar Market Company Market Share
Electronically Scanned Array Radar Market Report: 2019-2033
This comprehensive report provides an in-depth analysis of the Electronically Scanned Array (ESA) Radar market, encompassing its parent market (Defense Electronics) and child markets (Airborne Radar, Maritime Radar, Ground-Based Radar). The study period covers 2019-2033, with 2025 as the base and estimated year. The forecast period is 2025-2033, and the historical period is 2019-2024. The market size is projected to reach xx Million units by 2033, exhibiting significant growth. This report is invaluable for industry professionals, investors, and strategists seeking to understand and capitalize on opportunities within this dynamic sector.
Electronically Scanned Array Radar Market Dynamics & Structure
The Electronically Scanned Array Radar market is characterized by moderate concentration, with key players like Raytheon Technologies Corporation, Thales, and Lockheed Martin Corporation holding significant market share. Technological innovation, driven by advancements in semiconductor technology and signal processing, is a major growth driver. Stringent regulatory frameworks governing defense technology influence market dynamics. Competitive product substitutes, including traditional phased array radars, exert some pressure, although ESA radars are increasingly favored for their superior performance. The end-user demographic is primarily comprised of defense forces and governmental agencies globally. M&A activity within the sector is moderate, with xx deals recorded in the past five years, primarily focused on enhancing technological capabilities and expanding market reach.
- Market Concentration: Moderately concentrated, with top 5 players holding approximately xx% market share (2024).
- Technological Innovation: Advancements in GaN technology, digital beamforming, and AI-based signal processing are key drivers.
- Regulatory Landscape: Export controls and security clearances impact market access in certain regions.
- Competitive Substitutes: Traditional phased array radars pose limited competition due to ESA's superior capabilities.
- M&A Activity: xx M&A deals in the last 5 years, focusing on technology acquisition and geographical expansion.
- Innovation Barriers: High R&D costs and complex integration processes present challenges.
Electronically Scanned Array Radar Market Growth Trends & Insights
The global Electronically Scanned Array Radar market has witnessed robust growth from 2019 to 2024, expanding from xx Million units to xx Million units, exhibiting a CAGR of xx%. This growth is primarily attributed to increasing defense budgets, modernization of military assets, and the growing demand for advanced radar systems across various platforms (air, land, and sea). Technological disruptions, such as the adoption of GaN-based technology and improved software-defined radio capabilities, further enhance radar performance and fuel market expansion. A shift towards multi-functional radar systems and integrated sensor solutions is also influencing market trends. Market penetration is highest in developed nations, with developing economies showing significant growth potential. Consumer behavior shifts towards demanding higher performance, lower maintenance, and improved reliability are further influencing product development and market dynamics.
Dominant Regions, Countries, or Segments in Electronically Scanned Array Radar Market
North America currently dominates the Electronically Scanned Array Radar market, holding approximately xx% of the global market share in 2024, followed by Europe and Asia-Pacific. Within the types, Active Electronically Scanned Array (AESA) radars hold a larger market share compared to Passive Electronically Scanned Array (PESA) radars due to their superior capabilities. The Air segment dominates the platform market owing to high demand from air forces globally. Line Fit installations hold a larger market share compared to Retrofit installations. Several factors contribute to this dominance:
- North America: High defense spending, technological advancements, and strong presence of major market players.
- Europe: Significant defense modernization programs and a robust aerospace industry.
- Asia-Pacific: Increasing defense budgets in several nations, leading to higher demand for advanced radar systems.
- AESA Type: Superior performance and functionalities compared to PESA, driving market growth.
- Air Platform: High demand for airborne early warning and control (AEW&C) and fighter aircraft.
- Line Fit: Cost-effectiveness and ease of integration during the manufacturing process.
Electronically Scanned Array Radar Market Product Landscape
The Electronically Scanned Array Radar market showcases continuous product innovation, encompassing advancements in signal processing algorithms, improved antenna designs (e.g., miniaturization and conformal arrays), and enhanced software-defined capabilities. This translates to radars with superior detection range, higher accuracy, and improved anti-jamming capabilities. Key features include advanced target recognition algorithms, improved electronic countermeasure (ECM) capabilities, and integration with other sensor systems for enhanced situational awareness. Unique selling propositions highlight improved situational awareness, improved target identification, and enhanced operational capabilities compared to traditional radar systems.
Key Drivers, Barriers & Challenges in Electronically Scanned Array Radar Market
Key Drivers:
- Increasing defense budgets globally.
- Growing demand for advanced surveillance and reconnaissance capabilities.
- Technological advancements in semiconductor technology and signal processing.
- Need for improved situational awareness in modern warfare.
Key Challenges:
- High initial investment costs for AESA technology.
- Complex integration processes and system compatibility issues.
- Supply chain vulnerabilities related to critical components.
- Stringent regulatory requirements and export controls in certain markets. This poses a significant barrier to entry for new players and restricts market access in some regions. The impact is a reduced market size by approximately xx Million units compared to a potential scenario without these restrictions.
Emerging Opportunities in Electronically Scanned Array Radar Market
- Expansion into emerging markets with growing defense budgets.
- Development of compact and lightweight ESA radars for unmanned aerial vehicles (UAVs).
- Integration of AI and machine learning for improved target recognition and threat assessment.
- Development of multi-functional radars with combined capabilities for surveillance, tracking, and targeting.
Growth Accelerators in the Electronically Scanned Array Radar Market Industry
Technological advancements, particularly in GaN technology and advanced signal processing, are significantly accelerating market growth. Strategic partnerships and collaborations between defense contractors and technology providers are driving innovation and product development. Expansion into new applications, such as air traffic control and weather forecasting, will further contribute to market expansion.
Key Players Shaping the Electronically Scanned Array Radar Market Market
Notable Milestones in Electronically Scanned Array Radar Market Sector
- March 2023: The Indian Ministry of Defence (MoD) signed two contracts worth USD 448.44 million with Bharat Electronics Limited (BEL) for radar and warning receivers. This signifies growing demand in the Asia-Pacific region.
- September 2022: Raytheon secured a USD 19.4 million contract to supply components for the APG-79 AESA radar system. This highlights continued demand for AESA technology.
In-Depth Electronically Scanned Array Radar Market Market Outlook
The Electronically Scanned Array Radar market is poised for continued robust growth, driven by technological advancements, increasing defense spending, and the rising demand for sophisticated radar systems across various platforms. Strategic partnerships, mergers and acquisitions, and expansion into emerging markets will further accelerate market growth. The market presents significant opportunities for companies involved in the design, development, and manufacturing of AESA radars and associated technologies. The projected growth rate over the forecast period is exceptionally promising.
Electronically Scanned Array Radar Market Segmentation
- 1. Production Analysis
- 2. Consumption Analysis
- 3. Import Market Analysis (Value & Volume)
- 4. Export Market Analysis (Value & Volume)
- 5. Price Trend Analysis
Electronically Scanned Array Radar Market Segmentation By Geography
-
1. North America
- 1.1. United States
- 1.2. Canada
- 1.3. Mexico
-
2. South America
- 2.1. Brazil
- 2.2. Argentina
- 2.3. Rest of South America
-
3. Europe
- 3.1. United Kingdom
- 3.2. Germany
- 3.3. France
- 3.4. Italy
- 3.5. Spain
- 3.6. Russia
- 3.7. Benelux
- 3.8. Nordics
- 3.9. Rest of Europe
-
4. Middle East & Africa
- 4.1. Turkey
- 4.2. Israel
- 4.3. GCC
- 4.4. North Africa
- 4.5. South Africa
- 4.6. Rest of Middle East & Africa
-
5. Asia Pacific
- 5.1. China
- 5.2. India
- 5.3. Japan
- 5.4. South Korea
- 5.5. ASEAN
- 5.6. Oceania
- 5.7. Rest of Asia Pacific
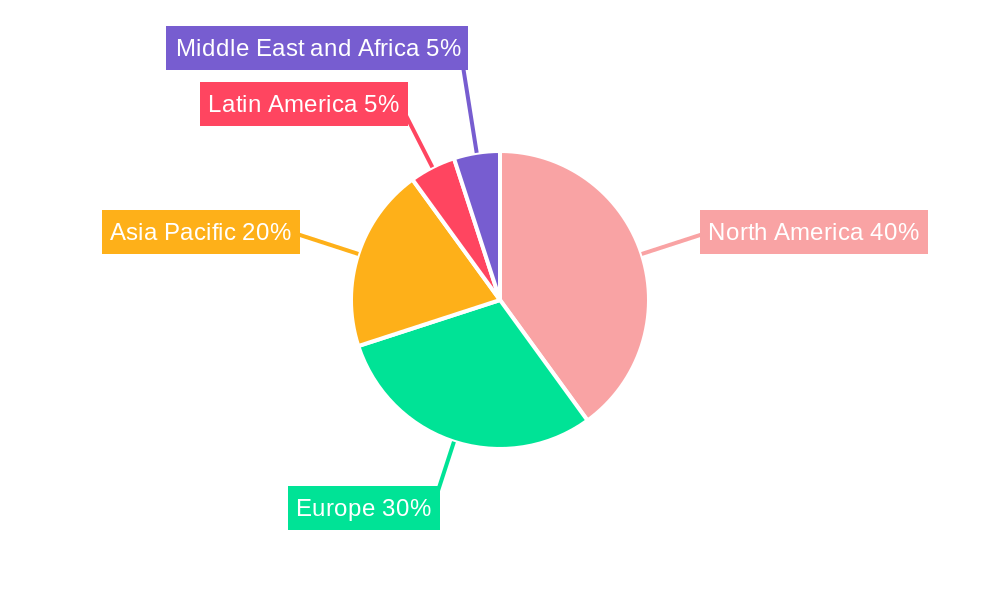
Electronically Scanned Array Radar Market Regional Market Share
Geographic Coverage of Electronically Scanned Array Radar Market
Electronically Scanned Array Radar Market REPORT HIGHLIGHTS
| Aspects | Details |
|---|---|
| Study Period | 2020-2034 |
| Base Year | 2025 |
| Estimated Year | 2026 |
| Forecast Period | 2026-2034 |
| Historical Period | 2020-2025 |
| Growth Rate | CAGR of 9.7% from 2020-2034 |
| Segmentation |
|
Table of Contents
- 1. Introduction
- 1.1. Research Scope
- 1.2. Market Segmentation
- 1.3. Research Objective
- 1.4. Definitions and Assumptions
- 2. Executive Summary
- 2.1. Market Snapshot
- 3. Market Dynamics
- 3.1. Market Drivers
- 3.2. Market Restrains
- 3.3. Market Trends
- 3.4. Market Opportunities
- 4. Market Factor Analysis
- 4.1. Porters Five Forces
- 4.1.1. Bargaining Power of Suppliers
- 4.1.2. Bargaining Power of Buyers
- 4.1.3. Threat of New Entrants
- 4.1.4. Threat of Substitutes
- 4.1.5. Competitive Rivalry
- 4.2. PESTEL analysis
- 4.3. BCG Analysis
- 4.3.1. Stars (High Growth, High Market Share)
- 4.3.2. Cash Cows (Low Growth, High Market Share)
- 4.3.3. Question Mark (High Growth, Low Market Share)
- 4.3.4. Dogs (Low Growth, Low Market Share)
- 4.4. Ansoff Matrix Analysis
- 4.5. Supply Chain Analysis
- 4.6. Regulatory Landscape
- 4.7. Current Market Potential and Opportunity Assessment (TAM–SAM–SOM Framework)
- 4.8. NRP Analyst Note
- 4.1. Porters Five Forces
- 5. Market Analysis, Insights and Forecast 2021-2033
- 5.1. Market Analysis, Insights and Forecast - by Production Analysis
- 5.2. Market Analysis, Insights and Forecast - by Consumption Analysis
- 5.3. Market Analysis, Insights and Forecast - by Import Market Analysis (Value & Volume)
- 5.4. Market Analysis, Insights and Forecast - by Export Market Analysis (Value & Volume)
- 5.5. Market Analysis, Insights and Forecast - by Price Trend Analysis
- 5.6. Market Analysis, Insights and Forecast - by Region
- 5.6.1. North America
- 5.6.2. South America
- 5.6.3. Europe
- 5.6.4. Middle East & Africa
- 5.6.5. Asia Pacific
- 6. Global Electronically Scanned Array Radar Market Analysis, Insights and Forecast, 2021-2033
- 6.1. Market Analysis, Insights and Forecast - by Production Analysis
- 6.2. Market Analysis, Insights and Forecast - by Consumption Analysis
- 6.3. Market Analysis, Insights and Forecast - by Import Market Analysis (Value & Volume)
- 6.4. Market Analysis, Insights and Forecast - by Export Market Analysis (Value & Volume)
- 6.5. Market Analysis, Insights and Forecast - by Price Trend Analysis
- 7. North America Electronically Scanned Array Radar Market Analysis, Insights and Forecast, 2020-2032
- 7.1. Market Analysis, Insights and Forecast - by Production Analysis
- 7.2. Market Analysis, Insights and Forecast - by Consumption Analysis
- 7.3. Market Analysis, Insights and Forecast - by Import Market Analysis (Value & Volume)
- 7.4. Market Analysis, Insights and Forecast - by Export Market Analysis (Value & Volume)
- 7.5. Market Analysis, Insights and Forecast - by Price Trend Analysis
- 8. South America Electronically Scanned Array Radar Market Analysis, Insights and Forecast, 2020-2032
- 8.1. Market Analysis, Insights and Forecast - by Production Analysis
- 8.2. Market Analysis, Insights and Forecast - by Consumption Analysis
- 8.3. Market Analysis, Insights and Forecast - by Import Market Analysis (Value & Volume)
- 8.4. Market Analysis, Insights and Forecast - by Export Market Analysis (Value & Volume)
- 8.5. Market Analysis, Insights and Forecast - by Price Trend Analysis
- 9. Europe Electronically Scanned Array Radar Market Analysis, Insights and Forecast, 2020-2032
- 9.1. Market Analysis, Insights and Forecast - by Production Analysis
- 9.2. Market Analysis, Insights and Forecast - by Consumption Analysis
- 9.3. Market Analysis, Insights and Forecast - by Import Market Analysis (Value & Volume)
- 9.4. Market Analysis, Insights and Forecast - by Export Market Analysis (Value & Volume)
- 9.5. Market Analysis, Insights and Forecast - by Price Trend Analysis
- 10. Middle East & Africa Electronically Scanned Array Radar Market Analysis, Insights and Forecast, 2020-2032
- 10.1. Market Analysis, Insights and Forecast - by Production Analysis
- 10.2. Market Analysis, Insights and Forecast - by Consumption Analysis
- 10.3. Market Analysis, Insights and Forecast - by Import Market Analysis (Value & Volume)
- 10.4. Market Analysis, Insights and Forecast - by Export Market Analysis (Value & Volume)
- 10.5. Market Analysis, Insights and Forecast - by Price Trend Analysis
- 11. Asia Pacific Electronically Scanned Array Radar Market Analysis, Insights and Forecast, 2020-2032
- 11.1. Market Analysis, Insights and Forecast - by Production Analysis
- 11.2. Market Analysis, Insights and Forecast - by Consumption Analysis
- 11.3. Market Analysis, Insights and Forecast - by Import Market Analysis (Value & Volume)
- 11.4. Market Analysis, Insights and Forecast - by Export Market Analysis (Value & Volume)
- 11.5. Market Analysis, Insights and Forecast - by Price Trend Analysis
- 12. Competitive Analysis
- 12.1. Company Profiles
- 12.1.1 Raytheon Technologies Corporation
- 12.1.1.1. Company Overview
- 12.1.1.2. Products
- 12.1.1.3. Company Financials
- 12.1.1.4. SWOT Analysis
- 12.1.2 THALES
- 12.1.2.1. Company Overview
- 12.1.2.2. Products
- 12.1.2.3. Company Financials
- 12.1.2.4. SWOT Analysis
- 12.1.3 Leonardo SpA
- 12.1.3.1. Company Overview
- 12.1.3.2. Products
- 12.1.3.3. Company Financials
- 12.1.3.4. SWOT Analysis
- 12.1.4 Lockheed Martin Corporation
- 12.1.4.1. Company Overview
- 12.1.4.2. Products
- 12.1.4.3. Company Financials
- 12.1.4.4. SWOT Analysis
- 12.1.5 Hensoldt AG
- 12.1.5.1. Company Overview
- 12.1.5.2. Products
- 12.1.5.3. Company Financials
- 12.1.5.4. SWOT Analysis
- 12.1.6 RADA Electronic Industries Ltd
- 12.1.6.1. Company Overview
- 12.1.6.2. Products
- 12.1.6.3. Company Financials
- 12.1.6.4. SWOT Analysis
- 12.1.7 Mitsubishi Electric Corporation
- 12.1.7.1. Company Overview
- 12.1.7.2. Products
- 12.1.7.3. Company Financials
- 12.1.7.4. SWOT Analysis
- 12.1.8 Israel Aerospace Industries
- 12.1.8.1. Company Overview
- 12.1.8.2. Products
- 12.1.8.3. Company Financials
- 12.1.8.4. SWOT Analysis
- 12.1.9 ASELSAN A
- 12.1.9.1. Company Overview
- 12.1.9.2. Products
- 12.1.9.3. Company Financials
- 12.1.9.4. SWOT Analysis
- 12.1.10 CEA Technologies
- 12.1.10.1. Company Overview
- 12.1.10.2. Products
- 12.1.10.3. Company Financials
- 12.1.10.4. SWOT Analysis
- 12.1.11 Northrop Grumman Corporation
- 12.1.11.1. Company Overview
- 12.1.11.2. Products
- 12.1.11.3. Company Financials
- 12.1.11.4. SWOT Analysis
- 12.1.12 Saab AB
- 12.1.12.1. Company Overview
- 12.1.12.2. Products
- 12.1.12.3. Company Financials
- 12.1.12.4. SWOT Analysis
- 12.1.1 Raytheon Technologies Corporation
- 12.2. Market Entropy
- 12.2.1 Company's Key Areas Served
- 12.2.2 Recent Developments
- 12.3. Company Market Share Analysis 2025
- 12.3.1 Top 5 Companies Market Share Analysis
- 12.3.2 Top 3 Companies Market Share Analysis
- 12.4. List of Potential Customers
- 13. Research Methodology
List of Figures
- Figure 1: Global Electronically Scanned Array Radar Market Revenue Breakdown (billion, %) by Region 2025 & 2033
- Figure 2: North America Electronically Scanned Array Radar Market Revenue (billion), by Production Analysis 2025 & 2033
- Figure 3: North America Electronically Scanned Array Radar Market Revenue Share (%), by Production Analysis 2025 & 2033
- Figure 4: North America Electronically Scanned Array Radar Market Revenue (billion), by Consumption Analysis 2025 & 2033
- Figure 5: North America Electronically Scanned Array Radar Market Revenue Share (%), by Consumption Analysis 2025 & 2033
- Figure 6: North America Electronically Scanned Array Radar Market Revenue (billion), by Import Market Analysis (Value & Volume) 2025 & 2033
- Figure 7: North America Electronically Scanned Array Radar Market Revenue Share (%), by Import Market Analysis (Value & Volume) 2025 & 2033
- Figure 8: North America Electronically Scanned Array Radar Market Revenue (billion), by Export Market Analysis (Value & Volume) 2025 & 2033
- Figure 9: North America Electronically Scanned Array Radar Market Revenue Share (%), by Export Market Analysis (Value & Volume) 2025 & 2033
- Figure 10: North America Electronically Scanned Array Radar Market Revenue (billion), by Price Trend Analysis 2025 & 2033
- Figure 11: North America Electronically Scanned Array Radar Market Revenue Share (%), by Price Trend Analysis 2025 & 2033
- Figure 12: North America Electronically Scanned Array Radar Market Revenue (billion), by Country 2025 & 2033
- Figure 13: North America Electronically Scanned Array Radar Market Revenue Share (%), by Country 2025 & 2033
- Figure 14: South America Electronically Scanned Array Radar Market Revenue (billion), by Production Analysis 2025 & 2033
- Figure 15: South America Electronically Scanned Array Radar Market Revenue Share (%), by Production Analysis 2025 & 2033
- Figure 16: South America Electronically Scanned Array Radar Market Revenue (billion), by Consumption Analysis 2025 & 2033
- Figure 17: South America Electronically Scanned Array Radar Market Revenue Share (%), by Consumption Analysis 2025 & 2033
- Figure 18: South America Electronically Scanned Array Radar Market Revenue (billion), by Import Market Analysis (Value & Volume) 2025 & 2033
- Figure 19: South America Electronically Scanned Array Radar Market Revenue Share (%), by Import Market Analysis (Value & Volume) 2025 & 2033
- Figure 20: South America Electronically Scanned Array Radar Market Revenue (billion), by Export Market Analysis (Value & Volume) 2025 & 2033
- Figure 21: South America Electronically Scanned Array Radar Market Revenue Share (%), by Export Market Analysis (Value & Volume) 2025 & 2033
- Figure 22: South America Electronically Scanned Array Radar Market Revenue (billion), by Price Trend Analysis 2025 & 2033
- Figure 23: South America Electronically Scanned Array Radar Market Revenue Share (%), by Price Trend Analysis 2025 & 2033
- Figure 24: South America Electronically Scanned Array Radar Market Revenue (billion), by Country 2025 & 2033
- Figure 25: South America Electronically Scanned Array Radar Market Revenue Share (%), by Country 2025 & 2033
- Figure 26: Europe Electronically Scanned Array Radar Market Revenue (billion), by Production Analysis 2025 & 2033
- Figure 27: Europe Electronically Scanned Array Radar Market Revenue Share (%), by Production Analysis 2025 & 2033
- Figure 28: Europe Electronically Scanned Array Radar Market Revenue (billion), by Consumption Analysis 2025 & 2033
- Figure 29: Europe Electronically Scanned Array Radar Market Revenue Share (%), by Consumption Analysis 2025 & 2033
- Figure 30: Europe Electronically Scanned Array Radar Market Revenue (billion), by Import Market Analysis (Value & Volume) 2025 & 2033
- Figure 31: Europe Electronically Scanned Array Radar Market Revenue Share (%), by Import Market Analysis (Value & Volume) 2025 & 2033
- Figure 32: Europe Electronically Scanned Array Radar Market Revenue (billion), by Export Market Analysis (Value & Volume) 2025 & 2033
- Figure 33: Europe Electronically Scanned Array Radar Market Revenue Share (%), by Export Market Analysis (Value & Volume) 2025 & 2033
- Figure 34: Europe Electronically Scanned Array Radar Market Revenue (billion), by Price Trend Analysis 2025 & 2033
- Figure 35: Europe Electronically Scanned Array Radar Market Revenue Share (%), by Price Trend Analysis 2025 & 2033
- Figure 36: Europe Electronically Scanned Array Radar Market Revenue (billion), by Country 2025 & 2033
- Figure 37: Europe Electronically Scanned Array Radar Market Revenue Share (%), by Country 2025 & 2033
- Figure 38: Middle East & Africa Electronically Scanned Array Radar Market Revenue (billion), by Production Analysis 2025 & 2033
- Figure 39: Middle East & Africa Electronically Scanned Array Radar Market Revenue Share (%), by Production Analysis 2025 & 2033
- Figure 40: Middle East & Africa Electronically Scanned Array Radar Market Revenue (billion), by Consumption Analysis 2025 & 2033
- Figure 41: Middle East & Africa Electronically Scanned Array Radar Market Revenue Share (%), by Consumption Analysis 2025 & 2033
- Figure 42: Middle East & Africa Electronically Scanned Array Radar Market Revenue (billion), by Import Market Analysis (Value & Volume) 2025 & 2033
- Figure 43: Middle East & Africa Electronically Scanned Array Radar Market Revenue Share (%), by Import Market Analysis (Value & Volume) 2025 & 2033
- Figure 44: Middle East & Africa Electronically Scanned Array Radar Market Revenue (billion), by Export Market Analysis (Value & Volume) 2025 & 2033
- Figure 45: Middle East & Africa Electronically Scanned Array Radar Market Revenue Share (%), by Export Market Analysis (Value & Volume) 2025 & 2033
- Figure 46: Middle East & Africa Electronically Scanned Array Radar Market Revenue (billion), by Price Trend Analysis 2025 & 2033
- Figure 47: Middle East & Africa Electronically Scanned Array Radar Market Revenue Share (%), by Price Trend Analysis 2025 & 2033
- Figure 48: Middle East & Africa Electronically Scanned Array Radar Market Revenue (billion), by Country 2025 & 2033
- Figure 49: Middle East & Africa Electronically Scanned Array Radar Market Revenue Share (%), by Country 2025 & 2033
- Figure 50: Asia Pacific Electronically Scanned Array Radar Market Revenue (billion), by Production Analysis 2025 & 2033
- Figure 51: Asia Pacific Electronically Scanned Array Radar Market Revenue Share (%), by Production Analysis 2025 & 2033
- Figure 52: Asia Pacific Electronically Scanned Array Radar Market Revenue (billion), by Consumption Analysis 2025 & 2033
- Figure 53: Asia Pacific Electronically Scanned Array Radar Market Revenue Share (%), by Consumption Analysis 2025 & 2033
- Figure 54: Asia Pacific Electronically Scanned Array Radar Market Revenue (billion), by Import Market Analysis (Value & Volume) 2025 & 2033
- Figure 55: Asia Pacific Electronically Scanned Array Radar Market Revenue Share (%), by Import Market Analysis (Value & Volume) 2025 & 2033
- Figure 56: Asia Pacific Electronically Scanned Array Radar Market Revenue (billion), by Export Market Analysis (Value & Volume) 2025 & 2033
- Figure 57: Asia Pacific Electronically Scanned Array Radar Market Revenue Share (%), by Export Market Analysis (Value & Volume) 2025 & 2033
- Figure 58: Asia Pacific Electronically Scanned Array Radar Market Revenue (billion), by Price Trend Analysis 2025 & 2033
- Figure 59: Asia Pacific Electronically Scanned Array Radar Market Revenue Share (%), by Price Trend Analysis 2025 & 2033
- Figure 60: Asia Pacific Electronically Scanned Array Radar Market Revenue (billion), by Country 2025 & 2033
- Figure 61: Asia Pacific Electronically Scanned Array Radar Market Revenue Share (%), by Country 2025 & 2033
List of Tables
- Table 1: Global Electronically Scanned Array Radar Market Revenue billion Forecast, by Production Analysis 2020 & 2033
- Table 2: Global Electronically Scanned Array Radar Market Revenue billion Forecast, by Consumption Analysis 2020 & 2033
- Table 3: Global Electronically Scanned Array Radar Market Revenue billion Forecast, by Import Market Analysis (Value & Volume) 2020 & 2033
- Table 4: Global Electronically Scanned Array Radar Market Revenue billion Forecast, by Export Market Analysis (Value & Volume) 2020 & 2033
- Table 5: Global Electronically Scanned Array Radar Market Revenue billion Forecast, by Price Trend Analysis 2020 & 2033
- Table 6: Global Electronically Scanned Array Radar Market Revenue billion Forecast, by Region 2020 & 2033
- Table 7: Global Electronically Scanned Array Radar Market Revenue billion Forecast, by Production Analysis 2020 & 2033
- Table 8: Global Electronically Scanned Array Radar Market Revenue billion Forecast, by Consumption Analysis 2020 & 2033
- Table 9: Global Electronically Scanned Array Radar Market Revenue billion Forecast, by Import Market Analysis (Value & Volume) 2020 & 2033
- Table 10: Global Electronically Scanned Array Radar Market Revenue billion Forecast, by Export Market Analysis (Value & Volume) 2020 & 2033
- Table 11: Global Electronically Scanned Array Radar Market Revenue billion Forecast, by Price Trend Analysis 2020 & 2033
- Table 12: Global Electronically Scanned Array Radar Market Revenue billion Forecast, by Country 2020 & 2033
- Table 13: United States Electronically Scanned Array Radar Market Revenue (billion) Forecast, by Application 2020 & 2033
- Table 14: Canada Electronically Scanned Array Radar Market Revenue (billion) Forecast, by Application 2020 & 2033
- Table 15: Mexico Electronically Scanned Array Radar Market Revenue (billion) Forecast, by Application 2020 & 2033
- Table 16: Global Electronically Scanned Array Radar Market Revenue billion Forecast, by Production Analysis 2020 & 2033
- Table 17: Global Electronically Scanned Array Radar Market Revenue billion Forecast, by Consumption Analysis 2020 & 2033
- Table 18: Global Electronically Scanned Array Radar Market Revenue billion Forecast, by Import Market Analysis (Value & Volume) 2020 & 2033
- Table 19: Global Electronically Scanned Array Radar Market Revenue billion Forecast, by Export Market Analysis (Value & Volume) 2020 & 2033
- Table 20: Global Electronically Scanned Array Radar Market Revenue billion Forecast, by Price Trend Analysis 2020 & 2033
- Table 21: Global Electronically Scanned Array Radar Market Revenue billion Forecast, by Country 2020 & 2033
- Table 22: Brazil Electronically Scanned Array Radar Market Revenue (billion) Forecast, by Application 2020 & 2033
- Table 23: Argentina Electronically Scanned Array Radar Market Revenue (billion) Forecast, by Application 2020 & 2033
- Table 24: Rest of South America Electronically Scanned Array Radar Market Revenue (billion) Forecast, by Application 2020 & 2033
- Table 25: Global Electronically Scanned Array Radar Market Revenue billion Forecast, by Production Analysis 2020 & 2033
- Table 26: Global Electronically Scanned Array Radar Market Revenue billion Forecast, by Consumption Analysis 2020 & 2033
- Table 27: Global Electronically Scanned Array Radar Market Revenue billion Forecast, by Import Market Analysis (Value & Volume) 2020 & 2033
- Table 28: Global Electronically Scanned Array Radar Market Revenue billion Forecast, by Export Market Analysis (Value & Volume) 2020 & 2033
- Table 29: Global Electronically Scanned Array Radar Market Revenue billion Forecast, by Price Trend Analysis 2020 & 2033
- Table 30: Global Electronically Scanned Array Radar Market Revenue billion Forecast, by Country 2020 & 2033
- Table 31: United Kingdom Electronically Scanned Array Radar Market Revenue (billion) Forecast, by Application 2020 & 2033
- Table 32: Germany Electronically Scanned Array Radar Market Revenue (billion) Forecast, by Application 2020 & 2033
- Table 33: France Electronically Scanned Array Radar Market Revenue (billion) Forecast, by Application 2020 & 2033
- Table 34: Italy Electronically Scanned Array Radar Market Revenue (billion) Forecast, by Application 2020 & 2033
- Table 35: Spain Electronically Scanned Array Radar Market Revenue (billion) Forecast, by Application 2020 & 2033
- Table 36: Russia Electronically Scanned Array Radar Market Revenue (billion) Forecast, by Application 2020 & 2033
- Table 37: Benelux Electronically Scanned Array Radar Market Revenue (billion) Forecast, by Application 2020 & 2033
- Table 38: Nordics Electronically Scanned Array Radar Market Revenue (billion) Forecast, by Application 2020 & 2033
- Table 39: Rest of Europe Electronically Scanned Array Radar Market Revenue (billion) Forecast, by Application 2020 & 2033
- Table 40: Global Electronically Scanned Array Radar Market Revenue billion Forecast, by Production Analysis 2020 & 2033
- Table 41: Global Electronically Scanned Array Radar Market Revenue billion Forecast, by Consumption Analysis 2020 & 2033
- Table 42: Global Electronically Scanned Array Radar Market Revenue billion Forecast, by Import Market Analysis (Value & Volume) 2020 & 2033
- Table 43: Global Electronically Scanned Array Radar Market Revenue billion Forecast, by Export Market Analysis (Value & Volume) 2020 & 2033
- Table 44: Global Electronically Scanned Array Radar Market Revenue billion Forecast, by Price Trend Analysis 2020 & 2033
- Table 45: Global Electronically Scanned Array Radar Market Revenue billion Forecast, by Country 2020 & 2033
- Table 46: Turkey Electronically Scanned Array Radar Market Revenue (billion) Forecast, by Application 2020 & 2033
- Table 47: Israel Electronically Scanned Array Radar Market Revenue (billion) Forecast, by Application 2020 & 2033
- Table 48: GCC Electronically Scanned Array Radar Market Revenue (billion) Forecast, by Application 2020 & 2033
- Table 49: North Africa Electronically Scanned Array Radar Market Revenue (billion) Forecast, by Application 2020 & 2033
- Table 50: South Africa Electronically Scanned Array Radar Market Revenue (billion) Forecast, by Application 2020 & 2033
- Table 51: Rest of Middle East & Africa Electronically Scanned Array Radar Market Revenue (billion) Forecast, by Application 2020 & 2033
- Table 52: Global Electronically Scanned Array Radar Market Revenue billion Forecast, by Production Analysis 2020 & 2033
- Table 53: Global Electronically Scanned Array Radar Market Revenue billion Forecast, by Consumption Analysis 2020 & 2033
- Table 54: Global Electronically Scanned Array Radar Market Revenue billion Forecast, by Import Market Analysis (Value & Volume) 2020 & 2033
- Table 55: Global Electronically Scanned Array Radar Market Revenue billion Forecast, by Export Market Analysis (Value & Volume) 2020 & 2033
- Table 56: Global Electronically Scanned Array Radar Market Revenue billion Forecast, by Price Trend Analysis 2020 & 2033
- Table 57: Global Electronically Scanned Array Radar Market Revenue billion Forecast, by Country 2020 & 2033
- Table 58: China Electronically Scanned Array Radar Market Revenue (billion) Forecast, by Application 2020 & 2033
- Table 59: India Electronically Scanned Array Radar Market Revenue (billion) Forecast, by Application 2020 & 2033
- Table 60: Japan Electronically Scanned Array Radar Market Revenue (billion) Forecast, by Application 2020 & 2033
- Table 61: South Korea Electronically Scanned Array Radar Market Revenue (billion) Forecast, by Application 2020 & 2033
- Table 62: ASEAN Electronically Scanned Array Radar Market Revenue (billion) Forecast, by Application 2020 & 2033
- Table 63: Oceania Electronically Scanned Array Radar Market Revenue (billion) Forecast, by Application 2020 & 2033
- Table 64: Rest of Asia Pacific Electronically Scanned Array Radar Market Revenue (billion) Forecast, by Application 2020 & 2033
Frequently Asked Questions
1. What is the projected Compound Annual Growth Rate (CAGR) of the Electronically Scanned Array Radar Market?
The projected CAGR is approximately 9.7%.
2. Which companies are prominent players in the Electronically Scanned Array Radar Market?
Key companies in the market include Raytheon Technologies Corporation, THALES, Leonardo SpA, Lockheed Martin Corporation, Hensoldt AG, RADA Electronic Industries Ltd, Mitsubishi Electric Corporation, Israel Aerospace Industries, ASELSAN A, CEA Technologies, Northrop Grumman Corporation, Saab AB.
3. What are the main segments of the Electronically Scanned Array Radar Market?
The market segments include Production Analysis, Consumption Analysis, Import Market Analysis (Value & Volume), Export Market Analysis (Value & Volume), Price Trend Analysis.
4. Can you provide details about the market size?
The market size is estimated to be USD 12.35 billion as of 2022.
5. What are some drivers contributing to market growth?
; Increasing Number Of Air Passengers; Use Of Portable Electronic Devices.
6. What are the notable trends driving market growth?
Active Electronically Scanned Array Segment to Dominate the Market During the Forecast Period.
7. Are there any restraints impacting market growth?
; High Cost Of Connectivity Equipments.
8. Can you provide examples of recent developments in the market?
In March 2023, The Indian Ministry of Defence (MoD) signed two contracts worth USD448.44m with the government-owned aerospace and defense electronics company Bharat Electronics Limited (BEL) to provide radar and warning receivers for Indian Air Force.
9. What pricing options are available for accessing the report?
Pricing options include single-user, multi-user, and enterprise licenses priced at USD 4750, USD 5250, and USD 8750 respectively.
10. Is the market size provided in terms of value or volume?
The market size is provided in terms of value, measured in billion.
11. Are there any specific market keywords associated with the report?
Yes, the market keyword associated with the report is "Electronically Scanned Array Radar Market," which aids in identifying and referencing the specific market segment covered.
12. How do I determine which pricing option suits my needs best?
The pricing options vary based on user requirements and access needs. Individual users may opt for single-user licenses, while businesses requiring broader access may choose multi-user or enterprise licenses for cost-effective access to the report.
13. Are there any additional resources or data provided in the Electronically Scanned Array Radar Market report?
While the report offers comprehensive insights, it's advisable to review the specific contents or supplementary materials provided to ascertain if additional resources or data are available.
14. How can I stay updated on further developments or reports in the Electronically Scanned Array Radar Market?
To stay informed about further developments, trends, and reports in the Electronically Scanned Array Radar Market, consider subscribing to industry newsletters, following relevant companies and organizations, or regularly checking reputable industry news sources and publications.
Methodology
Step 1 - Identification of Relevant Samples Size from Population Database


Step 2 - Approaches for Defining Global Market Size (Value, Volume* & Price*)

Note*: In applicable scenarios
Step 3 - Data Sources
Primary Research
- Web Analytics
- Survey Reports
- Research Institute
- Latest Research Reports
- Opinion Leaders
Secondary Research
- Annual Reports
- White Paper
- Latest Press Release
- Industry Association
- Paid Database
- Investor Presentations

Step 4 - Data Triangulation
Involves using different sources of information in order to increase the validity of a study
These sources are likely to be stakeholders in a program - participants, other researchers, program staff, other community members, and so on.
Then we put all data in single framework & apply various statistical tools to find out the dynamic on the market.
During the analysis stage, feedback from the stakeholder groups would be compared to determine areas of agreement as well as areas of divergence