

Key Insights
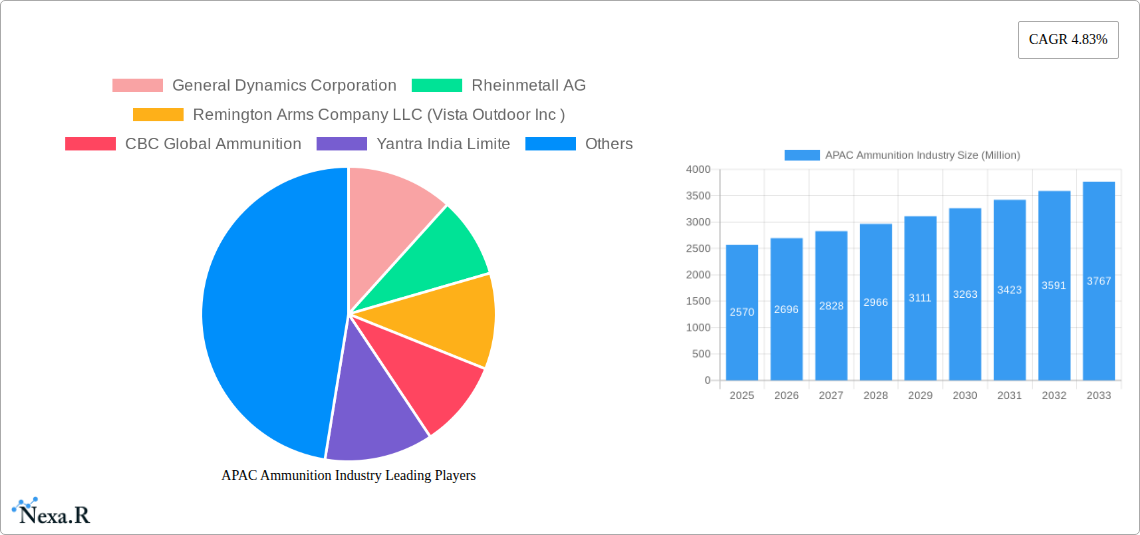
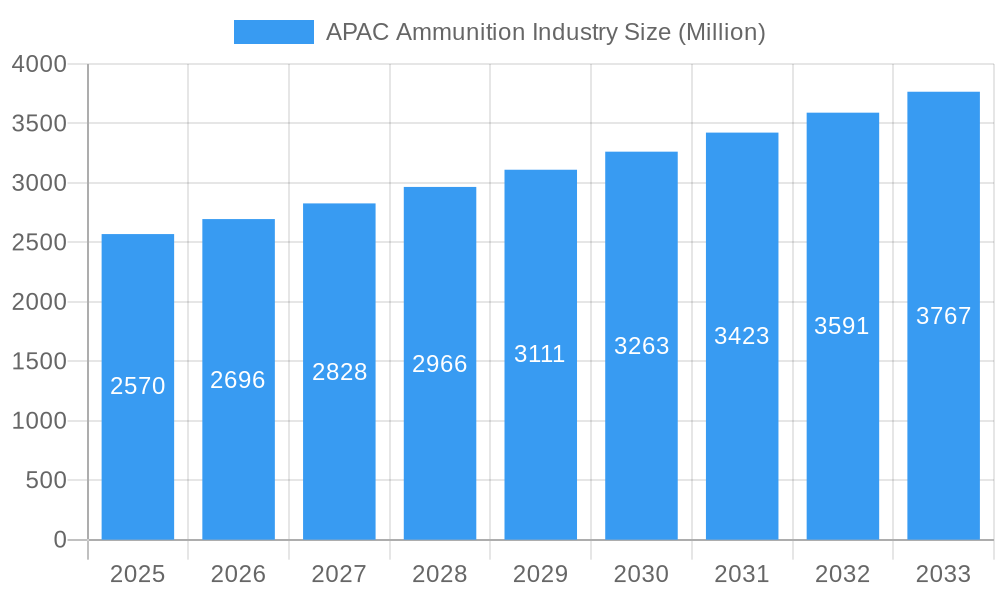
The Asia-Pacific (APAC) ammunition market, valued at $2.57 billion in 2025, is projected to experience robust growth, driven by a compound annual growth rate (CAGR) of 4.83% from 2025 to 2033. This expansion is fueled by several key factors. Increased defense spending across the region, particularly in countries like India and China, is a major contributor. Furthermore, the rising demand for small arms ammunition from civilian markets, coupled with modernization initiatives within law enforcement and military sectors, contributes significantly to market growth. Internal conflicts and border disputes in some APAC nations also create a consistent demand for ammunition. The segment breakdown reveals a significant share held by small-caliber ammunition due to its widespread use in civilian and law enforcement applications. However, the medium and large-caliber segments are expected to witness substantial growth, driven by military modernization and the increasing adoption of advanced weaponry. Competition within the market is intense, with both domestic and international players vying for market share. Established players like General Dynamics, Rheinmetall, and BAE Systems compete with regional manufacturers such as Yantra India and Poongson Corporation.
APAC Ammunition Industry Market Size (In Billion)
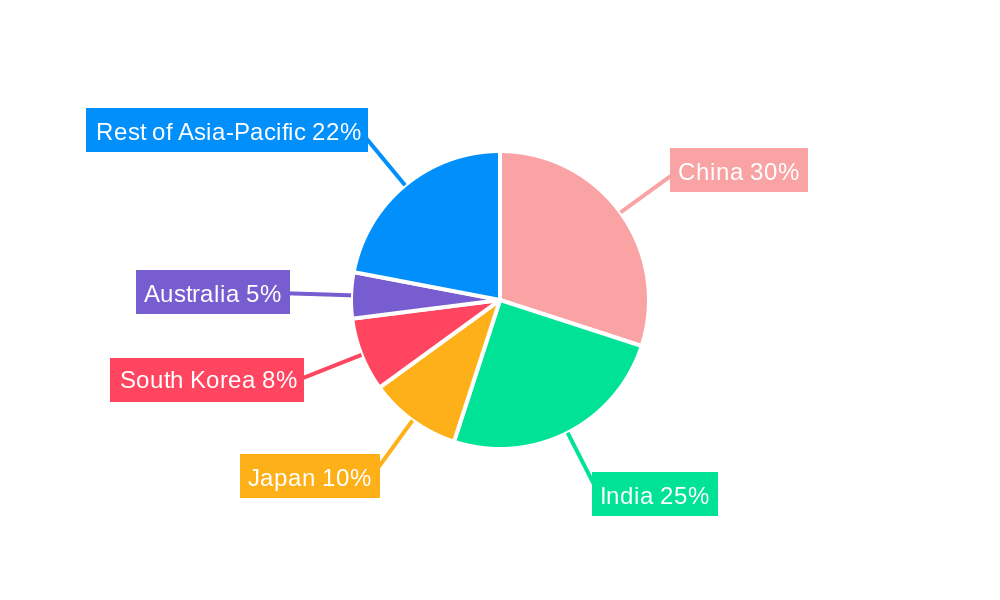
The market's growth trajectory is influenced by various factors. Technological advancements in ammunition manufacturing lead to improved accuracy, range, and lethality, stimulating demand. Stringent government regulations regarding ammunition storage, handling, and disposal could, however, pose a challenge. Furthermore, economic fluctuations within the region, particularly impacting civilian purchasing power, can influence the market's growth rate. China and India are expected to remain dominant market players owing to their substantial defense budgets and large populations. Japan, South Korea, and Australia represent other significant markets with relatively stable demand. The forecast period anticipates continued market expansion, driven by long-term defense strategies and sustained economic growth in several key APAC nations. However, monitoring geopolitical instability and evolving regulatory landscapes remains crucial to accurate market projection.
APAC Ammunition Industry Company Market Share
APAC Ammunition Industry Market Report: 2019-2033
This comprehensive report provides an in-depth analysis of the Asia-Pacific (APAC) ammunition industry, encompassing market dynamics, growth trends, key players, and future outlook. The report covers the period 2019-2033, with a focus on the base year 2025 and forecast period 2025-2033. This essential resource is designed for industry professionals, investors, and strategic decision-makers seeking actionable insights into this dynamic sector. The market is segmented by type (small, medium, and large caliber ammunition), end-user (civilian & law enforcement, military), and country (China, India, Japan, South Korea, Australia, and Rest of Asia-Pacific). The total market size is projected at xx Million units by 2033.
APAC Ammunition Industry Market Dynamics & Structure
The APAC ammunition market is characterized by a complex interplay of factors influencing its growth and structure. Market concentration is relatively high, with a few major players dominating certain segments. Technological innovation, particularly in guided munitions and smart ammunition, is a key driver, while stringent regulatory frameworks and evolving geopolitical landscapes create both opportunities and challenges. The market also faces competition from substitute products, including non-lethal weaponry and advanced defense systems. M&A activity remains significant, with consolidation expected to continue driving market share changes.
- Market Concentration: The top 5 players hold approximately xx% of the market share in 2025.
- Technological Innovation: Focus on precision-guided munitions and smart ammunition is driving growth.
- Regulatory Landscape: Stringent export controls and safety regulations influence market dynamics.
- Competitive Substitutes: Non-lethal weapons and advanced defense technologies are impacting demand.
- M&A Activity: xx major M&A deals were recorded between 2019 and 2024, indicating market consolidation.
- End-User Demographics: Military spending and internal security concerns drive demand across the region.
APAC Ammunition Industry Growth Trends & Insights
The APAC ammunition market exhibits robust growth, driven by increasing defense budgets, modernization of armed forces, and geopolitical instability. The market experienced a CAGR of xx% during the historical period (2019-2024) and is projected to maintain a CAGR of xx% during the forecast period (2025-2033). This growth is propelled by rising adoption rates of advanced ammunition types, technological disruptions leading to improved accuracy and lethality, and shifting consumer behavior towards more sophisticated weaponry. Market penetration in key segments such as guided munitions is increasing rapidly.
Dominant Regions, Countries, or Segments in APAC Ammunition Industry
China and India are the dominant markets in the APAC region, driving significant growth in overall ammunition demand. The military segment accounts for the largest share of the market, with government spending and modernization initiatives as key drivers. Within the product types, the demand for small and medium caliber ammunition remains substantial, although growth in large caliber ammunition is anticipated due to the modernization of defense forces.
- Key Drivers:
- Increased Military Spending: Significant defense budget allocations in China and India.
- Modernization of Armed Forces: Upgrading military equipment and weaponry across the region.
- Geopolitical Instability: Regional conflicts and tensions fuel demand for ammunition.
- Dominant Segments:
- By Country: China and India account for approximately xx% of the total market.
- By End-User: The military segment constitutes approximately xx% of the market share.
- By Type: Small and medium caliber ammunition dominate market volume, although large caliber ammunition shows significant growth potential.
APAC Ammunition Industry Product Landscape
The APAC ammunition market showcases a diverse range of products, from conventional small arms ammunition to advanced guided munitions. Key innovations include improved accuracy, reduced recoil, and enhanced lethality. Manufacturers are focusing on developing smart ammunition with enhanced guidance systems and improved effectiveness. This is coupled with an increasing focus on the development of cost-effective and environmentally friendly ammunition solutions.
Key Drivers, Barriers & Challenges in APAP Ammunition Industry
Key Drivers: Increased defense budgets, modernization of armed forces across the region, and geopolitical instability are the primary drivers. Technological advancements in precision-guided munitions and smart ammunition also contribute significantly.
Key Challenges: Stringent regulatory frameworks, supply chain disruptions, and intense competition from both domestic and international players present significant hurdles. Environmental concerns related to ammunition production and disposal are also emerging as key challenges. The estimated impact of these challenges on market growth is xx%.
Emerging Opportunities in APAC Ammunition Industry
Untapped markets in the Southeast Asian region present significant opportunities. Growth in civilian and law enforcement segments driven by increased internal security needs offer further potential. The development and adoption of smart ammunition and other advanced technologies will continue driving market expansion.
Growth Accelerators in the APAC Ammunition Industry
Technological breakthroughs in ammunition design and manufacturing are key growth catalysts. Strategic partnerships between defense manufacturers and government agencies are also contributing. Market expansion into newer and untapped markets across the APAC region will further fuel growth.
Key Players Shaping the APAC Ammunition Industry Market
- General Dynamics Corporation
- Rheinmetall AG
- Remington Arms Company LLC (Vista Outdoor Inc)
- CBC Global Ammunition
- Yantra India Limited
- BAE Systems PLC
- Winchester Ammunition (Olin Corporation)
- Munitions India Limited
- Singapore Technologies Engineering Ltd
- Poongson Corporation
- Hanwha Corporation
- KNDS NV
Notable Milestones in APAC Ammunition Industry Sector
- February 2024: China showcased its newly developed ASN-301 loitering munition in Saudi Arabia, highlighting advancements in precision-guided munitions.
- February 2023: The Indian MoD selected five domestic ammunition manufacturers to supply 2,000 155mm TGMs, boosting domestic production.
In-Depth APAC Ammunition Industry Market Outlook
The APAC ammunition market is poised for sustained growth, driven by continuous technological advancements, increased military spending, and geopolitical considerations. Strategic partnerships and expansion into new markets will further contribute to market expansion. The potential for significant growth remains high, offering considerable opportunities for both established players and emerging companies.
APAC Ammunition Industry Segmentation
- 1. Production Analysis
- 2. Consumption Analysis
- 3. Import Market Analysis (Value & Volume)
- 4. Export Market Analysis (Value & Volume)
- 5. Price Trend Analysis
APAC Ammunition Industry Segmentation By Geography
-
1. North America
- 1.1. United States
- 1.2. Canada
- 1.3. Mexico
-
2. South America
- 2.1. Brazil
- 2.2. Argentina
- 2.3. Rest of South America
-
3. Europe
- 3.1. United Kingdom
- 3.2. Germany
- 3.3. France
- 3.4. Italy
- 3.5. Spain
- 3.6. Russia
- 3.7. Benelux
- 3.8. Nordics
- 3.9. Rest of Europe
-
4. Middle East & Africa
- 4.1. Turkey
- 4.2. Israel
- 4.3. GCC
- 4.4. North Africa
- 4.5. South Africa
- 4.6. Rest of Middle East & Africa
-
5. Asia Pacific
- 5.1. China
- 5.2. India
- 5.3. Japan
- 5.4. South Korea
- 5.5. ASEAN
- 5.6. Oceania
- 5.7. Rest of Asia Pacific
APAC Ammunition Industry Regional Market Share
Geographic Coverage of APAC Ammunition Industry
APAC Ammunition Industry REPORT HIGHLIGHTS
| Aspects | Details |
|---|---|
| Study Period | 2020-2034 |
| Base Year | 2025 |
| Estimated Year | 2026 |
| Forecast Period | 2026-2034 |
| Historical Period | 2020-2025 |
| Growth Rate | CAGR of 4.83% from 2020-2034 |
| Segmentation |
|
Table of Contents
- 1. Introduction
- 1.1. Research Scope
- 1.2. Market Segmentation
- 1.3. Research Objective
- 1.4. Definitions and Assumptions
- 2. Executive Summary
- 2.1. Market Snapshot
- 3. Market Dynamics
- 3.1. Market Drivers
- 3.2. Market Restrains
- 3.3. Market Trends
- 3.4. Market Opportunities
- 4. Market Factor Analysis
- 4.1. Porters Five Forces
- 4.1.1. Bargaining Power of Suppliers
- 4.1.2. Bargaining Power of Buyers
- 4.1.3. Threat of New Entrants
- 4.1.4. Threat of Substitutes
- 4.1.5. Competitive Rivalry
- 4.2. PESTEL analysis
- 4.3. BCG Analysis
- 4.3.1. Stars (High Growth, High Market Share)
- 4.3.2. Cash Cows (Low Growth, High Market Share)
- 4.3.3. Question Mark (High Growth, Low Market Share)
- 4.3.4. Dogs (Low Growth, Low Market Share)
- 4.4. Ansoff Matrix Analysis
- 4.5. Supply Chain Analysis
- 4.6. Regulatory Landscape
- 4.7. Current Market Potential and Opportunity Assessment (TAM–SAM–SOM Framework)
- 4.8. NRP Analyst Note
- 4.1. Porters Five Forces
- 5. Market Analysis, Insights and Forecast 2021-2033
- 5.1. Market Analysis, Insights and Forecast - by Production Analysis
- 5.2. Market Analysis, Insights and Forecast - by Consumption Analysis
- 5.3. Market Analysis, Insights and Forecast - by Import Market Analysis (Value & Volume)
- 5.4. Market Analysis, Insights and Forecast - by Export Market Analysis (Value & Volume)
- 5.5. Market Analysis, Insights and Forecast - by Price Trend Analysis
- 5.6. Market Analysis, Insights and Forecast - by Region
- 5.6.1. North America
- 5.6.2. South America
- 5.6.3. Europe
- 5.6.4. Middle East & Africa
- 5.6.5. Asia Pacific
- 6. Global APAC Ammunition Industry Analysis, Insights and Forecast, 2021-2033
- 6.1. Market Analysis, Insights and Forecast - by Production Analysis
- 6.2. Market Analysis, Insights and Forecast - by Consumption Analysis
- 6.3. Market Analysis, Insights and Forecast - by Import Market Analysis (Value & Volume)
- 6.4. Market Analysis, Insights and Forecast - by Export Market Analysis (Value & Volume)
- 6.5. Market Analysis, Insights and Forecast - by Price Trend Analysis
- 7. North America APAC Ammunition Industry Analysis, Insights and Forecast, 2020-2032
- 7.1. Market Analysis, Insights and Forecast - by Production Analysis
- 7.2. Market Analysis, Insights and Forecast - by Consumption Analysis
- 7.3. Market Analysis, Insights and Forecast - by Import Market Analysis (Value & Volume)
- 7.4. Market Analysis, Insights and Forecast - by Export Market Analysis (Value & Volume)
- 7.5. Market Analysis, Insights and Forecast - by Price Trend Analysis
- 8. South America APAC Ammunition Industry Analysis, Insights and Forecast, 2020-2032
- 8.1. Market Analysis, Insights and Forecast - by Production Analysis
- 8.2. Market Analysis, Insights and Forecast - by Consumption Analysis
- 8.3. Market Analysis, Insights and Forecast - by Import Market Analysis (Value & Volume)
- 8.4. Market Analysis, Insights and Forecast - by Export Market Analysis (Value & Volume)
- 8.5. Market Analysis, Insights and Forecast - by Price Trend Analysis
- 9. Europe APAC Ammunition Industry Analysis, Insights and Forecast, 2020-2032
- 9.1. Market Analysis, Insights and Forecast - by Production Analysis
- 9.2. Market Analysis, Insights and Forecast - by Consumption Analysis
- 9.3. Market Analysis, Insights and Forecast - by Import Market Analysis (Value & Volume)
- 9.4. Market Analysis, Insights and Forecast - by Export Market Analysis (Value & Volume)
- 9.5. Market Analysis, Insights and Forecast - by Price Trend Analysis
- 10. Middle East & Africa APAC Ammunition Industry Analysis, Insights and Forecast, 2020-2032
- 10.1. Market Analysis, Insights and Forecast - by Production Analysis
- 10.2. Market Analysis, Insights and Forecast - by Consumption Analysis
- 10.3. Market Analysis, Insights and Forecast - by Import Market Analysis (Value & Volume)
- 10.4. Market Analysis, Insights and Forecast - by Export Market Analysis (Value & Volume)
- 10.5. Market Analysis, Insights and Forecast - by Price Trend Analysis
- 11. Asia Pacific APAC Ammunition Industry Analysis, Insights and Forecast, 2020-2032
- 11.1. Market Analysis, Insights and Forecast - by Production Analysis
- 11.2. Market Analysis, Insights and Forecast - by Consumption Analysis
- 11.3. Market Analysis, Insights and Forecast - by Import Market Analysis (Value & Volume)
- 11.4. Market Analysis, Insights and Forecast - by Export Market Analysis (Value & Volume)
- 11.5. Market Analysis, Insights and Forecast - by Price Trend Analysis
- 12. Competitive Analysis
- 12.1. Company Profiles
- 12.1.1 General Dynamics Corporation
- 12.1.1.1. Company Overview
- 12.1.1.2. Products
- 12.1.1.3. Company Financials
- 12.1.1.4. SWOT Analysis
- 12.1.2 Rheinmetall AG
- 12.1.2.1. Company Overview
- 12.1.2.2. Products
- 12.1.2.3. Company Financials
- 12.1.2.4. SWOT Analysis
- 12.1.3 Remington Arms Company LLC (Vista Outdoor Inc )
- 12.1.3.1. Company Overview
- 12.1.3.2. Products
- 12.1.3.3. Company Financials
- 12.1.3.4. SWOT Analysis
- 12.1.4 CBC Global Ammunition
- 12.1.4.1. Company Overview
- 12.1.4.2. Products
- 12.1.4.3. Company Financials
- 12.1.4.4. SWOT Analysis
- 12.1.5 Yantra India Limite
- 12.1.5.1. Company Overview
- 12.1.5.2. Products
- 12.1.5.3. Company Financials
- 12.1.5.4. SWOT Analysis
- 12.1.6 BAE Systems PLC
- 12.1.6.1. Company Overview
- 12.1.6.2. Products
- 12.1.6.3. Company Financials
- 12.1.6.4. SWOT Analysis
- 12.1.7 Winchester Ammunition (Olin Corporation)
- 12.1.7.1. Company Overview
- 12.1.7.2. Products
- 12.1.7.3. Company Financials
- 12.1.7.4. SWOT Analysis
- 12.1.8 Munitions India Limited
- 12.1.8.1. Company Overview
- 12.1.8.2. Products
- 12.1.8.3. Company Financials
- 12.1.8.4. SWOT Analysis
- 12.1.9 Singapore Technologies Engineering Ltd
- 12.1.9.1. Company Overview
- 12.1.9.2. Products
- 12.1.9.3. Company Financials
- 12.1.9.4. SWOT Analysis
- 12.1.10 Poongson Corporation
- 12.1.10.1. Company Overview
- 12.1.10.2. Products
- 12.1.10.3. Company Financials
- 12.1.10.4. SWOT Analysis
- 12.1.11 Hanwha Corporation
- 12.1.11.1. Company Overview
- 12.1.11.2. Products
- 12.1.11.3. Company Financials
- 12.1.11.4. SWOT Analysis
- 12.1.12 KNDS NV
- 12.1.12.1. Company Overview
- 12.1.12.2. Products
- 12.1.12.3. Company Financials
- 12.1.12.4. SWOT Analysis
- 12.1.1 General Dynamics Corporation
- 12.2. Market Entropy
- 12.2.1 Company's Key Areas Served
- 12.2.2 Recent Developments
- 12.3. Company Market Share Analysis 2025
- 12.3.1 Top 5 Companies Market Share Analysis
- 12.3.2 Top 3 Companies Market Share Analysis
- 12.4. List of Potential Customers
- 13. Research Methodology
List of Figures
- Figure 1: Global APAC Ammunition Industry Revenue Breakdown (Million, %) by Region 2025 & 2033
- Figure 2: North America APAC Ammunition Industry Revenue (Million), by Production Analysis 2025 & 2033
- Figure 3: North America APAC Ammunition Industry Revenue Share (%), by Production Analysis 2025 & 2033
- Figure 4: North America APAC Ammunition Industry Revenue (Million), by Consumption Analysis 2025 & 2033
- Figure 5: North America APAC Ammunition Industry Revenue Share (%), by Consumption Analysis 2025 & 2033
- Figure 6: North America APAC Ammunition Industry Revenue (Million), by Import Market Analysis (Value & Volume) 2025 & 2033
- Figure 7: North America APAC Ammunition Industry Revenue Share (%), by Import Market Analysis (Value & Volume) 2025 & 2033
- Figure 8: North America APAC Ammunition Industry Revenue (Million), by Export Market Analysis (Value & Volume) 2025 & 2033
- Figure 9: North America APAC Ammunition Industry Revenue Share (%), by Export Market Analysis (Value & Volume) 2025 & 2033
- Figure 10: North America APAC Ammunition Industry Revenue (Million), by Price Trend Analysis 2025 & 2033
- Figure 11: North America APAC Ammunition Industry Revenue Share (%), by Price Trend Analysis 2025 & 2033
- Figure 12: North America APAC Ammunition Industry Revenue (Million), by Country 2025 & 2033
- Figure 13: North America APAC Ammunition Industry Revenue Share (%), by Country 2025 & 2033
- Figure 14: South America APAC Ammunition Industry Revenue (Million), by Production Analysis 2025 & 2033
- Figure 15: South America APAC Ammunition Industry Revenue Share (%), by Production Analysis 2025 & 2033
- Figure 16: South America APAC Ammunition Industry Revenue (Million), by Consumption Analysis 2025 & 2033
- Figure 17: South America APAC Ammunition Industry Revenue Share (%), by Consumption Analysis 2025 & 2033
- Figure 18: South America APAC Ammunition Industry Revenue (Million), by Import Market Analysis (Value & Volume) 2025 & 2033
- Figure 19: South America APAC Ammunition Industry Revenue Share (%), by Import Market Analysis (Value & Volume) 2025 & 2033
- Figure 20: South America APAC Ammunition Industry Revenue (Million), by Export Market Analysis (Value & Volume) 2025 & 2033
- Figure 21: South America APAC Ammunition Industry Revenue Share (%), by Export Market Analysis (Value & Volume) 2025 & 2033
- Figure 22: South America APAC Ammunition Industry Revenue (Million), by Price Trend Analysis 2025 & 2033
- Figure 23: South America APAC Ammunition Industry Revenue Share (%), by Price Trend Analysis 2025 & 2033
- Figure 24: South America APAC Ammunition Industry Revenue (Million), by Country 2025 & 2033
- Figure 25: South America APAC Ammunition Industry Revenue Share (%), by Country 2025 & 2033
- Figure 26: Europe APAC Ammunition Industry Revenue (Million), by Production Analysis 2025 & 2033
- Figure 27: Europe APAC Ammunition Industry Revenue Share (%), by Production Analysis 2025 & 2033
- Figure 28: Europe APAC Ammunition Industry Revenue (Million), by Consumption Analysis 2025 & 2033
- Figure 29: Europe APAC Ammunition Industry Revenue Share (%), by Consumption Analysis 2025 & 2033
- Figure 30: Europe APAC Ammunition Industry Revenue (Million), by Import Market Analysis (Value & Volume) 2025 & 2033
- Figure 31: Europe APAC Ammunition Industry Revenue Share (%), by Import Market Analysis (Value & Volume) 2025 & 2033
- Figure 32: Europe APAC Ammunition Industry Revenue (Million), by Export Market Analysis (Value & Volume) 2025 & 2033
- Figure 33: Europe APAC Ammunition Industry Revenue Share (%), by Export Market Analysis (Value & Volume) 2025 & 2033
- Figure 34: Europe APAC Ammunition Industry Revenue (Million), by Price Trend Analysis 2025 & 2033
- Figure 35: Europe APAC Ammunition Industry Revenue Share (%), by Price Trend Analysis 2025 & 2033
- Figure 36: Europe APAC Ammunition Industry Revenue (Million), by Country 2025 & 2033
- Figure 37: Europe APAC Ammunition Industry Revenue Share (%), by Country 2025 & 2033
- Figure 38: Middle East & Africa APAC Ammunition Industry Revenue (Million), by Production Analysis 2025 & 2033
- Figure 39: Middle East & Africa APAC Ammunition Industry Revenue Share (%), by Production Analysis 2025 & 2033
- Figure 40: Middle East & Africa APAC Ammunition Industry Revenue (Million), by Consumption Analysis 2025 & 2033
- Figure 41: Middle East & Africa APAC Ammunition Industry Revenue Share (%), by Consumption Analysis 2025 & 2033
- Figure 42: Middle East & Africa APAC Ammunition Industry Revenue (Million), by Import Market Analysis (Value & Volume) 2025 & 2033
- Figure 43: Middle East & Africa APAC Ammunition Industry Revenue Share (%), by Import Market Analysis (Value & Volume) 2025 & 2033
- Figure 44: Middle East & Africa APAC Ammunition Industry Revenue (Million), by Export Market Analysis (Value & Volume) 2025 & 2033
- Figure 45: Middle East & Africa APAC Ammunition Industry Revenue Share (%), by Export Market Analysis (Value & Volume) 2025 & 2033
- Figure 46: Middle East & Africa APAC Ammunition Industry Revenue (Million), by Price Trend Analysis 2025 & 2033
- Figure 47: Middle East & Africa APAC Ammunition Industry Revenue Share (%), by Price Trend Analysis 2025 & 2033
- Figure 48: Middle East & Africa APAC Ammunition Industry Revenue (Million), by Country 2025 & 2033
- Figure 49: Middle East & Africa APAC Ammunition Industry Revenue Share (%), by Country 2025 & 2033
- Figure 50: Asia Pacific APAC Ammunition Industry Revenue (Million), by Production Analysis 2025 & 2033
- Figure 51: Asia Pacific APAC Ammunition Industry Revenue Share (%), by Production Analysis 2025 & 2033
- Figure 52: Asia Pacific APAC Ammunition Industry Revenue (Million), by Consumption Analysis 2025 & 2033
- Figure 53: Asia Pacific APAC Ammunition Industry Revenue Share (%), by Consumption Analysis 2025 & 2033
- Figure 54: Asia Pacific APAC Ammunition Industry Revenue (Million), by Import Market Analysis (Value & Volume) 2025 & 2033
- Figure 55: Asia Pacific APAC Ammunition Industry Revenue Share (%), by Import Market Analysis (Value & Volume) 2025 & 2033
- Figure 56: Asia Pacific APAC Ammunition Industry Revenue (Million), by Export Market Analysis (Value & Volume) 2025 & 2033
- Figure 57: Asia Pacific APAC Ammunition Industry Revenue Share (%), by Export Market Analysis (Value & Volume) 2025 & 2033
- Figure 58: Asia Pacific APAC Ammunition Industry Revenue (Million), by Price Trend Analysis 2025 & 2033
- Figure 59: Asia Pacific APAC Ammunition Industry Revenue Share (%), by Price Trend Analysis 2025 & 2033
- Figure 60: Asia Pacific APAC Ammunition Industry Revenue (Million), by Country 2025 & 2033
- Figure 61: Asia Pacific APAC Ammunition Industry Revenue Share (%), by Country 2025 & 2033
List of Tables
- Table 1: Global APAC Ammunition Industry Revenue Million Forecast, by Production Analysis 2020 & 2033
- Table 2: Global APAC Ammunition Industry Revenue Million Forecast, by Consumption Analysis 2020 & 2033
- Table 3: Global APAC Ammunition Industry Revenue Million Forecast, by Import Market Analysis (Value & Volume) 2020 & 2033
- Table 4: Global APAC Ammunition Industry Revenue Million Forecast, by Export Market Analysis (Value & Volume) 2020 & 2033
- Table 5: Global APAC Ammunition Industry Revenue Million Forecast, by Price Trend Analysis 2020 & 2033
- Table 6: Global APAC Ammunition Industry Revenue Million Forecast, by Region 2020 & 2033
- Table 7: Global APAC Ammunition Industry Revenue Million Forecast, by Production Analysis 2020 & 2033
- Table 8: Global APAC Ammunition Industry Revenue Million Forecast, by Consumption Analysis 2020 & 2033
- Table 9: Global APAC Ammunition Industry Revenue Million Forecast, by Import Market Analysis (Value & Volume) 2020 & 2033
- Table 10: Global APAC Ammunition Industry Revenue Million Forecast, by Export Market Analysis (Value & Volume) 2020 & 2033
- Table 11: Global APAC Ammunition Industry Revenue Million Forecast, by Price Trend Analysis 2020 & 2033
- Table 12: Global APAC Ammunition Industry Revenue Million Forecast, by Country 2020 & 2033
- Table 13: United States APAC Ammunition Industry Revenue (Million) Forecast, by Application 2020 & 2033
- Table 14: Canada APAC Ammunition Industry Revenue (Million) Forecast, by Application 2020 & 2033
- Table 15: Mexico APAC Ammunition Industry Revenue (Million) Forecast, by Application 2020 & 2033
- Table 16: Global APAC Ammunition Industry Revenue Million Forecast, by Production Analysis 2020 & 2033
- Table 17: Global APAC Ammunition Industry Revenue Million Forecast, by Consumption Analysis 2020 & 2033
- Table 18: Global APAC Ammunition Industry Revenue Million Forecast, by Import Market Analysis (Value & Volume) 2020 & 2033
- Table 19: Global APAC Ammunition Industry Revenue Million Forecast, by Export Market Analysis (Value & Volume) 2020 & 2033
- Table 20: Global APAC Ammunition Industry Revenue Million Forecast, by Price Trend Analysis 2020 & 2033
- Table 21: Global APAC Ammunition Industry Revenue Million Forecast, by Country 2020 & 2033
- Table 22: Brazil APAC Ammunition Industry Revenue (Million) Forecast, by Application 2020 & 2033
- Table 23: Argentina APAC Ammunition Industry Revenue (Million) Forecast, by Application 2020 & 2033
- Table 24: Rest of South America APAC Ammunition Industry Revenue (Million) Forecast, by Application 2020 & 2033
- Table 25: Global APAC Ammunition Industry Revenue Million Forecast, by Production Analysis 2020 & 2033
- Table 26: Global APAC Ammunition Industry Revenue Million Forecast, by Consumption Analysis 2020 & 2033
- Table 27: Global APAC Ammunition Industry Revenue Million Forecast, by Import Market Analysis (Value & Volume) 2020 & 2033
- Table 28: Global APAC Ammunition Industry Revenue Million Forecast, by Export Market Analysis (Value & Volume) 2020 & 2033
- Table 29: Global APAC Ammunition Industry Revenue Million Forecast, by Price Trend Analysis 2020 & 2033
- Table 30: Global APAC Ammunition Industry Revenue Million Forecast, by Country 2020 & 2033
- Table 31: United Kingdom APAC Ammunition Industry Revenue (Million) Forecast, by Application 2020 & 2033
- Table 32: Germany APAC Ammunition Industry Revenue (Million) Forecast, by Application 2020 & 2033
- Table 33: France APAC Ammunition Industry Revenue (Million) Forecast, by Application 2020 & 2033
- Table 34: Italy APAC Ammunition Industry Revenue (Million) Forecast, by Application 2020 & 2033
- Table 35: Spain APAC Ammunition Industry Revenue (Million) Forecast, by Application 2020 & 2033
- Table 36: Russia APAC Ammunition Industry Revenue (Million) Forecast, by Application 2020 & 2033
- Table 37: Benelux APAC Ammunition Industry Revenue (Million) Forecast, by Application 2020 & 2033
- Table 38: Nordics APAC Ammunition Industry Revenue (Million) Forecast, by Application 2020 & 2033
- Table 39: Rest of Europe APAC Ammunition Industry Revenue (Million) Forecast, by Application 2020 & 2033
- Table 40: Global APAC Ammunition Industry Revenue Million Forecast, by Production Analysis 2020 & 2033
- Table 41: Global APAC Ammunition Industry Revenue Million Forecast, by Consumption Analysis 2020 & 2033
- Table 42: Global APAC Ammunition Industry Revenue Million Forecast, by Import Market Analysis (Value & Volume) 2020 & 2033
- Table 43: Global APAC Ammunition Industry Revenue Million Forecast, by Export Market Analysis (Value & Volume) 2020 & 2033
- Table 44: Global APAC Ammunition Industry Revenue Million Forecast, by Price Trend Analysis 2020 & 2033
- Table 45: Global APAC Ammunition Industry Revenue Million Forecast, by Country 2020 & 2033
- Table 46: Turkey APAC Ammunition Industry Revenue (Million) Forecast, by Application 2020 & 2033
- Table 47: Israel APAC Ammunition Industry Revenue (Million) Forecast, by Application 2020 & 2033
- Table 48: GCC APAC Ammunition Industry Revenue (Million) Forecast, by Application 2020 & 2033
- Table 49: North Africa APAC Ammunition Industry Revenue (Million) Forecast, by Application 2020 & 2033
- Table 50: South Africa APAC Ammunition Industry Revenue (Million) Forecast, by Application 2020 & 2033
- Table 51: Rest of Middle East & Africa APAC Ammunition Industry Revenue (Million) Forecast, by Application 2020 & 2033
- Table 52: Global APAC Ammunition Industry Revenue Million Forecast, by Production Analysis 2020 & 2033
- Table 53: Global APAC Ammunition Industry Revenue Million Forecast, by Consumption Analysis 2020 & 2033
- Table 54: Global APAC Ammunition Industry Revenue Million Forecast, by Import Market Analysis (Value & Volume) 2020 & 2033
- Table 55: Global APAC Ammunition Industry Revenue Million Forecast, by Export Market Analysis (Value & Volume) 2020 & 2033
- Table 56: Global APAC Ammunition Industry Revenue Million Forecast, by Price Trend Analysis 2020 & 2033
- Table 57: Global APAC Ammunition Industry Revenue Million Forecast, by Country 2020 & 2033
- Table 58: China APAC Ammunition Industry Revenue (Million) Forecast, by Application 2020 & 2033
- Table 59: India APAC Ammunition Industry Revenue (Million) Forecast, by Application 2020 & 2033
- Table 60: Japan APAC Ammunition Industry Revenue (Million) Forecast, by Application 2020 & 2033
- Table 61: South Korea APAC Ammunition Industry Revenue (Million) Forecast, by Application 2020 & 2033
- Table 62: ASEAN APAC Ammunition Industry Revenue (Million) Forecast, by Application 2020 & 2033
- Table 63: Oceania APAC Ammunition Industry Revenue (Million) Forecast, by Application 2020 & 2033
- Table 64: Rest of Asia Pacific APAC Ammunition Industry Revenue (Million) Forecast, by Application 2020 & 2033
Frequently Asked Questions
1. What is the projected Compound Annual Growth Rate (CAGR) of the APAC Ammunition Industry?
The projected CAGR is approximately 4.83%.
2. Which companies are prominent players in the APAC Ammunition Industry?
Key companies in the market include General Dynamics Corporation, Rheinmetall AG, Remington Arms Company LLC (Vista Outdoor Inc ), CBC Global Ammunition, Yantra India Limite, BAE Systems PLC, Winchester Ammunition (Olin Corporation), Munitions India Limited, Singapore Technologies Engineering Ltd, Poongson Corporation, Hanwha Corporation, KNDS NV.
3. What are the main segments of the APAC Ammunition Industry?
The market segments include Production Analysis, Consumption Analysis, Import Market Analysis (Value & Volume), Export Market Analysis (Value & Volume), Price Trend Analysis.
4. Can you provide details about the market size?
The market size is estimated to be USD 2.57 Million as of 2022.
5. What are some drivers contributing to market growth?
; Increasing Number Of Air Passengers; Use Of Portable Electronic Devices.
6. What are the notable trends driving market growth?
Military Segment is Expected to Dominate the Market During the Forecast Period.
7. Are there any restraints impacting market growth?
; High Cost Of Connectivity Equipments.
8. Can you provide examples of recent developments in the market?
February 2024: China showcased its newly developed ASN-301 loitering munition in Saudi Arabia. Designed to infiltrate adversary airspace, the ASN-301's main function is to loiter until it picks up a radar signal. Upon detection, the ASN-301 targets the signal and precisely strikes. Equipped with a warhead containing 7,000 fragments, the munition is activated by a proximity laser fuse, ensuring a lethal radius of 20 meters.
9. What pricing options are available for accessing the report?
Pricing options include single-user, multi-user, and enterprise licenses priced at USD 4750, USD 4950, and USD 6800 respectively.
10. Is the market size provided in terms of value or volume?
The market size is provided in terms of value, measured in Million.
11. Are there any specific market keywords associated with the report?
Yes, the market keyword associated with the report is "APAC Ammunition Industry," which aids in identifying and referencing the specific market segment covered.
12. How do I determine which pricing option suits my needs best?
The pricing options vary based on user requirements and access needs. Individual users may opt for single-user licenses, while businesses requiring broader access may choose multi-user or enterprise licenses for cost-effective access to the report.
13. Are there any additional resources or data provided in the APAC Ammunition Industry report?
While the report offers comprehensive insights, it's advisable to review the specific contents or supplementary materials provided to ascertain if additional resources or data are available.
14. How can I stay updated on further developments or reports in the APAC Ammunition Industry?
To stay informed about further developments, trends, and reports in the APAC Ammunition Industry, consider subscribing to industry newsletters, following relevant companies and organizations, or regularly checking reputable industry news sources and publications.
Methodology
Step 1 - Identification of Relevant Samples Size from Population Database


Step 2 - Approaches for Defining Global Market Size (Value, Volume* & Price*)

Note*: In applicable scenarios
Step 3 - Data Sources
Primary Research
- Web Analytics
- Survey Reports
- Research Institute
- Latest Research Reports
- Opinion Leaders
Secondary Research
- Annual Reports
- White Paper
- Latest Press Release
- Industry Association
- Paid Database
- Investor Presentations

Step 4 - Data Triangulation
Involves using different sources of information in order to increase the validity of a study
These sources are likely to be stakeholders in a program - participants, other researchers, program staff, other community members, and so on.
Then we put all data in single framework & apply various statistical tools to find out the dynamic on the market.
During the analysis stage, feedback from the stakeholder groups would be compared to determine areas of agreement as well as areas of divergence