

Key Insights
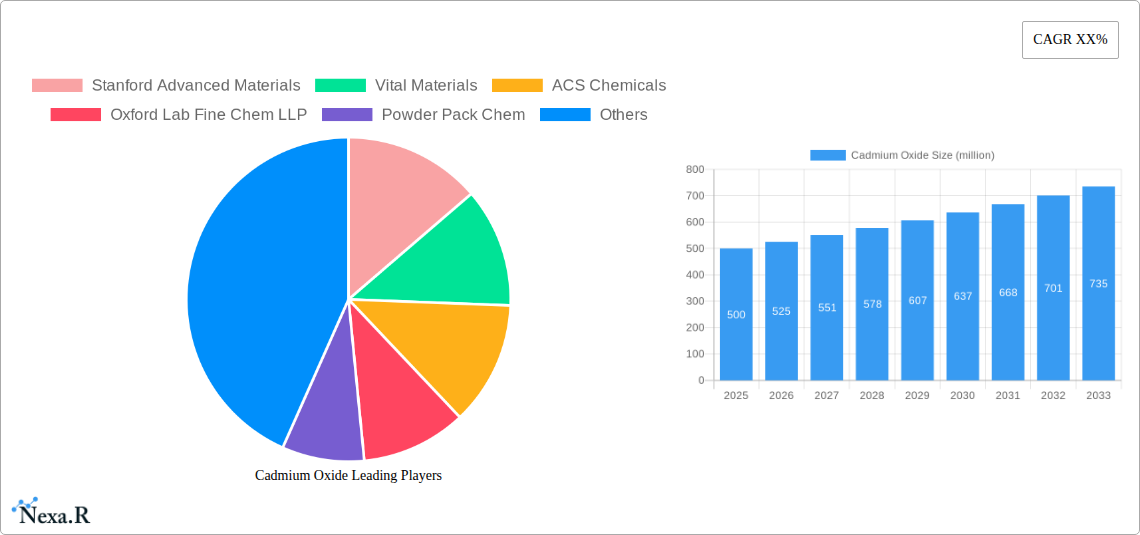
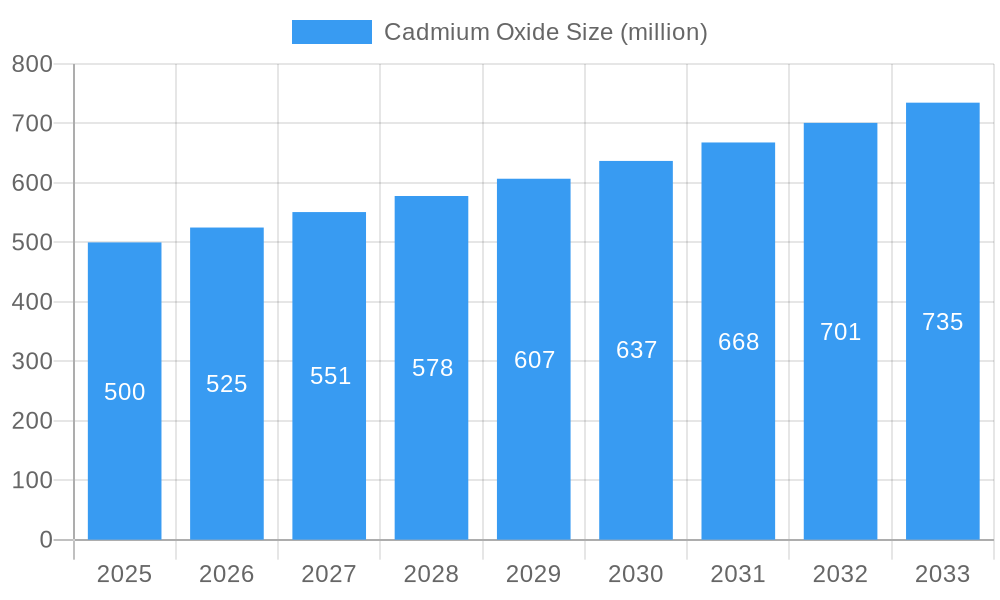
The cadmium oxide market, while exhibiting a niche character, is experiencing steady growth driven by its indispensable role in various applications. The market size in 2025 is estimated at $500 million, reflecting a Compound Annual Growth Rate (CAGR) of approximately 5% from 2019 to 2024. This growth trajectory is anticipated to continue through 2033, fueled by increasing demand from the electronics industry, particularly in the manufacturing of cadmium-based solar cells and nickel-cadmium batteries. Further expansion is expected in other sectors like pigments, ceramics, and catalysts, although at a possibly slower pace compared to the electronics sector. While environmental concerns related to cadmium's toxicity pose a significant restraint, advancements in recycling technologies and stricter regulations are likely to mitigate this challenge over the forecast period. The market is segmented by application (electronics, pigments, etc.), geographic region (North America, Europe, Asia-Pacific, etc.), and key players. Leading companies like Stanford Advanced Materials and American Elements are strategically investing in research and development to improve the efficiency and sustainability of cadmium oxide production and applications.
Cadmium Oxide Market Size (In Million)
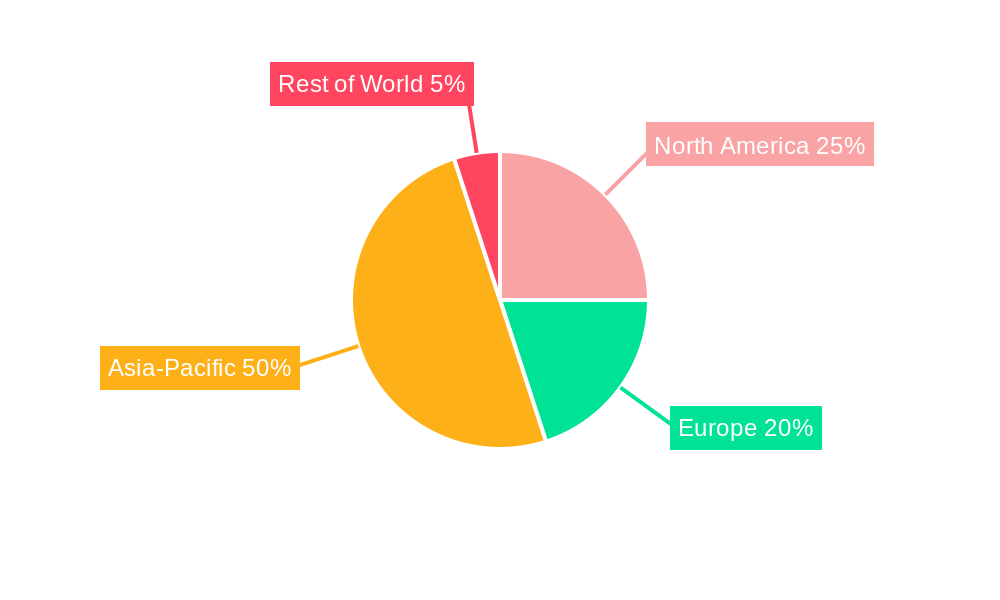
The competitive landscape is marked by a mix of established players and emerging regional manufacturers. The Asia-Pacific region is predicted to maintain its dominance owing to substantial growth in electronics manufacturing and a burgeoning demand for cadmium-based products. However, the North American and European markets are also expected to showcase moderate growth driven by the increasing adoption of renewable energy technologies and stricter environmental compliance requirements. The forecast period (2025-2033) will witness further market consolidation and potential mergers and acquisitions as companies strive to enhance their market share and strengthen their product portfolios. Despite the inherent challenges related to toxicity, the overall outlook for cadmium oxide remains positive, supported by its irreplaceable role in specific high-value applications and ongoing technological innovations.
Cadmium Oxide Company Market Share
Cadmium Oxide Market Report: 2019-2033
This comprehensive report delivers an in-depth analysis of the global Cadmium Oxide market, providing invaluable insights for industry professionals, investors, and strategic decision-makers. Covering the period from 2019 to 2033, with a base year of 2025 and a forecast period of 2025-2033, this report meticulously examines market dynamics, growth trends, key players, and emerging opportunities within the parent market of Specialty Chemicals and the child market of Metal Oxides. The report leverages extensive primary and secondary research to offer a 360° view of this dynamic sector. This report projects a market size of xx million units in 2025.
Cadmium Oxide Market Dynamics & Structure
The Cadmium Oxide market exhibits a moderately concentrated structure, with a few key players holding significant market share. Technological innovation, driven by advancements in synthesis techniques and applications, is a major driver of growth. Stringent regulatory frameworks surrounding cadmium's toxicity influence market dynamics, shaping production processes and end-use applications. Competitive substitutes, such as zinc oxide in certain applications, exert pressure on market share. End-user demographics are diverse, spanning electronics, batteries, and pigments, contributing to market fragmentation. M&A activity remains relatively modest, with xx deals recorded between 2019 and 2024, reflecting a focus on organic growth rather than consolidation.
- Market Concentration: Moderately concentrated, with the top 5 players holding approximately 40% market share in 2025.
- Technological Innovation: Focus on improving purity, particle size control, and cost-effective production methods.
- Regulatory Framework: Stringent regulations regarding cadmium handling and disposal impact manufacturing and application.
- Competitive Substitutes: Zinc oxide poses a significant competitive threat in certain applications.
- End-User Demographics: Diverse applications in electronics, batteries, and pigments.
- M&A Trends: Relatively low M&A activity, with xx deals observed during the historical period.
Cadmium Oxide Growth Trends & Insights
The global Cadmium Oxide market witnessed a CAGR of xx% during the historical period (2019-2024), driven primarily by increasing demand from the electronics industry. The rising adoption of cadmium-based materials in solar cells and other energy storage applications is fueling market expansion. Technological advancements in synthesis methods contribute to improved product quality and cost-effectiveness, driving wider adoption. Shifts in consumer behavior towards sustainable technologies also indirectly support market growth. We project a CAGR of xx% during the forecast period (2025-2033), with market penetration steadily increasing in emerging economies. Market size is expected to reach xx million units by 2033.
Dominant Regions, Countries, or Segments in Cadmium Oxide
The Asia-Pacific region is expected to dominate the Cadmium Oxide market during the forecast period, driven by robust growth in the electronics and battery industries within countries like China and India. High manufacturing output, coupled with supportive government policies and investments in infrastructure, creates a favorable environment for market expansion. Europe and North America are also key regions, but growth rates are comparatively slower. The electronics segment consistently demonstrates the highest demand, due to the widespread use of Cadmium Oxide in various components.
- Key Drivers in Asia-Pacific: Robust electronics manufacturing, supportive government policies, and rising investments in infrastructure.
- Dominance Factors: High production capacity, established supply chains, and strong demand from end-use industries.
- Growth Potential: Significant potential in emerging economies of Southeast Asia.
Cadmium Oxide Product Landscape
Cadmium Oxide is primarily offered in powder, granular, and nanoparticle forms, each tailored to specific applications. Recent innovations focus on improving purity levels and particle size control to enhance performance in diverse applications such as solar cells, pigments, and catalysts. Key selling propositions emphasize high purity, consistent quality, and tailored particle size distributions for optimized performance. Technological advancements are focused on optimizing production methods to lower costs and reduce environmental impact.
Key Drivers, Barriers & Challenges in Cadmium Oxide
Key Drivers: The growing electronics industry and the increasing demand for energy storage solutions are major drivers for the Cadmium Oxide market. Advancements in material science and production processes, resulting in higher quality and more cost-effective Cadmium Oxide products, further bolster market growth. Furthermore, government initiatives supporting renewable energy technologies positively influence market dynamics.
Key Challenges: The toxicity of cadmium presents significant challenges, including stringent regulations on production, handling, and disposal. This leads to higher production costs and supply chain complexities. The availability of alternative materials (such as Zinc Oxide) also poses a competitive challenge. Fluctuations in raw material prices and geopolitical instability can further disrupt supply chains and market stability. xx% of production was impacted by supply chain issues in 2024.
Emerging Opportunities in Cadmium Oxide
Emerging opportunities lie in the exploration of novel applications for Cadmium Oxide, particularly in advanced electronics and energy storage technologies. The development of sustainable and environmentally friendly production processes will attract environmentally conscious customers. Expansion into emerging markets offers significant potential for market growth.
Growth Accelerators in the Cadmium Oxide Industry
Technological advancements, particularly in nanotechnology and material science, are crucial growth accelerators. Strategic partnerships and collaborations among manufacturers, research institutions, and end-users can drive innovation and market expansion. The development and adoption of sustainable production methods will contribute to long-term market sustainability.
Key Players Shaping the Cadmium Oxide Market
- Stanford Advanced Materials
- Vital Materials
- ACS Chemicals
- Oxford Lab Fine Chem LLP
- Powder Pack Chem
- Laxmi Narayan & Sons
- Durga Chemicals
- A B Enterprises
- Qualikems Lifesciences
- Canton Laboratories
- Triveni Chemicals
- Todini Metals And Chemicals
- Chemtrade International Corporation
- CDH
- Ashoka Meta Chem Industries
- Metalor Technologies Group
- Guangzhou Chemical Reagent Factory
- Hebei Zhenjia New Material
- FINAR
- American Elements
Notable Milestones in Cadmium Oxide Sector
- 2021: Stanford Advanced Materials launched a new high-purity Cadmium Oxide product line.
- 2022: A new cadmium recycling facility opened in Germany, improving material supply.
- 2023: Several key players announced strategic partnerships to enhance their supply chains.
- 2024: Increased regulations around cadmium handling led to some production facility closures.
In-Depth Cadmium Oxide Market Outlook
The Cadmium Oxide market is poised for continued growth driven by technological advancements, particularly in energy storage solutions and advanced electronics. The emphasis on sustainable production methods and the exploration of novel applications offer promising opportunities for market expansion. Strategic partnerships and investments in research and development will play a pivotal role in shaping future market dynamics. The report projects strong long-term growth potential, with significant opportunities for early entrants into specific niche applications.
Cadmium Oxide Segmentation
-
1. Application
- 1.1. Electronics and Semiconductors
- 1.2. Chemical
- 1.3. Retail
-
2. Types
- 2.1. Below 98%
- 2.2. 99%
- 2.3. 99.5%
Cadmium Oxide Segmentation By Geography
-
1. North America
- 1.1. United States
- 1.2. Canada
- 1.3. Mexico
-
2. South America
- 2.1. Brazil
- 2.2. Argentina
- 2.3. Rest of South America
-
3. Europe
- 3.1. United Kingdom
- 3.2. Germany
- 3.3. France
- 3.4. Italy
- 3.5. Spain
- 3.6. Russia
- 3.7. Benelux
- 3.8. Nordics
- 3.9. Rest of Europe
-
4. Middle East & Africa
- 4.1. Turkey
- 4.2. Israel
- 4.3. GCC
- 4.4. North Africa
- 4.5. South Africa
- 4.6. Rest of Middle East & Africa
-
5. Asia Pacific
- 5.1. China
- 5.2. India
- 5.3. Japan
- 5.4. South Korea
- 5.5. ASEAN
- 5.6. Oceania
- 5.7. Rest of Asia Pacific
Cadmium Oxide Regional Market Share
Geographic Coverage of Cadmium Oxide
Cadmium Oxide REPORT HIGHLIGHTS
| Aspects | Details |
|---|---|
| Study Period | 2020-2034 |
| Base Year | 2025 |
| Estimated Year | 2026 |
| Forecast Period | 2026-2034 |
| Historical Period | 2020-2025 |
| Growth Rate | CAGR of XX% from 2020-2034 |
| Segmentation |
|
Table of Contents
- 1. Introduction
- 1.1. Research Scope
- 1.2. Market Segmentation
- 1.3. Research Methodology
- 1.4. Definitions and Assumptions
- 2. Executive Summary
- 2.1. Introduction
- 3. Market Dynamics
- 3.1. Introduction
- 3.2. Market Drivers
- 3.3. Market Restrains
- 3.4. Market Trends
- 4. Market Factor Analysis
- 4.1. Porters Five Forces
- 4.2. Supply/Value Chain
- 4.3. PESTEL analysis
- 4.4. Market Entropy
- 4.5. Patent/Trademark Analysis
- 5. Global Cadmium Oxide Analysis, Insights and Forecast, 2020-2032
- 5.1. Market Analysis, Insights and Forecast - by Application
- 5.1.1. Electronics and Semiconductors
- 5.1.2. Chemical
- 5.1.3. Retail
- 5.2. Market Analysis, Insights and Forecast - by Types
- 5.2.1. Below 98%
- 5.2.2. 99%
- 5.2.3. 99.5%
- 5.3. Market Analysis, Insights and Forecast - by Region
- 5.3.1. North America
- 5.3.2. South America
- 5.3.3. Europe
- 5.3.4. Middle East & Africa
- 5.3.5. Asia Pacific
- 5.1. Market Analysis, Insights and Forecast - by Application
- 6. North America Cadmium Oxide Analysis, Insights and Forecast, 2020-2032
- 6.1. Market Analysis, Insights and Forecast - by Application
- 6.1.1. Electronics and Semiconductors
- 6.1.2. Chemical
- 6.1.3. Retail
- 6.2. Market Analysis, Insights and Forecast - by Types
- 6.2.1. Below 98%
- 6.2.2. 99%
- 6.2.3. 99.5%
- 6.1. Market Analysis, Insights and Forecast - by Application
- 7. South America Cadmium Oxide Analysis, Insights and Forecast, 2020-2032
- 7.1. Market Analysis, Insights and Forecast - by Application
- 7.1.1. Electronics and Semiconductors
- 7.1.2. Chemical
- 7.1.3. Retail
- 7.2. Market Analysis, Insights and Forecast - by Types
- 7.2.1. Below 98%
- 7.2.2. 99%
- 7.2.3. 99.5%
- 7.1. Market Analysis, Insights and Forecast - by Application
- 8. Europe Cadmium Oxide Analysis, Insights and Forecast, 2020-2032
- 8.1. Market Analysis, Insights and Forecast - by Application
- 8.1.1. Electronics and Semiconductors
- 8.1.2. Chemical
- 8.1.3. Retail
- 8.2. Market Analysis, Insights and Forecast - by Types
- 8.2.1. Below 98%
- 8.2.2. 99%
- 8.2.3. 99.5%
- 8.1. Market Analysis, Insights and Forecast - by Application
- 9. Middle East & Africa Cadmium Oxide Analysis, Insights and Forecast, 2020-2032
- 9.1. Market Analysis, Insights and Forecast - by Application
- 9.1.1. Electronics and Semiconductors
- 9.1.2. Chemical
- 9.1.3. Retail
- 9.2. Market Analysis, Insights and Forecast - by Types
- 9.2.1. Below 98%
- 9.2.2. 99%
- 9.2.3. 99.5%
- 9.1. Market Analysis, Insights and Forecast - by Application
- 10. Asia Pacific Cadmium Oxide Analysis, Insights and Forecast, 2020-2032
- 10.1. Market Analysis, Insights and Forecast - by Application
- 10.1.1. Electronics and Semiconductors
- 10.1.2. Chemical
- 10.1.3. Retail
- 10.2. Market Analysis, Insights and Forecast - by Types
- 10.2.1. Below 98%
- 10.2.2. 99%
- 10.2.3. 99.5%
- 10.1. Market Analysis, Insights and Forecast - by Application
- 11. Competitive Analysis
- 11.1. Global Market Share Analysis 2025
- 11.2. Company Profiles
- 11.2.1 Stanford Advanced Materials
- 11.2.1.1. Overview
- 11.2.1.2. Products
- 11.2.1.3. SWOT Analysis
- 11.2.1.4. Recent Developments
- 11.2.1.5. Financials (Based on Availability)
- 11.2.2 Vital Materials
- 11.2.2.1. Overview
- 11.2.2.2. Products
- 11.2.2.3. SWOT Analysis
- 11.2.2.4. Recent Developments
- 11.2.2.5. Financials (Based on Availability)
- 11.2.3 ACS Chemicals
- 11.2.3.1. Overview
- 11.2.3.2. Products
- 11.2.3.3. SWOT Analysis
- 11.2.3.4. Recent Developments
- 11.2.3.5. Financials (Based on Availability)
- 11.2.4 Oxford Lab Fine Chem LLP
- 11.2.4.1. Overview
- 11.2.4.2. Products
- 11.2.4.3. SWOT Analysis
- 11.2.4.4. Recent Developments
- 11.2.4.5. Financials (Based on Availability)
- 11.2.5 Powder Pack Chem
- 11.2.5.1. Overview
- 11.2.5.2. Products
- 11.2.5.3. SWOT Analysis
- 11.2.5.4. Recent Developments
- 11.2.5.5. Financials (Based on Availability)
- 11.2.6 Laxmi Narayan & Sons
- 11.2.6.1. Overview
- 11.2.6.2. Products
- 11.2.6.3. SWOT Analysis
- 11.2.6.4. Recent Developments
- 11.2.6.5. Financials (Based on Availability)
- 11.2.7 Durga Chemicals
- 11.2.7.1. Overview
- 11.2.7.2. Products
- 11.2.7.3. SWOT Analysis
- 11.2.7.4. Recent Developments
- 11.2.7.5. Financials (Based on Availability)
- 11.2.8 A B Enterprises
- 11.2.8.1. Overview
- 11.2.8.2. Products
- 11.2.8.3. SWOT Analysis
- 11.2.8.4. Recent Developments
- 11.2.8.5. Financials (Based on Availability)
- 11.2.9 Qualikems Lifesciences
- 11.2.9.1. Overview
- 11.2.9.2. Products
- 11.2.9.3. SWOT Analysis
- 11.2.9.4. Recent Developments
- 11.2.9.5. Financials (Based on Availability)
- 11.2.10 Canton Laboratories
- 11.2.10.1. Overview
- 11.2.10.2. Products
- 11.2.10.3. SWOT Analysis
- 11.2.10.4. Recent Developments
- 11.2.10.5. Financials (Based on Availability)
- 11.2.11 Triveni Chemicals
- 11.2.11.1. Overview
- 11.2.11.2. Products
- 11.2.11.3. SWOT Analysis
- 11.2.11.4. Recent Developments
- 11.2.11.5. Financials (Based on Availability)
- 11.2.12 Todini Metals And Chemicals
- 11.2.12.1. Overview
- 11.2.12.2. Products
- 11.2.12.3. SWOT Analysis
- 11.2.12.4. Recent Developments
- 11.2.12.5. Financials (Based on Availability)
- 11.2.13 Chemtrade International Corporation
- 11.2.13.1. Overview
- 11.2.13.2. Products
- 11.2.13.3. SWOT Analysis
- 11.2.13.4. Recent Developments
- 11.2.13.5. Financials (Based on Availability)
- 11.2.14 CDH
- 11.2.14.1. Overview
- 11.2.14.2. Products
- 11.2.14.3. SWOT Analysis
- 11.2.14.4. Recent Developments
- 11.2.14.5. Financials (Based on Availability)
- 11.2.15 Ashoka Meta Chem Industries
- 11.2.15.1. Overview
- 11.2.15.2. Products
- 11.2.15.3. SWOT Analysis
- 11.2.15.4. Recent Developments
- 11.2.15.5. Financials (Based on Availability)
- 11.2.16 Metalor Technologies Group
- 11.2.16.1. Overview
- 11.2.16.2. Products
- 11.2.16.3. SWOT Analysis
- 11.2.16.4. Recent Developments
- 11.2.16.5. Financials (Based on Availability)
- 11.2.17 Guangzhou Chemical Reagent Factory
- 11.2.17.1. Overview
- 11.2.17.2. Products
- 11.2.17.3. SWOT Analysis
- 11.2.17.4. Recent Developments
- 11.2.17.5. Financials (Based on Availability)
- 11.2.18 Hebei Zhenjia New Material
- 11.2.18.1. Overview
- 11.2.18.2. Products
- 11.2.18.3. SWOT Analysis
- 11.2.18.4. Recent Developments
- 11.2.18.5. Financials (Based on Availability)
- 11.2.19 FINAR
- 11.2.19.1. Overview
- 11.2.19.2. Products
- 11.2.19.3. SWOT Analysis
- 11.2.19.4. Recent Developments
- 11.2.19.5. Financials (Based on Availability)
- 11.2.20 American Elements
- 11.2.20.1. Overview
- 11.2.20.2. Products
- 11.2.20.3. SWOT Analysis
- 11.2.20.4. Recent Developments
- 11.2.20.5. Financials (Based on Availability)
- 11.2.1 Stanford Advanced Materials
List of Figures
- Figure 1: Global Cadmium Oxide Revenue Breakdown (million, %) by Region 2025 & 2033
- Figure 2: Global Cadmium Oxide Volume Breakdown (K, %) by Region 2025 & 2033
- Figure 3: North America Cadmium Oxide Revenue (million), by Application 2025 & 2033
- Figure 4: North America Cadmium Oxide Volume (K), by Application 2025 & 2033
- Figure 5: North America Cadmium Oxide Revenue Share (%), by Application 2025 & 2033
- Figure 6: North America Cadmium Oxide Volume Share (%), by Application 2025 & 2033
- Figure 7: North America Cadmium Oxide Revenue (million), by Types 2025 & 2033
- Figure 8: North America Cadmium Oxide Volume (K), by Types 2025 & 2033
- Figure 9: North America Cadmium Oxide Revenue Share (%), by Types 2025 & 2033
- Figure 10: North America Cadmium Oxide Volume Share (%), by Types 2025 & 2033
- Figure 11: North America Cadmium Oxide Revenue (million), by Country 2025 & 2033
- Figure 12: North America Cadmium Oxide Volume (K), by Country 2025 & 2033
- Figure 13: North America Cadmium Oxide Revenue Share (%), by Country 2025 & 2033
- Figure 14: North America Cadmium Oxide Volume Share (%), by Country 2025 & 2033
- Figure 15: South America Cadmium Oxide Revenue (million), by Application 2025 & 2033
- Figure 16: South America Cadmium Oxide Volume (K), by Application 2025 & 2033
- Figure 17: South America Cadmium Oxide Revenue Share (%), by Application 2025 & 2033
- Figure 18: South America Cadmium Oxide Volume Share (%), by Application 2025 & 2033
- Figure 19: South America Cadmium Oxide Revenue (million), by Types 2025 & 2033
- Figure 20: South America Cadmium Oxide Volume (K), by Types 2025 & 2033
- Figure 21: South America Cadmium Oxide Revenue Share (%), by Types 2025 & 2033
- Figure 22: South America Cadmium Oxide Volume Share (%), by Types 2025 & 2033
- Figure 23: South America Cadmium Oxide Revenue (million), by Country 2025 & 2033
- Figure 24: South America Cadmium Oxide Volume (K), by Country 2025 & 2033
- Figure 25: South America Cadmium Oxide Revenue Share (%), by Country 2025 & 2033
- Figure 26: South America Cadmium Oxide Volume Share (%), by Country 2025 & 2033
- Figure 27: Europe Cadmium Oxide Revenue (million), by Application 2025 & 2033
- Figure 28: Europe Cadmium Oxide Volume (K), by Application 2025 & 2033
- Figure 29: Europe Cadmium Oxide Revenue Share (%), by Application 2025 & 2033
- Figure 30: Europe Cadmium Oxide Volume Share (%), by Application 2025 & 2033
- Figure 31: Europe Cadmium Oxide Revenue (million), by Types 2025 & 2033
- Figure 32: Europe Cadmium Oxide Volume (K), by Types 2025 & 2033
- Figure 33: Europe Cadmium Oxide Revenue Share (%), by Types 2025 & 2033
- Figure 34: Europe Cadmium Oxide Volume Share (%), by Types 2025 & 2033
- Figure 35: Europe Cadmium Oxide Revenue (million), by Country 2025 & 2033
- Figure 36: Europe Cadmium Oxide Volume (K), by Country 2025 & 2033
- Figure 37: Europe Cadmium Oxide Revenue Share (%), by Country 2025 & 2033
- Figure 38: Europe Cadmium Oxide Volume Share (%), by Country 2025 & 2033
- Figure 39: Middle East & Africa Cadmium Oxide Revenue (million), by Application 2025 & 2033
- Figure 40: Middle East & Africa Cadmium Oxide Volume (K), by Application 2025 & 2033
- Figure 41: Middle East & Africa Cadmium Oxide Revenue Share (%), by Application 2025 & 2033
- Figure 42: Middle East & Africa Cadmium Oxide Volume Share (%), by Application 2025 & 2033
- Figure 43: Middle East & Africa Cadmium Oxide Revenue (million), by Types 2025 & 2033
- Figure 44: Middle East & Africa Cadmium Oxide Volume (K), by Types 2025 & 2033
- Figure 45: Middle East & Africa Cadmium Oxide Revenue Share (%), by Types 2025 & 2033
- Figure 46: Middle East & Africa Cadmium Oxide Volume Share (%), by Types 2025 & 2033
- Figure 47: Middle East & Africa Cadmium Oxide Revenue (million), by Country 2025 & 2033
- Figure 48: Middle East & Africa Cadmium Oxide Volume (K), by Country 2025 & 2033
- Figure 49: Middle East & Africa Cadmium Oxide Revenue Share (%), by Country 2025 & 2033
- Figure 50: Middle East & Africa Cadmium Oxide Volume Share (%), by Country 2025 & 2033
- Figure 51: Asia Pacific Cadmium Oxide Revenue (million), by Application 2025 & 2033
- Figure 52: Asia Pacific Cadmium Oxide Volume (K), by Application 2025 & 2033
- Figure 53: Asia Pacific Cadmium Oxide Revenue Share (%), by Application 2025 & 2033
- Figure 54: Asia Pacific Cadmium Oxide Volume Share (%), by Application 2025 & 2033
- Figure 55: Asia Pacific Cadmium Oxide Revenue (million), by Types 2025 & 2033
- Figure 56: Asia Pacific Cadmium Oxide Volume (K), by Types 2025 & 2033
- Figure 57: Asia Pacific Cadmium Oxide Revenue Share (%), by Types 2025 & 2033
- Figure 58: Asia Pacific Cadmium Oxide Volume Share (%), by Types 2025 & 2033
- Figure 59: Asia Pacific Cadmium Oxide Revenue (million), by Country 2025 & 2033
- Figure 60: Asia Pacific Cadmium Oxide Volume (K), by Country 2025 & 2033
- Figure 61: Asia Pacific Cadmium Oxide Revenue Share (%), by Country 2025 & 2033
- Figure 62: Asia Pacific Cadmium Oxide Volume Share (%), by Country 2025 & 2033
List of Tables
- Table 1: Global Cadmium Oxide Revenue million Forecast, by Application 2020 & 2033
- Table 2: Global Cadmium Oxide Volume K Forecast, by Application 2020 & 2033
- Table 3: Global Cadmium Oxide Revenue million Forecast, by Types 2020 & 2033
- Table 4: Global Cadmium Oxide Volume K Forecast, by Types 2020 & 2033
- Table 5: Global Cadmium Oxide Revenue million Forecast, by Region 2020 & 2033
- Table 6: Global Cadmium Oxide Volume K Forecast, by Region 2020 & 2033
- Table 7: Global Cadmium Oxide Revenue million Forecast, by Application 2020 & 2033
- Table 8: Global Cadmium Oxide Volume K Forecast, by Application 2020 & 2033
- Table 9: Global Cadmium Oxide Revenue million Forecast, by Types 2020 & 2033
- Table 10: Global Cadmium Oxide Volume K Forecast, by Types 2020 & 2033
- Table 11: Global Cadmium Oxide Revenue million Forecast, by Country 2020 & 2033
- Table 12: Global Cadmium Oxide Volume K Forecast, by Country 2020 & 2033
- Table 13: United States Cadmium Oxide Revenue (million) Forecast, by Application 2020 & 2033
- Table 14: United States Cadmium Oxide Volume (K) Forecast, by Application 2020 & 2033
- Table 15: Canada Cadmium Oxide Revenue (million) Forecast, by Application 2020 & 2033
- Table 16: Canada Cadmium Oxide Volume (K) Forecast, by Application 2020 & 2033
- Table 17: Mexico Cadmium Oxide Revenue (million) Forecast, by Application 2020 & 2033
- Table 18: Mexico Cadmium Oxide Volume (K) Forecast, by Application 2020 & 2033
- Table 19: Global Cadmium Oxide Revenue million Forecast, by Application 2020 & 2033
- Table 20: Global Cadmium Oxide Volume K Forecast, by Application 2020 & 2033
- Table 21: Global Cadmium Oxide Revenue million Forecast, by Types 2020 & 2033
- Table 22: Global Cadmium Oxide Volume K Forecast, by Types 2020 & 2033
- Table 23: Global Cadmium Oxide Revenue million Forecast, by Country 2020 & 2033
- Table 24: Global Cadmium Oxide Volume K Forecast, by Country 2020 & 2033
- Table 25: Brazil Cadmium Oxide Revenue (million) Forecast, by Application 2020 & 2033
- Table 26: Brazil Cadmium Oxide Volume (K) Forecast, by Application 2020 & 2033
- Table 27: Argentina Cadmium Oxide Revenue (million) Forecast, by Application 2020 & 2033
- Table 28: Argentina Cadmium Oxide Volume (K) Forecast, by Application 2020 & 2033
- Table 29: Rest of South America Cadmium Oxide Revenue (million) Forecast, by Application 2020 & 2033
- Table 30: Rest of South America Cadmium Oxide Volume (K) Forecast, by Application 2020 & 2033
- Table 31: Global Cadmium Oxide Revenue million Forecast, by Application 2020 & 2033
- Table 32: Global Cadmium Oxide Volume K Forecast, by Application 2020 & 2033
- Table 33: Global Cadmium Oxide Revenue million Forecast, by Types 2020 & 2033
- Table 34: Global Cadmium Oxide Volume K Forecast, by Types 2020 & 2033
- Table 35: Global Cadmium Oxide Revenue million Forecast, by Country 2020 & 2033
- Table 36: Global Cadmium Oxide Volume K Forecast, by Country 2020 & 2033
- Table 37: United Kingdom Cadmium Oxide Revenue (million) Forecast, by Application 2020 & 2033
- Table 38: United Kingdom Cadmium Oxide Volume (K) Forecast, by Application 2020 & 2033
- Table 39: Germany Cadmium Oxide Revenue (million) Forecast, by Application 2020 & 2033
- Table 40: Germany Cadmium Oxide Volume (K) Forecast, by Application 2020 & 2033
- Table 41: France Cadmium Oxide Revenue (million) Forecast, by Application 2020 & 2033
- Table 42: France Cadmium Oxide Volume (K) Forecast, by Application 2020 & 2033
- Table 43: Italy Cadmium Oxide Revenue (million) Forecast, by Application 2020 & 2033
- Table 44: Italy Cadmium Oxide Volume (K) Forecast, by Application 2020 & 2033
- Table 45: Spain Cadmium Oxide Revenue (million) Forecast, by Application 2020 & 2033
- Table 46: Spain Cadmium Oxide Volume (K) Forecast, by Application 2020 & 2033
- Table 47: Russia Cadmium Oxide Revenue (million) Forecast, by Application 2020 & 2033
- Table 48: Russia Cadmium Oxide Volume (K) Forecast, by Application 2020 & 2033
- Table 49: Benelux Cadmium Oxide Revenue (million) Forecast, by Application 2020 & 2033
- Table 50: Benelux Cadmium Oxide Volume (K) Forecast, by Application 2020 & 2033
- Table 51: Nordics Cadmium Oxide Revenue (million) Forecast, by Application 2020 & 2033
- Table 52: Nordics Cadmium Oxide Volume (K) Forecast, by Application 2020 & 2033
- Table 53: Rest of Europe Cadmium Oxide Revenue (million) Forecast, by Application 2020 & 2033
- Table 54: Rest of Europe Cadmium Oxide Volume (K) Forecast, by Application 2020 & 2033
- Table 55: Global Cadmium Oxide Revenue million Forecast, by Application 2020 & 2033
- Table 56: Global Cadmium Oxide Volume K Forecast, by Application 2020 & 2033
- Table 57: Global Cadmium Oxide Revenue million Forecast, by Types 2020 & 2033
- Table 58: Global Cadmium Oxide Volume K Forecast, by Types 2020 & 2033
- Table 59: Global Cadmium Oxide Revenue million Forecast, by Country 2020 & 2033
- Table 60: Global Cadmium Oxide Volume K Forecast, by Country 2020 & 2033
- Table 61: Turkey Cadmium Oxide Revenue (million) Forecast, by Application 2020 & 2033
- Table 62: Turkey Cadmium Oxide Volume (K) Forecast, by Application 2020 & 2033
- Table 63: Israel Cadmium Oxide Revenue (million) Forecast, by Application 2020 & 2033
- Table 64: Israel Cadmium Oxide Volume (K) Forecast, by Application 2020 & 2033
- Table 65: GCC Cadmium Oxide Revenue (million) Forecast, by Application 2020 & 2033
- Table 66: GCC Cadmium Oxide Volume (K) Forecast, by Application 2020 & 2033
- Table 67: North Africa Cadmium Oxide Revenue (million) Forecast, by Application 2020 & 2033
- Table 68: North Africa Cadmium Oxide Volume (K) Forecast, by Application 2020 & 2033
- Table 69: South Africa Cadmium Oxide Revenue (million) Forecast, by Application 2020 & 2033
- Table 70: South Africa Cadmium Oxide Volume (K) Forecast, by Application 2020 & 2033
- Table 71: Rest of Middle East & Africa Cadmium Oxide Revenue (million) Forecast, by Application 2020 & 2033
- Table 72: Rest of Middle East & Africa Cadmium Oxide Volume (K) Forecast, by Application 2020 & 2033
- Table 73: Global Cadmium Oxide Revenue million Forecast, by Application 2020 & 2033
- Table 74: Global Cadmium Oxide Volume K Forecast, by Application 2020 & 2033
- Table 75: Global Cadmium Oxide Revenue million Forecast, by Types 2020 & 2033
- Table 76: Global Cadmium Oxide Volume K Forecast, by Types 2020 & 2033
- Table 77: Global Cadmium Oxide Revenue million Forecast, by Country 2020 & 2033
- Table 78: Global Cadmium Oxide Volume K Forecast, by Country 2020 & 2033
- Table 79: China Cadmium Oxide Revenue (million) Forecast, by Application 2020 & 2033
- Table 80: China Cadmium Oxide Volume (K) Forecast, by Application 2020 & 2033
- Table 81: India Cadmium Oxide Revenue (million) Forecast, by Application 2020 & 2033
- Table 82: India Cadmium Oxide Volume (K) Forecast, by Application 2020 & 2033
- Table 83: Japan Cadmium Oxide Revenue (million) Forecast, by Application 2020 & 2033
- Table 84: Japan Cadmium Oxide Volume (K) Forecast, by Application 2020 & 2033
- Table 85: South Korea Cadmium Oxide Revenue (million) Forecast, by Application 2020 & 2033
- Table 86: South Korea Cadmium Oxide Volume (K) Forecast, by Application 2020 & 2033
- Table 87: ASEAN Cadmium Oxide Revenue (million) Forecast, by Application 2020 & 2033
- Table 88: ASEAN Cadmium Oxide Volume (K) Forecast, by Application 2020 & 2033
- Table 89: Oceania Cadmium Oxide Revenue (million) Forecast, by Application 2020 & 2033
- Table 90: Oceania Cadmium Oxide Volume (K) Forecast, by Application 2020 & 2033
- Table 91: Rest of Asia Pacific Cadmium Oxide Revenue (million) Forecast, by Application 2020 & 2033
- Table 92: Rest of Asia Pacific Cadmium Oxide Volume (K) Forecast, by Application 2020 & 2033
Frequently Asked Questions
1. What is the projected Compound Annual Growth Rate (CAGR) of the Cadmium Oxide?
The projected CAGR is approximately XX%.
2. Which companies are prominent players in the Cadmium Oxide?
Key companies in the market include Stanford Advanced Materials, Vital Materials, ACS Chemicals, Oxford Lab Fine Chem LLP, Powder Pack Chem, Laxmi Narayan & Sons, Durga Chemicals, A B Enterprises, Qualikems Lifesciences, Canton Laboratories, Triveni Chemicals, Todini Metals And Chemicals, Chemtrade International Corporation, CDH, Ashoka Meta Chem Industries, Metalor Technologies Group, Guangzhou Chemical Reagent Factory, Hebei Zhenjia New Material, FINAR, American Elements.
3. What are the main segments of the Cadmium Oxide?
The market segments include Application, Types.
4. Can you provide details about the market size?
The market size is estimated to be USD XXX million as of 2022.
5. What are some drivers contributing to market growth?
N/A
6. What are the notable trends driving market growth?
N/A
7. Are there any restraints impacting market growth?
N/A
8. Can you provide examples of recent developments in the market?
N/A
9. What pricing options are available for accessing the report?
Pricing options include single-user, multi-user, and enterprise licenses priced at USD 4350.00, USD 6525.00, and USD 8700.00 respectively.
10. Is the market size provided in terms of value or volume?
The market size is provided in terms of value, measured in million and volume, measured in K.
11. Are there any specific market keywords associated with the report?
Yes, the market keyword associated with the report is "Cadmium Oxide," which aids in identifying and referencing the specific market segment covered.
12. How do I determine which pricing option suits my needs best?
The pricing options vary based on user requirements and access needs. Individual users may opt for single-user licenses, while businesses requiring broader access may choose multi-user or enterprise licenses for cost-effective access to the report.
13. Are there any additional resources or data provided in the Cadmium Oxide report?
While the report offers comprehensive insights, it's advisable to review the specific contents or supplementary materials provided to ascertain if additional resources or data are available.
14. How can I stay updated on further developments or reports in the Cadmium Oxide?
To stay informed about further developments, trends, and reports in the Cadmium Oxide, consider subscribing to industry newsletters, following relevant companies and organizations, or regularly checking reputable industry news sources and publications.
Methodology
Step 1 - Identification of Relevant Samples Size from Population Database


Step 2 - Approaches for Defining Global Market Size (Value, Volume* & Price*)

Note*: In applicable scenarios
Step 3 - Data Sources
Primary Research
- Web Analytics
- Survey Reports
- Research Institute
- Latest Research Reports
- Opinion Leaders
Secondary Research
- Annual Reports
- White Paper
- Latest Press Release
- Industry Association
- Paid Database
- Investor Presentations

Step 4 - Data Triangulation
Involves using different sources of information in order to increase the validity of a study
These sources are likely to be stakeholders in a program - participants, other researchers, program staff, other community members, and so on.
Then we put all data in single framework & apply various statistical tools to find out the dynamic on the market.
During the analysis stage, feedback from the stakeholder groups would be compared to determine areas of agreement as well as areas of divergence