

Key Insights
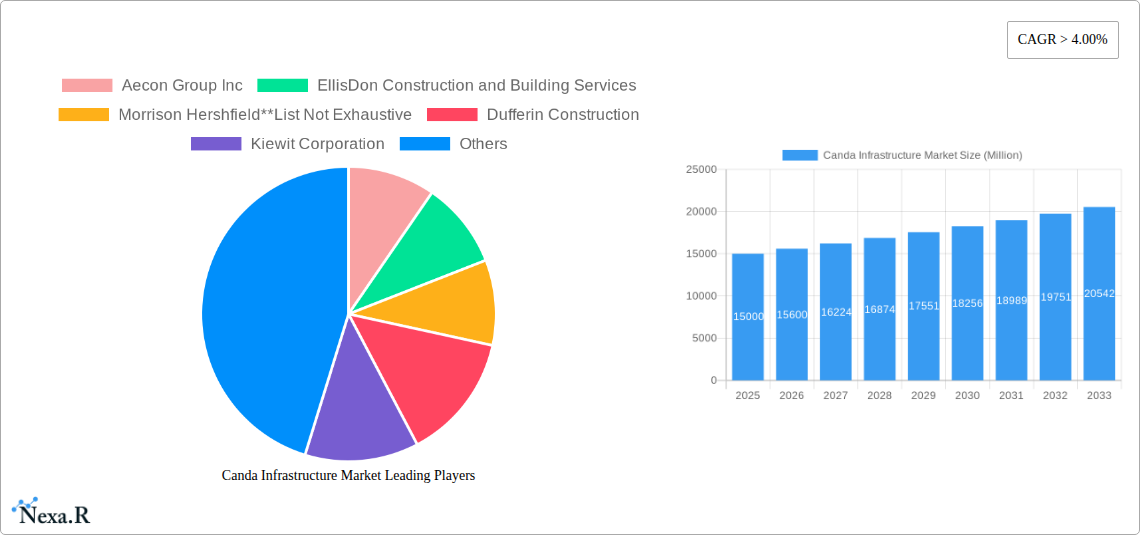
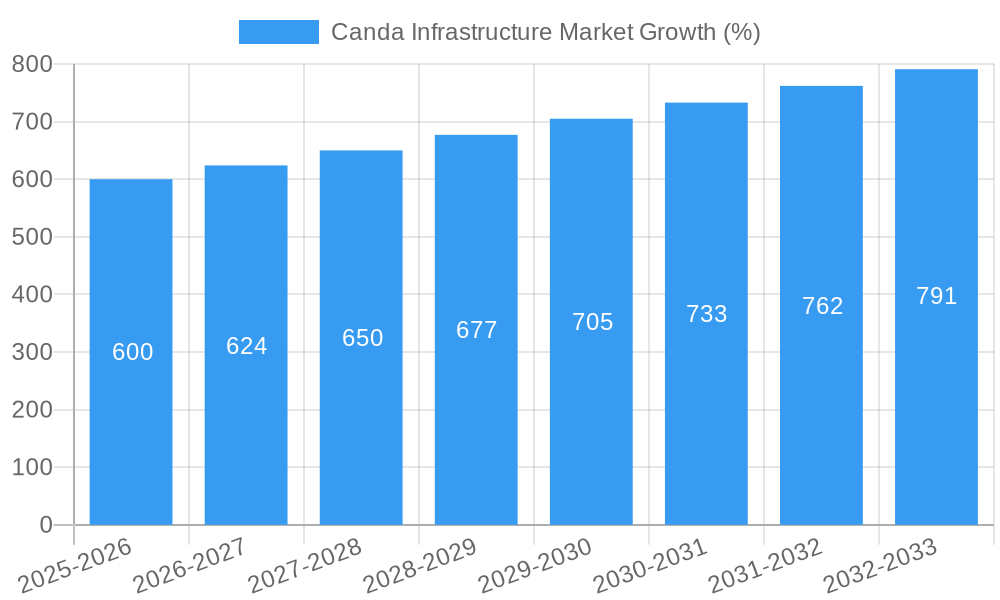
The Canadian infrastructure market, exhibiting a robust Compound Annual Growth Rate (CAGR) exceeding 4%, presents a significant investment opportunity. Driven by increasing government spending on social infrastructure projects like hospitals, schools, and public transportation, coupled with a growing need for upgrades to aging water and telecommunications infrastructure, the market is poised for sustained expansion. The transportation sector, including roadways, railways, and waterways, is a particularly strong contributor, fueled by demands for efficient logistics and improved connectivity across the vast Canadian landscape. While challenges exist, such as potential material cost fluctuations and workforce limitations, the long-term outlook remains positive. Major players like Aecon Group Inc., EllisDon, and Pomerleau are well-positioned to benefit from this growth, although competition remains fierce. The market segmentation across various infrastructure types allows for specialized expertise and targeted investment strategies. The forecast period of 2025-2033 anticipates continued expansion, with the market likely reaching substantial value considering the current growth trajectory and planned government initiatives.
Further analysis suggests that the "Other Social Infrastructures" segment, encompassing a broad range of projects, and the Transportation Infrastructure segment will continue to drive significant market share. The consistent CAGR of over 4% indicates a healthy and expanding market, reflecting both the necessity of infrastructural improvements and government prioritization of these areas. The ongoing development of innovative construction technologies and sustainable practices will also shape market trends in the coming years. The successful navigation of potential supply chain disruptions and the ongoing recruitment and retention of skilled labor will be critical factors influencing future growth. Considering the scale and longevity of infrastructure projects, long-term strategic partnerships and consistent government investment will be vital for the market's ongoing success.
Canada Infrastructure Market Report: 2019-2033
This comprehensive report provides a detailed analysis of the Canadian infrastructure market, encompassing its current state, growth trajectory, and future prospects. The study period covers 2019-2033, with a base year of 2025 and a forecast period of 2025-2033. We delve into key market segments, influential players, and emerging trends, offering invaluable insights for industry professionals, investors, and strategic decision-makers. Market values are presented in millions of units.
Canada Infrastructure Market Dynamics & Structure
The Canadian infrastructure market exhibits a moderately concentrated structure, with a few dominant players alongside numerous smaller firms. Technological innovation, particularly in areas like smart cities and sustainable infrastructure, is a key driver. However, regulatory hurdles and lengthy approval processes pose significant barriers to entry and growth. The market is subject to substantial government spending and policy changes, impacting project development and investment cycles. Mergers and acquisitions (M&A) activity is relatively high, reflecting consolidation and strategic expansion within the sector.
- Market Concentration: xx% held by top 5 players (2024).
- M&A Activity (2019-2024): xx deals, totaling xx Million in value.
- Technological Innovation Drivers: Smart city technologies, sustainable materials, digital twinning.
- Regulatory Frameworks: Provincial and federal regulations significantly influence project timelines and costs.
- Competitive Product Substitutes: Limited direct substitutes, but alternative construction methodologies and materials influence project costs.
- End-User Demographics: Primarily government agencies (federal, provincial, municipal), but also private sector involvement in PPPs (Public-Private Partnerships).
Canada Infrastructure Market Growth Trends & Insights
The Canadian infrastructure market experienced robust growth between 2019 and 2024, driven by increasing government investment in infrastructure projects. The market size is projected to continue its expansion throughout the forecast period, albeit at a slightly moderated pace. Adoption rates of new technologies are increasing, particularly in areas like smart transportation and water management. Consumer behavior shifts, including heightened environmental awareness, are influencing project design and material selection.
- Market Size (2024): xx Million
- Market Size (2033): xx Million
- CAGR (2025-2033): xx%
- Market Penetration (Smart City Technologies): xx% (2024), projected to reach xx% by 2033.
Dominant Regions, Countries, or Segments in Canada Infrastructure Market
Transportation infrastructure constitutes the largest segment of the Canadian infrastructure market, followed by social infrastructure and water infrastructure. Ontario and British Columbia represent the most significant regional markets due to robust economic activity and ongoing infrastructure development. High population density, economic growth, and government initiatives drive growth in these regions.
- Dominant Segment: Transportation Infrastructure (Market Share: xx% in 2024)
- Key Drivers in Transportation Infrastructure: Increasing urbanization, growing freight volumes, need for efficient public transit.
- Dominant Region: Ontario (Market Share: xx% in 2024)
- Key Drivers in Ontario: Strong economic growth, significant government investments, large-scale infrastructure projects.
Canada Infrastructure Market Product Landscape
The Canadian infrastructure market offers a wide range of products and services, encompassing design, engineering, construction, and maintenance. Product innovation is driven by a focus on sustainability, resilience, and technological integration. Advanced materials, prefabrication techniques, and digital construction methods enhance efficiency and project outcomes. The market showcases unique selling propositions through specialization in niche areas, such as sustainable building materials and innovative water management solutions.
Key Drivers, Barriers & Challenges in Canada Infrastructure Market
Key Drivers: Government funding, population growth, urbanization, aging infrastructure, technological advancements (e.g., BIM, AI).
Challenges: Funding constraints, environmental regulations, skilled labor shortages, project delays, supply chain disruptions (impact on material costs estimated at xx% in 2024).
Emerging Opportunities in Canada Infrastructure Market
Emerging opportunities lie in areas such as smart city development, renewable energy integration, and sustainable infrastructure solutions. Growing adoption of digital technologies, increasing focus on resilience against climate change, and evolving regulatory landscapes present significant untapped market potential. Public-private partnerships (PPPs) will likely play a significant role in unlocking future growth.
Growth Accelerators in the Canada Infrastructure Market Industry
Long-term growth will be fueled by continued government investment in infrastructure, technological advancements that enhance efficiency and sustainability, and the increasing adoption of innovative construction methods. Strategic partnerships between public and private sector entities will play a crucial role in accelerating project development and market expansion.
Key Players Shaping the Canada Infrastructure Market Market
- Aecon Group Inc
- EllisDon Construction and Building Services
- Morrison Hershfield
- Dufferin Construction
- Kiewit Corporation
- Pomerleau
- Chandos Construction
- Bantrel
- Bird Construction
- PCL Construction
Notable Milestones in Canda Infrastructure Market Sector
- September 2022: Enbridge acquires Tri Global for 270 Million USD, expanding its renewable energy portfolio.
- September 2022: WSP acquires John Wood Group's E&I business, strengthening its position in ecological and water sectors.
In-Depth Canada Infrastructure Market Outlook
The Canadian infrastructure market is poised for continued growth over the forecast period, driven by sustained government investment, technological innovation, and a growing focus on sustainable and resilient infrastructure. Strategic partnerships, investment in advanced technologies, and effective risk management will be crucial for maximizing market opportunities.
Canda Infrastructure Market Segmentation
-
1. Infrastructure Segment
-
1.1. Social Infrastructure
- 1.1.1. Schools
- 1.1.2. Hospitals
- 1.1.3. Defense
- 1.1.4. Other Social Infrastructures
-
1.2. Transportation Infrastructure
- 1.2.1. Railways
- 1.2.2. Roadways
- 1.2.3. Airport
- 1.2.4. Waterways
-
1.3. Extraction Infrastructure
- 1.3.1. Power Generation
- 1.3.2. Electricity Transmission and Distribution
- 1.3.3. Gas
- 1.3.4. Telecom
-
1.4. Manufacturing Infrastructure
- 1.4.1. Metal and Ore Production
- 1.4.2. Petroleum Refining
- 1.4.3. Chemical Manufacturing
- 1.4.4. Industrial Parks and clusters
- 1.4.5. Other Manufacturing Infrastructures
-
1.1. Social Infrastructure
Canda Infrastructure Market Segmentation By Geography
-
1. North America
- 1.1. United States
- 1.2. Canada
- 1.3. Mexico
-
2. South America
- 2.1. Brazil
- 2.2. Argentina
- 2.3. Rest of South America
-
3. Europe
- 3.1. United Kingdom
- 3.2. Germany
- 3.3. France
- 3.4. Italy
- 3.5. Spain
- 3.6. Russia
- 3.7. Benelux
- 3.8. Nordics
- 3.9. Rest of Europe
-
4. Middle East & Africa
- 4.1. Turkey
- 4.2. Israel
- 4.3. GCC
- 4.4. North Africa
- 4.5. South Africa
- 4.6. Rest of Middle East & Africa
-
5. Asia Pacific
- 5.1. China
- 5.2. India
- 5.3. Japan
- 5.4. South Korea
- 5.5. ASEAN
- 5.6. Oceania
- 5.7. Rest of Asia Pacific
Canda Infrastructure Market REPORT HIGHLIGHTS
| Aspects | Details |
|---|---|
| Study Period | 2019-2033 |
| Base Year | 2024 |
| Estimated Year | 2025 |
| Forecast Period | 2025-2033 |
| Historical Period | 2019-2024 |
| Growth Rate | CAGR of > 4.00% from 2019-2033 |
| Segmentation |
|
Table of Contents
- 1. Introduction
- 1.1. Research Scope
- 1.2. Market Segmentation
- 1.3. Research Methodology
- 1.4. Definitions and Assumptions
- 2. Executive Summary
- 2.1. Introduction
- 3. Market Dynamics
- 3.1. Introduction
- 3.2. Market Drivers
- 3.2.1. Increasing Investment in Infrastructure Projects; The rising popularity of sustainable architecture
- 3.3. Market Restrains
- 3.3.1. Volatility in Raw material prices
- 3.4. Market Trends
- 3.4.1. Growth in Transportation Infrastructure
- 4. Market Factor Analysis
- 4.1. Porters Five Forces
- 4.2. Supply/Value Chain
- 4.3. PESTEL analysis
- 4.4. Market Entropy
- 4.5. Patent/Trademark Analysis
- 5. Global Canda Infrastructure Market Analysis, Insights and Forecast, 2019-2031
- 5.1. Market Analysis, Insights and Forecast - by Infrastructure Segment
- 5.1.1. Social Infrastructure
- 5.1.1.1. Schools
- 5.1.1.2. Hospitals
- 5.1.1.3. Defense
- 5.1.1.4. Other Social Infrastructures
- 5.1.2. Transportation Infrastructure
- 5.1.2.1. Railways
- 5.1.2.2. Roadways
- 5.1.2.3. Airport
- 5.1.2.4. Waterways
- 5.1.3. Extraction Infrastructure
- 5.1.3.1. Power Generation
- 5.1.3.2. Electricity Transmission and Distribution
- 5.1.3.3. Gas
- 5.1.3.4. Telecom
- 5.1.4. Manufacturing Infrastructure
- 5.1.4.1. Metal and Ore Production
- 5.1.4.2. Petroleum Refining
- 5.1.4.3. Chemical Manufacturing
- 5.1.4.4. Industrial Parks and clusters
- 5.1.4.5. Other Manufacturing Infrastructures
- 5.1.1. Social Infrastructure
- 5.2. Market Analysis, Insights and Forecast - by Region
- 5.2.1. North America
- 5.2.2. South America
- 5.2.3. Europe
- 5.2.4. Middle East & Africa
- 5.2.5. Asia Pacific
- 5.1. Market Analysis, Insights and Forecast - by Infrastructure Segment
- 6. North America Canda Infrastructure Market Analysis, Insights and Forecast, 2019-2031
- 6.1. Market Analysis, Insights and Forecast - by Infrastructure Segment
- 6.1.1. Social Infrastructure
- 6.1.1.1. Schools
- 6.1.1.2. Hospitals
- 6.1.1.3. Defense
- 6.1.1.4. Other Social Infrastructures
- 6.1.2. Transportation Infrastructure
- 6.1.2.1. Railways
- 6.1.2.2. Roadways
- 6.1.2.3. Airport
- 6.1.2.4. Waterways
- 6.1.3. Extraction Infrastructure
- 6.1.3.1. Power Generation
- 6.1.3.2. Electricity Transmission and Distribution
- 6.1.3.3. Gas
- 6.1.3.4. Telecom
- 6.1.4. Manufacturing Infrastructure
- 6.1.4.1. Metal and Ore Production
- 6.1.4.2. Petroleum Refining
- 6.1.4.3. Chemical Manufacturing
- 6.1.4.4. Industrial Parks and clusters
- 6.1.4.5. Other Manufacturing Infrastructures
- 6.1.1. Social Infrastructure
- 6.1. Market Analysis, Insights and Forecast - by Infrastructure Segment
- 7. South America Canda Infrastructure Market Analysis, Insights and Forecast, 2019-2031
- 7.1. Market Analysis, Insights and Forecast - by Infrastructure Segment
- 7.1.1. Social Infrastructure
- 7.1.1.1. Schools
- 7.1.1.2. Hospitals
- 7.1.1.3. Defense
- 7.1.1.4. Other Social Infrastructures
- 7.1.2. Transportation Infrastructure
- 7.1.2.1. Railways
- 7.1.2.2. Roadways
- 7.1.2.3. Airport
- 7.1.2.4. Waterways
- 7.1.3. Extraction Infrastructure
- 7.1.3.1. Power Generation
- 7.1.3.2. Electricity Transmission and Distribution
- 7.1.3.3. Gas
- 7.1.3.4. Telecom
- 7.1.4. Manufacturing Infrastructure
- 7.1.4.1. Metal and Ore Production
- 7.1.4.2. Petroleum Refining
- 7.1.4.3. Chemical Manufacturing
- 7.1.4.4. Industrial Parks and clusters
- 7.1.4.5. Other Manufacturing Infrastructures
- 7.1.1. Social Infrastructure
- 7.1. Market Analysis, Insights and Forecast - by Infrastructure Segment
- 8. Europe Canda Infrastructure Market Analysis, Insights and Forecast, 2019-2031
- 8.1. Market Analysis, Insights and Forecast - by Infrastructure Segment
- 8.1.1. Social Infrastructure
- 8.1.1.1. Schools
- 8.1.1.2. Hospitals
- 8.1.1.3. Defense
- 8.1.1.4. Other Social Infrastructures
- 8.1.2. Transportation Infrastructure
- 8.1.2.1. Railways
- 8.1.2.2. Roadways
- 8.1.2.3. Airport
- 8.1.2.4. Waterways
- 8.1.3. Extraction Infrastructure
- 8.1.3.1. Power Generation
- 8.1.3.2. Electricity Transmission and Distribution
- 8.1.3.3. Gas
- 8.1.3.4. Telecom
- 8.1.4. Manufacturing Infrastructure
- 8.1.4.1. Metal and Ore Production
- 8.1.4.2. Petroleum Refining
- 8.1.4.3. Chemical Manufacturing
- 8.1.4.4. Industrial Parks and clusters
- 8.1.4.5. Other Manufacturing Infrastructures
- 8.1.1. Social Infrastructure
- 8.1. Market Analysis, Insights and Forecast - by Infrastructure Segment
- 9. Middle East & Africa Canda Infrastructure Market Analysis, Insights and Forecast, 2019-2031
- 9.1. Market Analysis, Insights and Forecast - by Infrastructure Segment
- 9.1.1. Social Infrastructure
- 9.1.1.1. Schools
- 9.1.1.2. Hospitals
- 9.1.1.3. Defense
- 9.1.1.4. Other Social Infrastructures
- 9.1.2. Transportation Infrastructure
- 9.1.2.1. Railways
- 9.1.2.2. Roadways
- 9.1.2.3. Airport
- 9.1.2.4. Waterways
- 9.1.3. Extraction Infrastructure
- 9.1.3.1. Power Generation
- 9.1.3.2. Electricity Transmission and Distribution
- 9.1.3.3. Gas
- 9.1.3.4. Telecom
- 9.1.4. Manufacturing Infrastructure
- 9.1.4.1. Metal and Ore Production
- 9.1.4.2. Petroleum Refining
- 9.1.4.3. Chemical Manufacturing
- 9.1.4.4. Industrial Parks and clusters
- 9.1.4.5. Other Manufacturing Infrastructures
- 9.1.1. Social Infrastructure
- 9.1. Market Analysis, Insights and Forecast - by Infrastructure Segment
- 10. Asia Pacific Canda Infrastructure Market Analysis, Insights and Forecast, 2019-2031
- 10.1. Market Analysis, Insights and Forecast - by Infrastructure Segment
- 10.1.1. Social Infrastructure
- 10.1.1.1. Schools
- 10.1.1.2. Hospitals
- 10.1.1.3. Defense
- 10.1.1.4. Other Social Infrastructures
- 10.1.2. Transportation Infrastructure
- 10.1.2.1. Railways
- 10.1.2.2. Roadways
- 10.1.2.3. Airport
- 10.1.2.4. Waterways
- 10.1.3. Extraction Infrastructure
- 10.1.3.1. Power Generation
- 10.1.3.2. Electricity Transmission and Distribution
- 10.1.3.3. Gas
- 10.1.3.4. Telecom
- 10.1.4. Manufacturing Infrastructure
- 10.1.4.1. Metal and Ore Production
- 10.1.4.2. Petroleum Refining
- 10.1.4.3. Chemical Manufacturing
- 10.1.4.4. Industrial Parks and clusters
- 10.1.4.5. Other Manufacturing Infrastructures
- 10.1.1. Social Infrastructure
- 10.1. Market Analysis, Insights and Forecast - by Infrastructure Segment
- 11. Competitive Analysis
- 11.1. Global Market Share Analysis 2024
- 11.2. Company Profiles
- 11.2.1 Aecon Group Inc
- 11.2.1.1. Overview
- 11.2.1.2. Products
- 11.2.1.3. SWOT Analysis
- 11.2.1.4. Recent Developments
- 11.2.1.5. Financials (Based on Availability)
- 11.2.2 EllisDon Construction and Building Services
- 11.2.2.1. Overview
- 11.2.2.2. Products
- 11.2.2.3. SWOT Analysis
- 11.2.2.4. Recent Developments
- 11.2.2.5. Financials (Based on Availability)
- 11.2.3 Morrison Hershfield**List Not Exhaustive
- 11.2.3.1. Overview
- 11.2.3.2. Products
- 11.2.3.3. SWOT Analysis
- 11.2.3.4. Recent Developments
- 11.2.3.5. Financials (Based on Availability)
- 11.2.4 Dufferin Construction
- 11.2.4.1. Overview
- 11.2.4.2. Products
- 11.2.4.3. SWOT Analysis
- 11.2.4.4. Recent Developments
- 11.2.4.5. Financials (Based on Availability)
- 11.2.5 Kiewit Corporation
- 11.2.5.1. Overview
- 11.2.5.2. Products
- 11.2.5.3. SWOT Analysis
- 11.2.5.4. Recent Developments
- 11.2.5.5. Financials (Based on Availability)
- 11.2.6 Pomerleau
- 11.2.6.1. Overview
- 11.2.6.2. Products
- 11.2.6.3. SWOT Analysis
- 11.2.6.4. Recent Developments
- 11.2.6.5. Financials (Based on Availability)
- 11.2.7 Chandos Construction
- 11.2.7.1. Overview
- 11.2.7.2. Products
- 11.2.7.3. SWOT Analysis
- 11.2.7.4. Recent Developments
- 11.2.7.5. Financials (Based on Availability)
- 11.2.8 Bantrel
- 11.2.8.1. Overview
- 11.2.8.2. Products
- 11.2.8.3. SWOT Analysis
- 11.2.8.4. Recent Developments
- 11.2.8.5. Financials (Based on Availability)
- 11.2.9 Bird Construction
- 11.2.9.1. Overview
- 11.2.9.2. Products
- 11.2.9.3. SWOT Analysis
- 11.2.9.4. Recent Developments
- 11.2.9.5. Financials (Based on Availability)
- 11.2.10 PCL Construction
- 11.2.10.1. Overview
- 11.2.10.2. Products
- 11.2.10.3. SWOT Analysis
- 11.2.10.4. Recent Developments
- 11.2.10.5. Financials (Based on Availability)
- 11.2.1 Aecon Group Inc
List of Figures
- Figure 1: Global Canda Infrastructure Market Revenue Breakdown (Million, %) by Region 2024 & 2032
- Figure 2: North America Canda Infrastructure Market Revenue (Million), by Infrastructure Segment 2024 & 2032
- Figure 3: North America Canda Infrastructure Market Revenue Share (%), by Infrastructure Segment 2024 & 2032
- Figure 4: North America Canda Infrastructure Market Revenue (Million), by Country 2024 & 2032
- Figure 5: North America Canda Infrastructure Market Revenue Share (%), by Country 2024 & 2032
- Figure 6: South America Canda Infrastructure Market Revenue (Million), by Infrastructure Segment 2024 & 2032
- Figure 7: South America Canda Infrastructure Market Revenue Share (%), by Infrastructure Segment 2024 & 2032
- Figure 8: South America Canda Infrastructure Market Revenue (Million), by Country 2024 & 2032
- Figure 9: South America Canda Infrastructure Market Revenue Share (%), by Country 2024 & 2032
- Figure 10: Europe Canda Infrastructure Market Revenue (Million), by Infrastructure Segment 2024 & 2032
- Figure 11: Europe Canda Infrastructure Market Revenue Share (%), by Infrastructure Segment 2024 & 2032
- Figure 12: Europe Canda Infrastructure Market Revenue (Million), by Country 2024 & 2032
- Figure 13: Europe Canda Infrastructure Market Revenue Share (%), by Country 2024 & 2032
- Figure 14: Middle East & Africa Canda Infrastructure Market Revenue (Million), by Infrastructure Segment 2024 & 2032
- Figure 15: Middle East & Africa Canda Infrastructure Market Revenue Share (%), by Infrastructure Segment 2024 & 2032
- Figure 16: Middle East & Africa Canda Infrastructure Market Revenue (Million), by Country 2024 & 2032
- Figure 17: Middle East & Africa Canda Infrastructure Market Revenue Share (%), by Country 2024 & 2032
- Figure 18: Asia Pacific Canda Infrastructure Market Revenue (Million), by Infrastructure Segment 2024 & 2032
- Figure 19: Asia Pacific Canda Infrastructure Market Revenue Share (%), by Infrastructure Segment 2024 & 2032
- Figure 20: Asia Pacific Canda Infrastructure Market Revenue (Million), by Country 2024 & 2032
- Figure 21: Asia Pacific Canda Infrastructure Market Revenue Share (%), by Country 2024 & 2032
List of Tables
- Table 1: Global Canda Infrastructure Market Revenue Million Forecast, by Region 2019 & 2032
- Table 2: Global Canda Infrastructure Market Revenue Million Forecast, by Infrastructure Segment 2019 & 2032
- Table 3: Global Canda Infrastructure Market Revenue Million Forecast, by Region 2019 & 2032
- Table 4: Global Canda Infrastructure Market Revenue Million Forecast, by Infrastructure Segment 2019 & 2032
- Table 5: Global Canda Infrastructure Market Revenue Million Forecast, by Country 2019 & 2032
- Table 6: United States Canda Infrastructure Market Revenue (Million) Forecast, by Application 2019 & 2032
- Table 7: Canada Canda Infrastructure Market Revenue (Million) Forecast, by Application 2019 & 2032
- Table 8: Mexico Canda Infrastructure Market Revenue (Million) Forecast, by Application 2019 & 2032
- Table 9: Global Canda Infrastructure Market Revenue Million Forecast, by Infrastructure Segment 2019 & 2032
- Table 10: Global Canda Infrastructure Market Revenue Million Forecast, by Country 2019 & 2032
- Table 11: Brazil Canda Infrastructure Market Revenue (Million) Forecast, by Application 2019 & 2032
- Table 12: Argentina Canda Infrastructure Market Revenue (Million) Forecast, by Application 2019 & 2032
- Table 13: Rest of South America Canda Infrastructure Market Revenue (Million) Forecast, by Application 2019 & 2032
- Table 14: Global Canda Infrastructure Market Revenue Million Forecast, by Infrastructure Segment 2019 & 2032
- Table 15: Global Canda Infrastructure Market Revenue Million Forecast, by Country 2019 & 2032
- Table 16: United Kingdom Canda Infrastructure Market Revenue (Million) Forecast, by Application 2019 & 2032
- Table 17: Germany Canda Infrastructure Market Revenue (Million) Forecast, by Application 2019 & 2032
- Table 18: France Canda Infrastructure Market Revenue (Million) Forecast, by Application 2019 & 2032
- Table 19: Italy Canda Infrastructure Market Revenue (Million) Forecast, by Application 2019 & 2032
- Table 20: Spain Canda Infrastructure Market Revenue (Million) Forecast, by Application 2019 & 2032
- Table 21: Russia Canda Infrastructure Market Revenue (Million) Forecast, by Application 2019 & 2032
- Table 22: Benelux Canda Infrastructure Market Revenue (Million) Forecast, by Application 2019 & 2032
- Table 23: Nordics Canda Infrastructure Market Revenue (Million) Forecast, by Application 2019 & 2032
- Table 24: Rest of Europe Canda Infrastructure Market Revenue (Million) Forecast, by Application 2019 & 2032
- Table 25: Global Canda Infrastructure Market Revenue Million Forecast, by Infrastructure Segment 2019 & 2032
- Table 26: Global Canda Infrastructure Market Revenue Million Forecast, by Country 2019 & 2032
- Table 27: Turkey Canda Infrastructure Market Revenue (Million) Forecast, by Application 2019 & 2032
- Table 28: Israel Canda Infrastructure Market Revenue (Million) Forecast, by Application 2019 & 2032
- Table 29: GCC Canda Infrastructure Market Revenue (Million) Forecast, by Application 2019 & 2032
- Table 30: North Africa Canda Infrastructure Market Revenue (Million) Forecast, by Application 2019 & 2032
- Table 31: South Africa Canda Infrastructure Market Revenue (Million) Forecast, by Application 2019 & 2032
- Table 32: Rest of Middle East & Africa Canda Infrastructure Market Revenue (Million) Forecast, by Application 2019 & 2032
- Table 33: Global Canda Infrastructure Market Revenue Million Forecast, by Infrastructure Segment 2019 & 2032
- Table 34: Global Canda Infrastructure Market Revenue Million Forecast, by Country 2019 & 2032
- Table 35: China Canda Infrastructure Market Revenue (Million) Forecast, by Application 2019 & 2032
- Table 36: India Canda Infrastructure Market Revenue (Million) Forecast, by Application 2019 & 2032
- Table 37: Japan Canda Infrastructure Market Revenue (Million) Forecast, by Application 2019 & 2032
- Table 38: South Korea Canda Infrastructure Market Revenue (Million) Forecast, by Application 2019 & 2032
- Table 39: ASEAN Canda Infrastructure Market Revenue (Million) Forecast, by Application 2019 & 2032
- Table 40: Oceania Canda Infrastructure Market Revenue (Million) Forecast, by Application 2019 & 2032
- Table 41: Rest of Asia Pacific Canda Infrastructure Market Revenue (Million) Forecast, by Application 2019 & 2032
Frequently Asked Questions
1. What is the projected Compound Annual Growth Rate (CAGR) of the Canda Infrastructure Market?
The projected CAGR is approximately > 4.00%.
2. Which companies are prominent players in the Canda Infrastructure Market?
Key companies in the market include Aecon Group Inc, EllisDon Construction and Building Services, Morrison Hershfield**List Not Exhaustive, Dufferin Construction, Kiewit Corporation, Pomerleau, Chandos Construction, Bantrel, Bird Construction, PCL Construction.
3. What are the main segments of the Canda Infrastructure Market?
The market segments include Infrastructure Segment.
4. Can you provide details about the market size?
The market size is estimated to be USD XX Million as of 2022.
5. What are some drivers contributing to market growth?
Increasing Investment in Infrastructure Projects; The rising popularity of sustainable architecture.
6. What are the notable trends driving market growth?
Growth in Transportation Infrastructure.
7. Are there any restraints impacting market growth?
Volatility in Raw material prices.
8. Can you provide examples of recent developments in the market?
September 2022: Canada's Enbridge acquired U.S.-based renewable energy developer Green Power Provider Tri Global for 270 Million dollars. The deal strengthens Enbridge's renewables portfolio, including offshore wind farms in Europe and solar projects supplying power to its oil and gas pipelines in North America.
9. What pricing options are available for accessing the report?
Pricing options include single-user, multi-user, and enterprise licenses priced at USD 3800, USD 4500, and USD 5800 respectively.
10. Is the market size provided in terms of value or volume?
The market size is provided in terms of value, measured in Million.
11. Are there any specific market keywords associated with the report?
Yes, the market keyword associated with the report is "Canda Infrastructure Market," which aids in identifying and referencing the specific market segment covered.
12. How do I determine which pricing option suits my needs best?
The pricing options vary based on user requirements and access needs. Individual users may opt for single-user licenses, while businesses requiring broader access may choose multi-user or enterprise licenses for cost-effective access to the report.
13. Are there any additional resources or data provided in the Canda Infrastructure Market report?
While the report offers comprehensive insights, it's advisable to review the specific contents or supplementary materials provided to ascertain if additional resources or data are available.
14. How can I stay updated on further developments or reports in the Canda Infrastructure Market?
To stay informed about further developments, trends, and reports in the Canda Infrastructure Market, consider subscribing to industry newsletters, following relevant companies and organizations, or regularly checking reputable industry news sources and publications.
Methodology
Step 1 - Identification of Relevant Samples Size from Population Database


Step 2 - Approaches for Defining Global Market Size (Value, Volume* & Price*)

Note*: In applicable scenarios
Step 3 - Data Sources
Primary Research
- Web Analytics
- Survey Reports
- Research Institute
- Latest Research Reports
- Opinion Leaders
Secondary Research
- Annual Reports
- White Paper
- Latest Press Release
- Industry Association
- Paid Database
- Investor Presentations

Step 4 - Data Triangulation
Involves using different sources of information in order to increase the validity of a study
These sources are likely to be stakeholders in a program - participants, other researchers, program staff, other community members, and so on.
Then we put all data in single framework & apply various statistical tools to find out the dynamic on the market.
During the analysis stage, feedback from the stakeholder groups would be compared to determine areas of agreement as well as areas of divergence
