

Key Insights
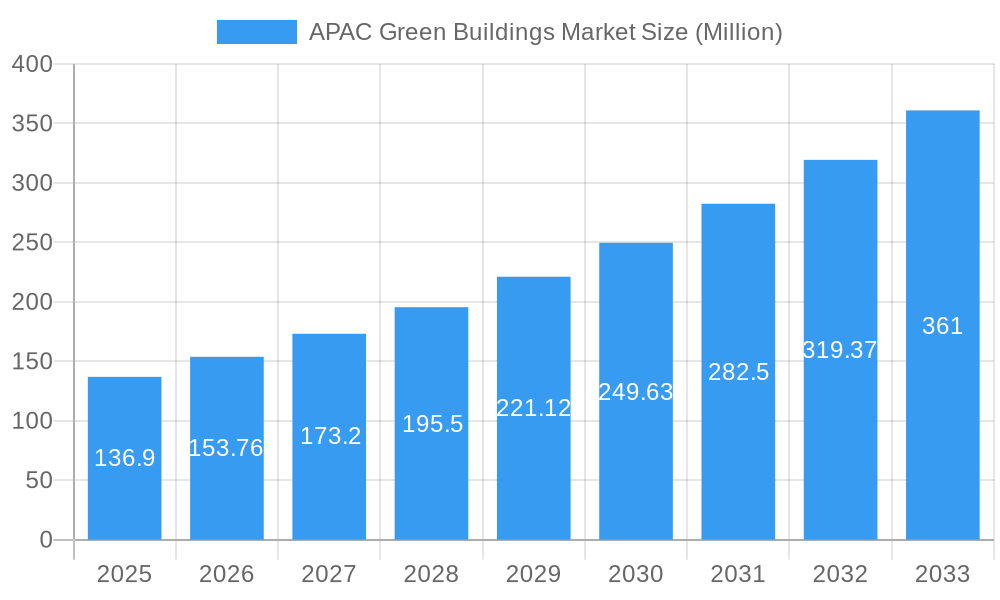
The APAC green buildings market is experiencing robust growth, projected to reach a market size of $136.90 million in 2025 and maintain a Compound Annual Growth Rate (CAGR) of 12.23% from 2025 to 2033. This expansion is driven by several key factors. Increasing government regulations promoting sustainable construction practices across countries like China, Japan, India, and Australia are significant contributors. Furthermore, heightened corporate social responsibility (CSR) initiatives among businesses are fueling demand for environmentally friendly office spaces and retail establishments. Rising consumer awareness of the environmental impact of buildings and a preference for energy-efficient homes are also boosting the residential segment. Technological advancements in green building materials and construction techniques, offering cost-effective and efficient solutions, further propel market growth. The market is segmented by product type (exterior, interior, and others including building and solar systems) and end-user (residential, office, retail, institutional, and others). Major players like Keppel Land, CapitaLand, Shimizu Corporation, and Lendlease are actively shaping the market landscape through innovative projects and strategic partnerships.
APAC Green Buildings Market Market Size (In Million)
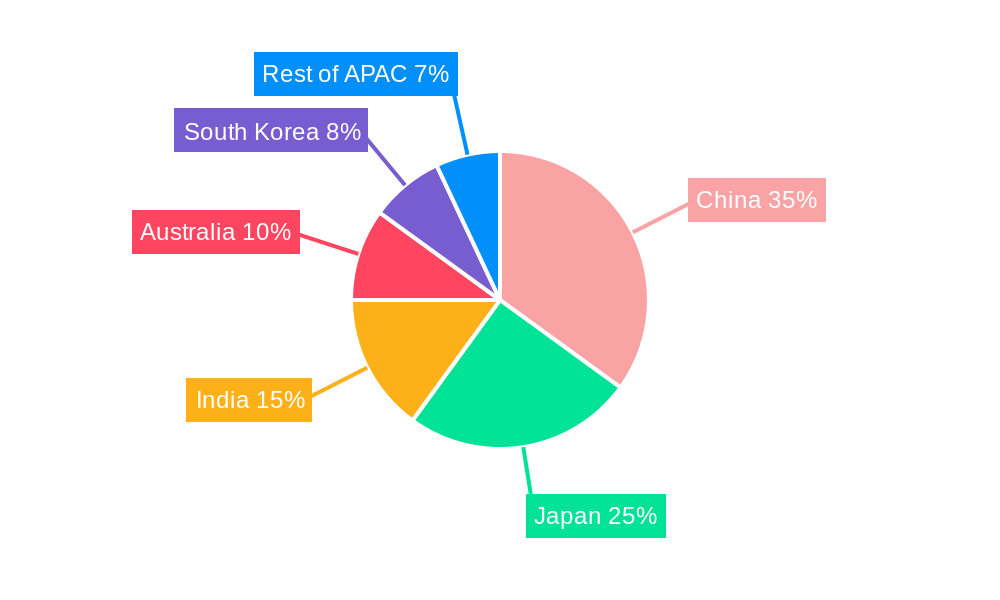
The continued growth trajectory is anticipated to be influenced by several trends. The integration of smart technologies within green buildings is expected to increase efficiency and reduce operational costs, driving further adoption. The growing emphasis on achieving net-zero carbon emissions across the built environment will significantly impact the demand for sustainable solutions. However, challenges remain, such as the higher initial investment costs associated with green building construction and the scarcity of skilled labor specialized in green building technologies. Overcoming these restraints will be crucial for sustained market expansion. While specific regional data for China, Japan, India, Australia, South Korea, and the Rest of APAC is unavailable, we can infer that China and Japan, given their advanced economies and stringent environmental regulations, are likely to command a larger market share than other nations in the region. The robust growth across the entire APAC region reflects a positive outlook for the foreseeable future.
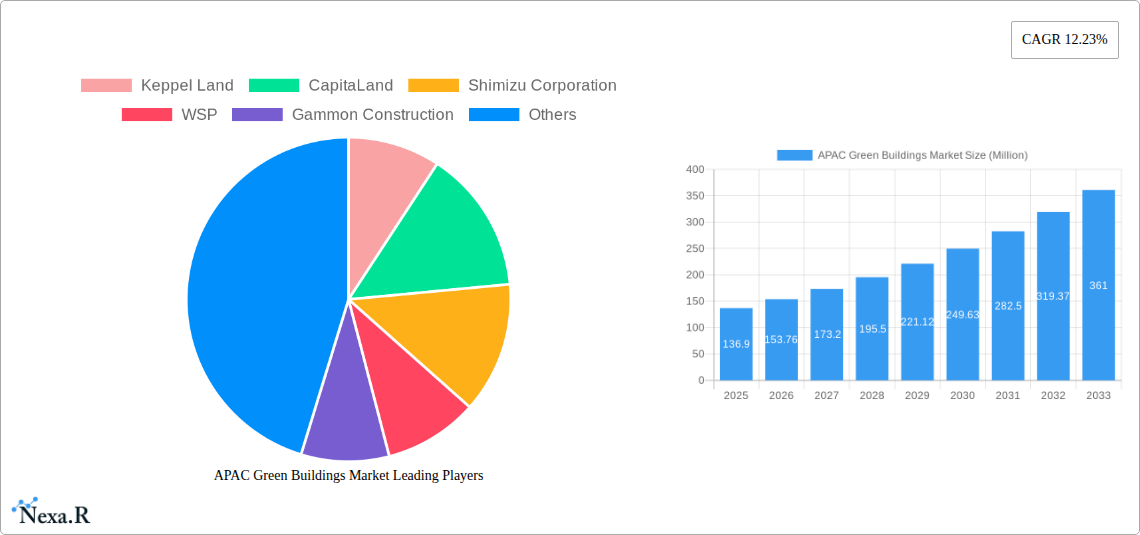
APAC Green Buildings Market Company Market Share
APAC Green Buildings Market: A Comprehensive Report (2019-2033)
This in-depth report provides a comprehensive analysis of the Asia-Pacific (APAC) green buildings market, offering invaluable insights for industry professionals, investors, and policymakers. The report covers the period from 2019 to 2033, with a focus on market dynamics, growth trends, key players, and future opportunities. The market is segmented by product (exterior, interior, and other products including building systems and solar systems) and end-user (residential, office, retail, institutional, and other). The total market value is projected to reach xx Million by 2033.
Study Period: 2019-2033 Base Year: 2025 Estimated Year: 2025 Forecast Period: 2025-2033 Historical Period: 2019-2024
APAC Green Buildings Market Dynamics & Structure
The APAC green buildings market is characterized by increasing market concentration, driven by the expansion of large multinational players and mergers & acquisitions (M&A) activity. Technological innovation, particularly in building materials and energy efficiency solutions, is a key growth driver. Stringent government regulations and incentives promoting sustainable construction further fuel market expansion. Competitive substitutes, such as traditional construction methods, are facing increasing pressure due to rising environmental concerns and cost-effectiveness of green building solutions. End-user demographics, including a growing middle class and increasing urbanization, are driving demand for sustainable housing and commercial spaces.
- Market Concentration: High, with a few major players holding significant market share (xx%).
- Technological Innovation: Rapid advancements in materials, energy-efficient systems, and smart building technologies.
- Regulatory Framework: Increasingly stringent environmental regulations and government incentives promoting green building adoption.
- M&A Activity: A significant number of mergers and acquisitions in recent years, estimated at xx deals between 2019 and 2024.
- Innovation Barriers: High initial investment costs, lack of awareness, and skills gap in green building technologies.
APAC Green Buildings Market Growth Trends & Insights
The APAC green buildings market has witnessed significant growth over the past few years and is projected to continue its upward trajectory. Driven by rising environmental awareness, government support, and technological advancements, the market's CAGR is estimated at xx% during the forecast period (2025-2033). Increased adoption rates across various end-user segments, particularly in the residential and commercial sectors, are contributing to market expansion. Disruptive technologies such as Building Information Modeling (BIM) and Internet of Things (IoT) applications are further enhancing efficiency and sustainability. Shifting consumer preferences towards environmentally friendly and energy-efficient buildings are also crucial factors. Market penetration is expected to reach xx% by 2033, showcasing substantial market growth.
Dominant Regions, Countries, or Segments in APAC Green Buildings Market
China, Singapore, and Australia are leading the APAC green buildings market, driven by strong government support, robust economic growth, and high levels of environmental awareness. Within product segments, the demand for exterior products is high due to the need for sustainable facades and improved energy efficiency. The residential segment is showing significant growth potential due to increasing urbanization and middle-class expansion.
- China: Strong government policies and massive infrastructure development drive high growth.
- Singapore: High adoption of green building standards and a focus on sustainable urban development.
- Australia: Stringent environmental regulations and strong public awareness contribute to market growth.
- Exterior Products: Highest market share driven by the need for energy-efficient facades and sustainable materials.
- Residential Segment: Fastest-growing end-user segment due to increasing urbanization and demand for eco-friendly housing.
APAP Green Buildings Market Product Landscape
The APAP green building market showcases a diverse range of innovative products designed to enhance sustainability and energy efficiency. Advancements in materials science have led to the development of eco-friendly building materials, such as recycled content concrete and timber, reducing the environmental impact of construction. Energy-efficient windows and insulation systems play a key role in minimizing energy consumption. Smart building technologies, such as IoT-enabled sensors and energy management systems, provide real-time data and optimize energy usage. These products demonstrate unique selling propositions that focus on both cost-effectiveness and sustainability.
Key Drivers, Barriers & Challenges in APAC Green Buildings Market
Key Drivers:
- Stringent government regulations and incentives.
- Growing environmental awareness among consumers and businesses.
- Technological advancements in sustainable building materials and technologies.
- Increasing urbanization and the need for sustainable infrastructure.
Challenges & Restraints:
- High initial investment costs associated with green building technologies.
- Lack of skilled labor and expertise in green building construction.
- Supply chain disruptions impacting the availability of sustainable materials.
- Regulatory complexities and inconsistent enforcement across different regions.
Emerging Opportunities in APAP Green Buildings Market
Significant opportunities exist in the APAC green buildings market, particularly in untapped markets with increasing urbanization and demand for eco-friendly housing and commercial spaces. Innovative applications of green building technologies in emerging sectors, such as renewable energy integration and smart city development, present further growth potential. Evolving consumer preferences toward healthier and more sustainable living spaces are shaping future demand.
Growth Accelerators in the APAC Green Buildings Market Industry
Technological breakthroughs, such as advancements in renewable energy technologies and smart building systems, are key growth accelerators. Strategic partnerships between construction firms, technology providers, and government agencies are fostering innovation and market expansion. Increased government investment in green building infrastructure and initiatives are driving market growth.
Key Players Shaping the APAC Green Buildings Market Market
- Keppel Land
- CapitaLand
- Shimizu Corporation
- WSP
- Gammon Construction
- Obayashi Corporation
- Sun Hung Kai Properties
- 7 3 Other Companies
- Lendlease
- Swire Properties
- Sino Group
Notable Milestones in APAC Green Buildings Market Sector
- April 2023: Starbucks unveils its first greener stores in Singapore, Thailand, and Vietnam, signaling increased corporate commitment to sustainability in the APAC region. This initiative is expected to significantly impact consumer demand for green buildings.
- February 2023: GHD's partnership with the GBCA demonstrates increased industry collaboration and commitment to circular economy principles within the green building sector. This is likely to improve sustainability practices across the industry.
In-Depth APAC Green Buildings Market Outlook
The APAC green buildings market is poised for sustained growth driven by technological advancements, favorable government policies, and increasing consumer demand for sustainable living spaces. Strategic opportunities lie in developing innovative green building solutions tailored to specific regional needs and expanding into underserved markets. The continued adoption of sustainable construction practices will contribute to a greener and more resilient built environment across the APAC region.
APAC Green Buildings Market Segmentation
-
1. Product
- 1.1. Exterior Products
- 1.2. Interior products
- 1.3. Other Pr
-
2. End User
- 2.1. Residential
- 2.2. Office
- 2.3. Retail
- 2.4. Institutional
- 2.5. Other End Users
-
3. Geography
- 3.1. China
- 3.2. Japan
- 3.3. India
- 3.4. Australia
- 3.5. South Korea
- 3.6. Rest of APAC
APAC Green Buildings Market Segmentation By Geography
- 1. China
- 2. Japan
- 3. India
- 4. Australia
- 5. South Korea
- 6. Rest of APAC
APAC Green Buildings Market Regional Market Share
Geographic Coverage of APAC Green Buildings Market
APAC Green Buildings Market REPORT HIGHLIGHTS
| Aspects | Details |
|---|---|
| Study Period | 2020-2034 |
| Base Year | 2025 |
| Estimated Year | 2026 |
| Forecast Period | 2026-2034 |
| Historical Period | 2020-2025 |
| Growth Rate | CAGR of 12.23% from 2020-2034 |
| Segmentation |
|
Table of Contents
- 1. Introduction
- 1.1. Research Scope
- 1.2. Market Segmentation
- 1.3. Research Objective
- 1.4. Definitions and Assumptions
- 2. Executive Summary
- 2.1. Market Snapshot
- 3. Market Dynamics
- 3.1. Market Drivers
- 3.2. Market Restrains
- 3.3. Market Trends
- 3.4. Market Opportunities
- 4. Market Factor Analysis
- 4.1. Porters Five Forces
- 4.1.1. Bargaining Power of Suppliers
- 4.1.2. Bargaining Power of Buyers
- 4.1.3. Threat of New Entrants
- 4.1.4. Threat of Substitutes
- 4.1.5. Competitive Rivalry
- 4.2. PESTEL analysis
- 4.3. BCG Analysis
- 4.3.1. Stars (High Growth, High Market Share)
- 4.3.2. Cash Cows (Low Growth, High Market Share)
- 4.3.3. Question Mark (High Growth, Low Market Share)
- 4.3.4. Dogs (Low Growth, Low Market Share)
- 4.4. Ansoff Matrix Analysis
- 4.5. Supply Chain Analysis
- 4.6. Regulatory Landscape
- 4.7. Current Market Potential and Opportunity Assessment (TAM–SAM–SOM Framework)
- 4.8. NRP Analyst Note
- 4.1. Porters Five Forces
- 5. Market Analysis, Insights and Forecast 2021-2033
- 5.1. Market Analysis, Insights and Forecast - by Product
- 5.1.1. Exterior Products
- 5.1.2. Interior products
- 5.1.3. Other Pr
- 5.2. Market Analysis, Insights and Forecast - by End User
- 5.2.1. Residential
- 5.2.2. Office
- 5.2.3. Retail
- 5.2.4. Institutional
- 5.2.5. Other End Users
- 5.3. Market Analysis, Insights and Forecast - by Geography
- 5.3.1. China
- 5.3.2. Japan
- 5.3.3. India
- 5.3.4. Australia
- 5.3.5. South Korea
- 5.3.6. Rest of APAC
- 5.4. Market Analysis, Insights and Forecast - by Region
- 5.4.1. China
- 5.4.2. Japan
- 5.4.3. India
- 5.4.4. Australia
- 5.4.5. South Korea
- 5.4.6. Rest of APAC
- 5.1. Market Analysis, Insights and Forecast - by Product
- 6. Global APAC Green Buildings Market Analysis, Insights and Forecast, 2021-2033
- 6.1. Market Analysis, Insights and Forecast - by Product
- 6.1.1. Exterior Products
- 6.1.2. Interior products
- 6.1.3. Other Pr
- 6.2. Market Analysis, Insights and Forecast - by End User
- 6.2.1. Residential
- 6.2.2. Office
- 6.2.3. Retail
- 6.2.4. Institutional
- 6.2.5. Other End Users
- 6.3. Market Analysis, Insights and Forecast - by Geography
- 6.3.1. China
- 6.3.2. Japan
- 6.3.3. India
- 6.3.4. Australia
- 6.3.5. South Korea
- 6.3.6. Rest of APAC
- 6.1. Market Analysis, Insights and Forecast - by Product
- 7. China APAC Green Buildings Market Analysis, Insights and Forecast, 2020-2032
- 7.1. Market Analysis, Insights and Forecast - by Product
- 7.1.1. Exterior Products
- 7.1.2. Interior products
- 7.1.3. Other Pr
- 7.2. Market Analysis, Insights and Forecast - by End User
- 7.2.1. Residential
- 7.2.2. Office
- 7.2.3. Retail
- 7.2.4. Institutional
- 7.2.5. Other End Users
- 7.3. Market Analysis, Insights and Forecast - by Geography
- 7.3.1. China
- 7.3.2. Japan
- 7.3.3. India
- 7.3.4. Australia
- 7.3.5. South Korea
- 7.3.6. Rest of APAC
- 7.1. Market Analysis, Insights and Forecast - by Product
- 8. Japan APAC Green Buildings Market Analysis, Insights and Forecast, 2020-2032
- 8.1. Market Analysis, Insights and Forecast - by Product
- 8.1.1. Exterior Products
- 8.1.2. Interior products
- 8.1.3. Other Pr
- 8.2. Market Analysis, Insights and Forecast - by End User
- 8.2.1. Residential
- 8.2.2. Office
- 8.2.3. Retail
- 8.2.4. Institutional
- 8.2.5. Other End Users
- 8.3. Market Analysis, Insights and Forecast - by Geography
- 8.3.1. China
- 8.3.2. Japan
- 8.3.3. India
- 8.3.4. Australia
- 8.3.5. South Korea
- 8.3.6. Rest of APAC
- 8.1. Market Analysis, Insights and Forecast - by Product
- 9. India APAC Green Buildings Market Analysis, Insights and Forecast, 2020-2032
- 9.1. Market Analysis, Insights and Forecast - by Product
- 9.1.1. Exterior Products
- 9.1.2. Interior products
- 9.1.3. Other Pr
- 9.2. Market Analysis, Insights and Forecast - by End User
- 9.2.1. Residential
- 9.2.2. Office
- 9.2.3. Retail
- 9.2.4. Institutional
- 9.2.5. Other End Users
- 9.3. Market Analysis, Insights and Forecast - by Geography
- 9.3.1. China
- 9.3.2. Japan
- 9.3.3. India
- 9.3.4. Australia
- 9.3.5. South Korea
- 9.3.6. Rest of APAC
- 9.1. Market Analysis, Insights and Forecast - by Product
- 10. Australia APAC Green Buildings Market Analysis, Insights and Forecast, 2020-2032
- 10.1. Market Analysis, Insights and Forecast - by Product
- 10.1.1. Exterior Products
- 10.1.2. Interior products
- 10.1.3. Other Pr
- 10.2. Market Analysis, Insights and Forecast - by End User
- 10.2.1. Residential
- 10.2.2. Office
- 10.2.3. Retail
- 10.2.4. Institutional
- 10.2.5. Other End Users
- 10.3. Market Analysis, Insights and Forecast - by Geography
- 10.3.1. China
- 10.3.2. Japan
- 10.3.3. India
- 10.3.4. Australia
- 10.3.5. South Korea
- 10.3.6. Rest of APAC
- 10.1. Market Analysis, Insights and Forecast - by Product
- 11. South Korea APAC Green Buildings Market Analysis, Insights and Forecast, 2020-2032
- 11.1. Market Analysis, Insights and Forecast - by Product
- 11.1.1. Exterior Products
- 11.1.2. Interior products
- 11.1.3. Other Pr
- 11.2. Market Analysis, Insights and Forecast - by End User
- 11.2.1. Residential
- 11.2.2. Office
- 11.2.3. Retail
- 11.2.4. Institutional
- 11.2.5. Other End Users
- 11.3. Market Analysis, Insights and Forecast - by Geography
- 11.3.1. China
- 11.3.2. Japan
- 11.3.3. India
- 11.3.4. Australia
- 11.3.5. South Korea
- 11.3.6. Rest of APAC
- 11.1. Market Analysis, Insights and Forecast - by Product
- 12. Rest of APAC APAC Green Buildings Market Analysis, Insights and Forecast, 2020-2032
- 12.1. Market Analysis, Insights and Forecast - by Product
- 12.1.1. Exterior Products
- 12.1.2. Interior products
- 12.1.3. Other Pr
- 12.2. Market Analysis, Insights and Forecast - by End User
- 12.2.1. Residential
- 12.2.2. Office
- 12.2.3. Retail
- 12.2.4. Institutional
- 12.2.5. Other End Users
- 12.3. Market Analysis, Insights and Forecast - by Geography
- 12.3.1. China
- 12.3.2. Japan
- 12.3.3. India
- 12.3.4. Australia
- 12.3.5. South Korea
- 12.3.6. Rest of APAC
- 12.1. Market Analysis, Insights and Forecast - by Product
- 13. Competitive Analysis
- 13.1. Company Profiles
- 13.1.1 Keppel Land
- 13.1.1.1. Company Overview
- 13.1.1.2. Products
- 13.1.1.3. Company Financials
- 13.1.1.4. SWOT Analysis
- 13.1.2 CapitaLand
- 13.1.2.1. Company Overview
- 13.1.2.2. Products
- 13.1.2.3. Company Financials
- 13.1.2.4. SWOT Analysis
- 13.1.3 Shimizu Corporation
- 13.1.3.1. Company Overview
- 13.1.3.2. Products
- 13.1.3.3. Company Financials
- 13.1.3.4. SWOT Analysis
- 13.1.4 WSP
- 13.1.4.1. Company Overview
- 13.1.4.2. Products
- 13.1.4.3. Company Financials
- 13.1.4.4. SWOT Analysis
- 13.1.5 Gammon Construction
- 13.1.5.1. Company Overview
- 13.1.5.2. Products
- 13.1.5.3. Company Financials
- 13.1.5.4. SWOT Analysis
- 13.1.6 Obayashi Corporation
- 13.1.6.1. Company Overview
- 13.1.6.2. Products
- 13.1.6.3. Company Financials
- 13.1.6.4. SWOT Analysis
- 13.1.7 Sun Hung Kai Properties**List Not Exhaustive 7 3 Other Companie
- 13.1.7.1. Company Overview
- 13.1.7.2. Products
- 13.1.7.3. Company Financials
- 13.1.7.4. SWOT Analysis
- 13.1.8 Lendlease
- 13.1.8.1. Company Overview
- 13.1.8.2. Products
- 13.1.8.3. Company Financials
- 13.1.8.4. SWOT Analysis
- 13.1.9 Swire Properties
- 13.1.9.1. Company Overview
- 13.1.9.2. Products
- 13.1.9.3. Company Financials
- 13.1.9.4. SWOT Analysis
- 13.1.10 Sino Group
- 13.1.10.1. Company Overview
- 13.1.10.2. Products
- 13.1.10.3. Company Financials
- 13.1.10.4. SWOT Analysis
- 13.1.1 Keppel Land
- 13.2. Market Entropy
- 13.2.1 Company's Key Areas Served
- 13.2.2 Recent Developments
- 13.3. Company Market Share Analysis 2025
- 13.3.1 Top 5 Companies Market Share Analysis
- 13.3.2 Top 3 Companies Market Share Analysis
- 13.4. List of Potential Customers
- 14. Research Methodology
List of Figures
- Figure 1: Global APAC Green Buildings Market Revenue Breakdown (Million, %) by Region 2025 & 2033
- Figure 2: China APAC Green Buildings Market Revenue (Million), by Product 2025 & 2033
- Figure 3: China APAC Green Buildings Market Revenue Share (%), by Product 2025 & 2033
- Figure 4: China APAC Green Buildings Market Revenue (Million), by End User 2025 & 2033
- Figure 5: China APAC Green Buildings Market Revenue Share (%), by End User 2025 & 2033
- Figure 6: China APAC Green Buildings Market Revenue (Million), by Geography 2025 & 2033
- Figure 7: China APAC Green Buildings Market Revenue Share (%), by Geography 2025 & 2033
- Figure 8: China APAC Green Buildings Market Revenue (Million), by Country 2025 & 2033
- Figure 9: China APAC Green Buildings Market Revenue Share (%), by Country 2025 & 2033
- Figure 10: Japan APAC Green Buildings Market Revenue (Million), by Product 2025 & 2033
- Figure 11: Japan APAC Green Buildings Market Revenue Share (%), by Product 2025 & 2033
- Figure 12: Japan APAC Green Buildings Market Revenue (Million), by End User 2025 & 2033
- Figure 13: Japan APAC Green Buildings Market Revenue Share (%), by End User 2025 & 2033
- Figure 14: Japan APAC Green Buildings Market Revenue (Million), by Geography 2025 & 2033
- Figure 15: Japan APAC Green Buildings Market Revenue Share (%), by Geography 2025 & 2033
- Figure 16: Japan APAC Green Buildings Market Revenue (Million), by Country 2025 & 2033
- Figure 17: Japan APAC Green Buildings Market Revenue Share (%), by Country 2025 & 2033
- Figure 18: India APAC Green Buildings Market Revenue (Million), by Product 2025 & 2033
- Figure 19: India APAC Green Buildings Market Revenue Share (%), by Product 2025 & 2033
- Figure 20: India APAC Green Buildings Market Revenue (Million), by End User 2025 & 2033
- Figure 21: India APAC Green Buildings Market Revenue Share (%), by End User 2025 & 2033
- Figure 22: India APAC Green Buildings Market Revenue (Million), by Geography 2025 & 2033
- Figure 23: India APAC Green Buildings Market Revenue Share (%), by Geography 2025 & 2033
- Figure 24: India APAC Green Buildings Market Revenue (Million), by Country 2025 & 2033
- Figure 25: India APAC Green Buildings Market Revenue Share (%), by Country 2025 & 2033
- Figure 26: Australia APAC Green Buildings Market Revenue (Million), by Product 2025 & 2033
- Figure 27: Australia APAC Green Buildings Market Revenue Share (%), by Product 2025 & 2033
- Figure 28: Australia APAC Green Buildings Market Revenue (Million), by End User 2025 & 2033
- Figure 29: Australia APAC Green Buildings Market Revenue Share (%), by End User 2025 & 2033
- Figure 30: Australia APAC Green Buildings Market Revenue (Million), by Geography 2025 & 2033
- Figure 31: Australia APAC Green Buildings Market Revenue Share (%), by Geography 2025 & 2033
- Figure 32: Australia APAC Green Buildings Market Revenue (Million), by Country 2025 & 2033
- Figure 33: Australia APAC Green Buildings Market Revenue Share (%), by Country 2025 & 2033
- Figure 34: South Korea APAC Green Buildings Market Revenue (Million), by Product 2025 & 2033
- Figure 35: South Korea APAC Green Buildings Market Revenue Share (%), by Product 2025 & 2033
- Figure 36: South Korea APAC Green Buildings Market Revenue (Million), by End User 2025 & 2033
- Figure 37: South Korea APAC Green Buildings Market Revenue Share (%), by End User 2025 & 2033
- Figure 38: South Korea APAC Green Buildings Market Revenue (Million), by Geography 2025 & 2033
- Figure 39: South Korea APAC Green Buildings Market Revenue Share (%), by Geography 2025 & 2033
- Figure 40: South Korea APAC Green Buildings Market Revenue (Million), by Country 2025 & 2033
- Figure 41: South Korea APAC Green Buildings Market Revenue Share (%), by Country 2025 & 2033
- Figure 42: Rest of APAC APAC Green Buildings Market Revenue (Million), by Product 2025 & 2033
- Figure 43: Rest of APAC APAC Green Buildings Market Revenue Share (%), by Product 2025 & 2033
- Figure 44: Rest of APAC APAC Green Buildings Market Revenue (Million), by End User 2025 & 2033
- Figure 45: Rest of APAC APAC Green Buildings Market Revenue Share (%), by End User 2025 & 2033
- Figure 46: Rest of APAC APAC Green Buildings Market Revenue (Million), by Geography 2025 & 2033
- Figure 47: Rest of APAC APAC Green Buildings Market Revenue Share (%), by Geography 2025 & 2033
- Figure 48: Rest of APAC APAC Green Buildings Market Revenue (Million), by Country 2025 & 2033
- Figure 49: Rest of APAC APAC Green Buildings Market Revenue Share (%), by Country 2025 & 2033
List of Tables
- Table 1: Global APAC Green Buildings Market Revenue Million Forecast, by Product 2020 & 2033
- Table 2: Global APAC Green Buildings Market Revenue Million Forecast, by End User 2020 & 2033
- Table 3: Global APAC Green Buildings Market Revenue Million Forecast, by Geography 2020 & 2033
- Table 4: Global APAC Green Buildings Market Revenue Million Forecast, by Region 2020 & 2033
- Table 5: Global APAC Green Buildings Market Revenue Million Forecast, by Product 2020 & 2033
- Table 6: Global APAC Green Buildings Market Revenue Million Forecast, by End User 2020 & 2033
- Table 7: Global APAC Green Buildings Market Revenue Million Forecast, by Geography 2020 & 2033
- Table 8: Global APAC Green Buildings Market Revenue Million Forecast, by Country 2020 & 2033
- Table 9: Global APAC Green Buildings Market Revenue Million Forecast, by Product 2020 & 2033
- Table 10: Global APAC Green Buildings Market Revenue Million Forecast, by End User 2020 & 2033
- Table 11: Global APAC Green Buildings Market Revenue Million Forecast, by Geography 2020 & 2033
- Table 12: Global APAC Green Buildings Market Revenue Million Forecast, by Country 2020 & 2033
- Table 13: Global APAC Green Buildings Market Revenue Million Forecast, by Product 2020 & 2033
- Table 14: Global APAC Green Buildings Market Revenue Million Forecast, by End User 2020 & 2033
- Table 15: Global APAC Green Buildings Market Revenue Million Forecast, by Geography 2020 & 2033
- Table 16: Global APAC Green Buildings Market Revenue Million Forecast, by Country 2020 & 2033
- Table 17: Global APAC Green Buildings Market Revenue Million Forecast, by Product 2020 & 2033
- Table 18: Global APAC Green Buildings Market Revenue Million Forecast, by End User 2020 & 2033
- Table 19: Global APAC Green Buildings Market Revenue Million Forecast, by Geography 2020 & 2033
- Table 20: Global APAC Green Buildings Market Revenue Million Forecast, by Country 2020 & 2033
- Table 21: Global APAC Green Buildings Market Revenue Million Forecast, by Product 2020 & 2033
- Table 22: Global APAC Green Buildings Market Revenue Million Forecast, by End User 2020 & 2033
- Table 23: Global APAC Green Buildings Market Revenue Million Forecast, by Geography 2020 & 2033
- Table 24: Global APAC Green Buildings Market Revenue Million Forecast, by Country 2020 & 2033
- Table 25: Global APAC Green Buildings Market Revenue Million Forecast, by Product 2020 & 2033
- Table 26: Global APAC Green Buildings Market Revenue Million Forecast, by End User 2020 & 2033
- Table 27: Global APAC Green Buildings Market Revenue Million Forecast, by Geography 2020 & 2033
- Table 28: Global APAC Green Buildings Market Revenue Million Forecast, by Country 2020 & 2033
Frequently Asked Questions
1. What is the projected Compound Annual Growth Rate (CAGR) of the APAC Green Buildings Market?
The projected CAGR is approximately 12.23%.
2. Which companies are prominent players in the APAC Green Buildings Market?
Key companies in the market include Keppel Land, CapitaLand, Shimizu Corporation, WSP, Gammon Construction, Obayashi Corporation, Sun Hung Kai Properties**List Not Exhaustive 7 3 Other Companie, Lendlease, Swire Properties, Sino Group.
3. What are the main segments of the APAC Green Buildings Market?
The market segments include Product, End User, Geography.
4. Can you provide details about the market size?
The market size is estimated to be USD 136.90 Million as of 2022.
5. What are some drivers contributing to market growth?
Energy Efficiency in Construction Driving the Market; Flexibility and Customization Options Driving the Market.
6. What are the notable trends driving market growth?
The Commercial Segment’s Increasing Demand for Green Buildings.
7. Are there any restraints impacting market growth?
Limited Availability of Suitable Land for Construction Hindering the Market; Lower Quality Compared to Traditional Construction.
8. Can you provide examples of recent developments in the market?
April 2023: The world’s largest coffee company, Starbucks, has unveiled its first greener stores in Asia-Pacific as a part of a global rollout of its greener store framework that has grown to more than 3,500 locations across 20 markets. The five new greener stores, located in Singapore (Singapore), Thailand (Thailand), and Vietnam (Vietnam), are among the first in Starbucks Asia-Pacific region. More than 20 other Starbucks stores are expected to receive greener store certifications later this year. With this latest round of certifications, Starbucks is well on track to reaching its goal of having 10,000 greener stores worldwide by 2025.
9. What pricing options are available for accessing the report?
Pricing options include single-user, multi-user, and enterprise licenses priced at USD 4750, USD 5250, and USD 8750 respectively.
10. Is the market size provided in terms of value or volume?
The market size is provided in terms of value, measured in Million.
11. Are there any specific market keywords associated with the report?
Yes, the market keyword associated with the report is "APAC Green Buildings Market," which aids in identifying and referencing the specific market segment covered.
12. How do I determine which pricing option suits my needs best?
The pricing options vary based on user requirements and access needs. Individual users may opt for single-user licenses, while businesses requiring broader access may choose multi-user or enterprise licenses for cost-effective access to the report.
13. Are there any additional resources or data provided in the APAC Green Buildings Market report?
While the report offers comprehensive insights, it's advisable to review the specific contents or supplementary materials provided to ascertain if additional resources or data are available.
14. How can I stay updated on further developments or reports in the APAC Green Buildings Market?
To stay informed about further developments, trends, and reports in the APAC Green Buildings Market, consider subscribing to industry newsletters, following relevant companies and organizations, or regularly checking reputable industry news sources and publications.
Methodology
Step 1 - Identification of Relevant Samples Size from Population Database


Step 2 - Approaches for Defining Global Market Size (Value, Volume* & Price*)

Note*: In applicable scenarios
Step 3 - Data Sources
Primary Research
- Web Analytics
- Survey Reports
- Research Institute
- Latest Research Reports
- Opinion Leaders
Secondary Research
- Annual Reports
- White Paper
- Latest Press Release
- Industry Association
- Paid Database
- Investor Presentations

Step 4 - Data Triangulation
Involves using different sources of information in order to increase the validity of a study
These sources are likely to be stakeholders in a program - participants, other researchers, program staff, other community members, and so on.
Then we put all data in single framework & apply various statistical tools to find out the dynamic on the market.
During the analysis stage, feedback from the stakeholder groups would be compared to determine areas of agreement as well as areas of divergence