

Key Insights
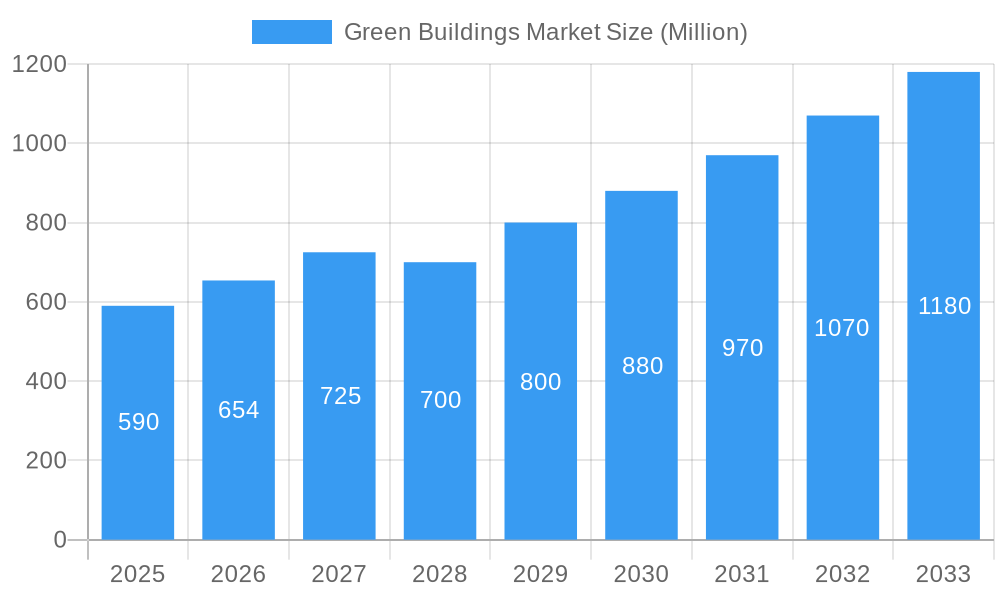
The green building market, valued at $0.59 billion in 2025, is poised for significant growth, projected to expand at a compound annual growth rate (CAGR) of 10.82% from 2025 to 2033. This robust expansion is driven by several key factors. Increasing awareness of environmental sustainability and the urgent need to mitigate climate change are pushing governments and businesses to adopt eco-friendly construction practices. Stringent environmental regulations and incentives for green building certifications, such as LEED, further stimulate market growth. Technological advancements in sustainable building materials, such as recycled content products and energy-efficient systems (including solar and building automation), are also contributing to the market's expansion. The rising demand for energy-efficient buildings, coupled with decreasing energy costs associated with green technologies, makes green building a financially viable option for both residential and commercial projects. The market is segmented by product type (exterior, interior, and other products like building and solar systems) and end-user (residential, office, retail, institutional, and other). The residential segment is expected to be a key growth driver due to increased consumer awareness and government initiatives promoting energy efficiency in homes.
Green Buildings Market Market Size (In Million)
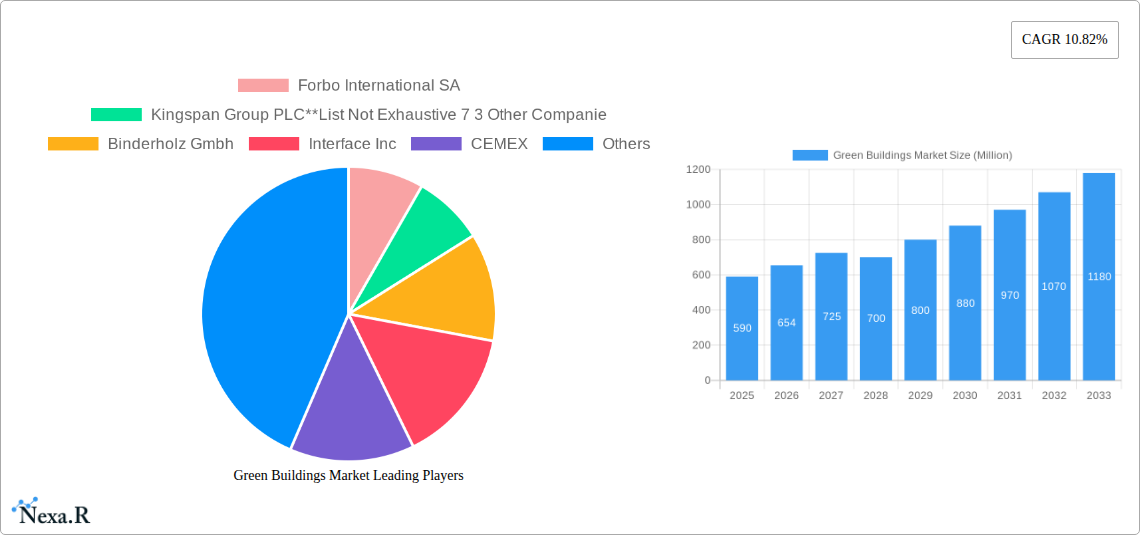
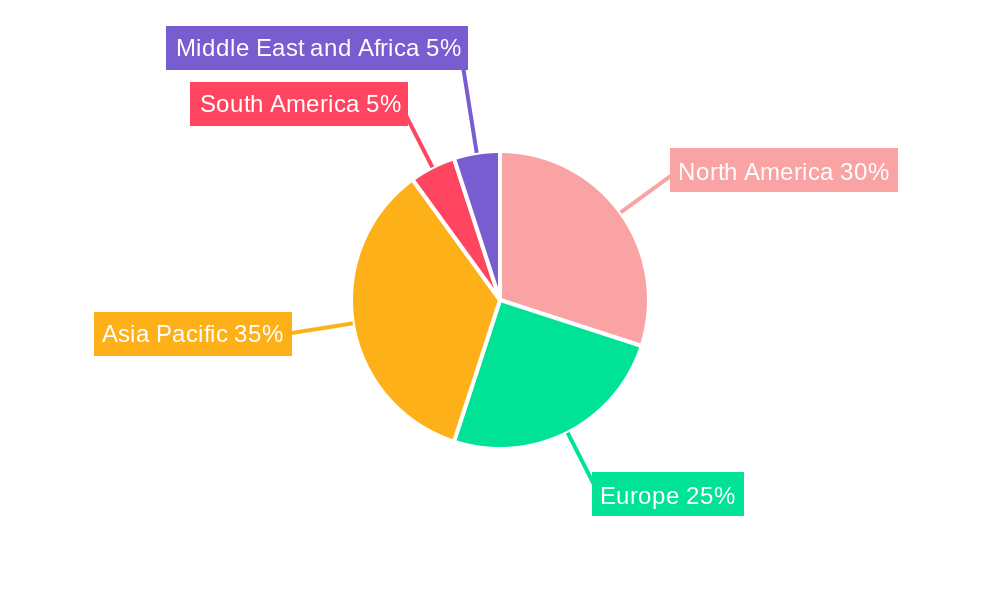
The geographical distribution of the green building market is likely to be diverse, with North America and Europe representing significant shares initially. However, the Asia-Pacific region is projected to experience the fastest growth rate due to rapid urbanization and increasing government support for sustainable infrastructure development. Companies like Forbo International SA, Kingspan Group PLC, Binderholz GmbH, Interface Inc, CEMEX, Alumasc Group PLC, BASF SE, Bauder Limited, Amvik Systems, and Owens Corning SA are key players, competing on innovation, sustainability certifications, and cost-effectiveness. While challenges exist, such as the higher initial cost of green building materials and the need for skilled labor, the long-term benefits of reduced operational costs and enhanced environmental performance are overcoming these hurdles, solidifying the market's upward trajectory.
Green Buildings Market Company Market Share
Green Buildings Market: A Comprehensive Report (2019-2033)
This comprehensive report provides an in-depth analysis of the Green Buildings Market, encompassing market dynamics, growth trends, regional insights, product landscapes, key players, and future outlooks. The study period spans from 2019 to 2033, with 2025 serving as the base and estimated year. This report is essential for industry professionals, investors, and strategic decision-makers seeking a thorough understanding of this rapidly evolving market. The parent market is the broader construction industry, while the child market focuses specifically on sustainable building practices and technologies.
Projected Market Value (Million USD): xx (2025), xx (2033)
Green Buildings Market Dynamics & Structure
The Green Buildings Market exhibits a moderately consolidated structure, with several key players holding significant market share. Technological innovation, particularly in energy-efficient materials and smart building technologies, is a primary growth driver. Stringent government regulations promoting sustainability and carbon reduction are further accelerating market expansion. Competitive substitutes, such as traditional building materials, face increasing pressure due to growing environmental concerns and rising energy costs. End-user demographics show a strong preference for green buildings, particularly among environmentally conscious consumers and businesses. Mergers and acquisitions (M&A) activity is significant, with companies strategically expanding their portfolios and capabilities within the sustainable building sector.
- Market Concentration: Moderately Consolidated (xx% market share held by top 5 players)
- Technological Innovation: Focus on energy efficiency, smart building systems, and sustainable materials.
- Regulatory Framework: Increasingly stringent environmental regulations driving demand for green buildings.
- Competitive Substitutes: Traditional building materials facing pressure from increasing environmental concerns.
- End-User Demographics: Growing preference for sustainable buildings among environmentally conscious consumers.
- M&A Trends: Significant M&A activity, reflecting strategic investments in the sector (xx deals in the last 5 years).
Green Buildings Market Growth Trends & Insights
The Green Buildings Market has experienced substantial growth over the historical period (2019-2024), driven by increasing awareness of environmental sustainability and the rising adoption of green building certifications. The market size is projected to expand significantly during the forecast period (2025-2033), with a Compound Annual Growth Rate (CAGR) of xx%. This growth reflects the rising demand for energy-efficient buildings, coupled with advancements in green building technologies and supportive government policies. Technological disruptions, such as the integration of IoT and AI into building management systems, are enhancing efficiency and driving adoption. Shifting consumer behavior, characterized by a growing preference for sustainable and environmentally responsible living, further contributes to market expansion. Market penetration of green building materials is projected to reach xx% by 2033.
Dominant Regions, Countries, or Segments in Green Buildings Market
North America and Europe currently dominate the Green Buildings Market, driven by robust regulatory frameworks, high environmental awareness, and substantial investments in sustainable infrastructure. Within the product segments, the Exterior Products segment holds the largest market share, followed by Interior Products and Other Products (Building Systems, Solar Systems, etc.). In terms of end-users, the Residential and Office segments contribute significantly to overall market growth.
- Leading Region: North America
- Key Drivers: Stringent environmental regulations, high consumer awareness, and significant government incentives.
- Market Share: North America (xx%), Europe (xx%), Asia-Pacific (xx%) (2025 estimates)
- Growth Potential: Asia-Pacific exhibits the highest growth potential due to rapid urbanization and increasing infrastructure development.
- Dominant Product Segment: Exterior Products
- Dominant End-User Segment: Residential
Green Buildings Market Product Landscape
The Green Buildings Market features a diverse range of products, including energy-efficient windows, insulation materials, sustainable roofing systems, and smart building technologies. These products are designed to minimize environmental impact throughout a building's lifecycle, from construction to demolition. Key innovations focus on improving energy efficiency, durability, and material sustainability. Unique selling propositions include reduced carbon footprint, enhanced thermal performance, and lower operating costs. Technological advancements include the incorporation of smart sensors, automated climate control, and renewable energy integration.
Key Drivers, Barriers & Challenges in Green Buildings Market
Key Drivers:
- Rising environmental concerns and growing awareness of climate change.
- Increasingly stringent government regulations and incentives promoting green building practices.
- Technological advancements leading to more efficient and cost-effective green building solutions.
- Growing demand for sustainable and energy-efficient buildings from both consumers and businesses.
Key Challenges:
- High initial costs associated with green building construction.
- Supply chain disruptions impacting the availability of sustainable materials.
- Lack of awareness and understanding of green building benefits among some stakeholders.
- Regulatory hurdles and inconsistencies in different regions.
- Competition from traditional building materials.
Emerging Opportunities in Green Buildings Market
- Growth of green building certifications and standards.
- Increasing demand for smart building technologies and energy management systems.
- Expansion into emerging markets with growing urbanization and infrastructure development.
- Development of innovative and sustainable building materials with enhanced performance characteristics.
- Growing interest in modular and prefabricated green buildings.
Growth Accelerators in the Green Buildings Market Industry
Long-term growth in the Green Buildings Market will be significantly influenced by technological breakthroughs in energy-efficient materials and renewable energy integration. Strategic partnerships between building material suppliers, technology companies, and construction firms will further enhance market expansion. Government policies supporting sustainable building practices and carbon reduction targets will be instrumental in driving long-term growth. Expansion into new markets, especially in developing economies, presents significant opportunities for market expansion.
Key Players Shaping the Green Buildings Market Market
- Forbo International SA
- Kingspan Group PLC
- Binderholz Gmbh
- Interface Inc
- CEMEX
- Alumasc Group PLC
- BASF SE
- Bauder Limited
- Amvik Systems
- Owens Corning SA
- 7 Other Companies
Notable Milestones in Green Buildings Market Sector
- June 2023: Accenture acquired Green Domus, enhancing its sustainability consulting capabilities.
- March 2023: BlocPower secured significant funding to retrofit buildings with energy-efficient appliances, accelerating the adoption of green building technologies.
In-Depth Green Buildings Market Market Outlook
The future of the Green Buildings Market looks promising, driven by strong growth drivers and substantial market potential. Strategic opportunities exist in developing innovative green building technologies, expanding into underserved markets, and establishing strong partnerships within the industry. The focus on sustainable construction will continue to increase, leading to a substantial rise in the market size and value over the next decade. Companies that embrace innovation and adapt to evolving market needs will be best positioned to capitalize on future growth opportunities.
Green Buildings Market Segmentation
-
1. Product
- 1.1. Exterior Products
- 1.2. Interior products
- 1.3. Other Pr
-
2. End User
- 2.1. Residential
- 2.2. Office
- 2.3. Retail
- 2.4. Institutional
- 2.5. Other End Users
Green Buildings Market Segmentation By Geography
- 1. Asia Pacific
- 2. North America
- 3. Europe
- 4. South America
- 5. Middle East and Africa
Green Buildings Market Regional Market Share
Geographic Coverage of Green Buildings Market
Green Buildings Market REPORT HIGHLIGHTS
| Aspects | Details |
|---|---|
| Study Period | 2020-2034 |
| Base Year | 2025 |
| Estimated Year | 2026 |
| Forecast Period | 2026-2034 |
| Historical Period | 2020-2025 |
| Growth Rate | CAGR of 10.82% from 2020-2034 |
| Segmentation |
|
Table of Contents
- 1. Introduction
- 1.1. Research Scope
- 1.2. Market Segmentation
- 1.3. Research Objective
- 1.4. Definitions and Assumptions
- 2. Executive Summary
- 2.1. Market Snapshot
- 3. Market Dynamics
- 3.1. Market Drivers
- 3.2. Market Restrains
- 3.3. Market Trends
- 3.4. Market Opportunities
- 4. Market Factor Analysis
- 4.1. Porters Five Forces
- 4.1.1. Bargaining Power of Suppliers
- 4.1.2. Bargaining Power of Buyers
- 4.1.3. Threat of New Entrants
- 4.1.4. Threat of Substitutes
- 4.1.5. Competitive Rivalry
- 4.2. PESTEL analysis
- 4.3. BCG Analysis
- 4.3.1. Stars (High Growth, High Market Share)
- 4.3.2. Cash Cows (Low Growth, High Market Share)
- 4.3.3. Question Mark (High Growth, Low Market Share)
- 4.3.4. Dogs (Low Growth, Low Market Share)
- 4.4. Ansoff Matrix Analysis
- 4.5. Supply Chain Analysis
- 4.6. Regulatory Landscape
- 4.7. Current Market Potential and Opportunity Assessment (TAM–SAM–SOM Framework)
- 4.8. NRP Analyst Note
- 4.1. Porters Five Forces
- 5. Market Analysis, Insights and Forecast 2021-2033
- 5.1. Market Analysis, Insights and Forecast - by Product
- 5.1.1. Exterior Products
- 5.1.2. Interior products
- 5.1.3. Other Pr
- 5.2. Market Analysis, Insights and Forecast - by End User
- 5.2.1. Residential
- 5.2.2. Office
- 5.2.3. Retail
- 5.2.4. Institutional
- 5.2.5. Other End Users
- 5.3. Market Analysis, Insights and Forecast - by Region
- 5.3.1. Asia Pacific
- 5.3.2. North America
- 5.3.3. Europe
- 5.3.4. South America
- 5.3.5. Middle East and Africa
- 5.1. Market Analysis, Insights and Forecast - by Product
- 6. Global Green Buildings Market Analysis, Insights and Forecast, 2021-2033
- 6.1. Market Analysis, Insights and Forecast - by Product
- 6.1.1. Exterior Products
- 6.1.2. Interior products
- 6.1.3. Other Pr
- 6.2. Market Analysis, Insights and Forecast - by End User
- 6.2.1. Residential
- 6.2.2. Office
- 6.2.3. Retail
- 6.2.4. Institutional
- 6.2.5. Other End Users
- 6.1. Market Analysis, Insights and Forecast - by Product
- 7. Asia Pacific Green Buildings Market Analysis, Insights and Forecast, 2020-2032
- 7.1. Market Analysis, Insights and Forecast - by Product
- 7.1.1. Exterior Products
- 7.1.2. Interior products
- 7.1.3. Other Pr
- 7.2. Market Analysis, Insights and Forecast - by End User
- 7.2.1. Residential
- 7.2.2. Office
- 7.2.3. Retail
- 7.2.4. Institutional
- 7.2.5. Other End Users
- 7.1. Market Analysis, Insights and Forecast - by Product
- 8. North America Green Buildings Market Analysis, Insights and Forecast, 2020-2032
- 8.1. Market Analysis, Insights and Forecast - by Product
- 8.1.1. Exterior Products
- 8.1.2. Interior products
- 8.1.3. Other Pr
- 8.2. Market Analysis, Insights and Forecast - by End User
- 8.2.1. Residential
- 8.2.2. Office
- 8.2.3. Retail
- 8.2.4. Institutional
- 8.2.5. Other End Users
- 8.1. Market Analysis, Insights and Forecast - by Product
- 9. Europe Green Buildings Market Analysis, Insights and Forecast, 2020-2032
- 9.1. Market Analysis, Insights and Forecast - by Product
- 9.1.1. Exterior Products
- 9.1.2. Interior products
- 9.1.3. Other Pr
- 9.2. Market Analysis, Insights and Forecast - by End User
- 9.2.1. Residential
- 9.2.2. Office
- 9.2.3. Retail
- 9.2.4. Institutional
- 9.2.5. Other End Users
- 9.1. Market Analysis, Insights and Forecast - by Product
- 10. South America Green Buildings Market Analysis, Insights and Forecast, 2020-2032
- 10.1. Market Analysis, Insights and Forecast - by Product
- 10.1.1. Exterior Products
- 10.1.2. Interior products
- 10.1.3. Other Pr
- 10.2. Market Analysis, Insights and Forecast - by End User
- 10.2.1. Residential
- 10.2.2. Office
- 10.2.3. Retail
- 10.2.4. Institutional
- 10.2.5. Other End Users
- 10.1. Market Analysis, Insights and Forecast - by Product
- 11. Middle East and Africa Green Buildings Market Analysis, Insights and Forecast, 2020-2032
- 11.1. Market Analysis, Insights and Forecast - by Product
- 11.1.1. Exterior Products
- 11.1.2. Interior products
- 11.1.3. Other Pr
- 11.2. Market Analysis, Insights and Forecast - by End User
- 11.2.1. Residential
- 11.2.2. Office
- 11.2.3. Retail
- 11.2.4. Institutional
- 11.2.5. Other End Users
- 11.1. Market Analysis, Insights and Forecast - by Product
- 12. Competitive Analysis
- 12.1. Company Profiles
- 12.1.1 Forbo International SA
- 12.1.1.1. Company Overview
- 12.1.1.2. Products
- 12.1.1.3. Company Financials
- 12.1.1.4. SWOT Analysis
- 12.1.2 Kingspan Group PLC**List Not Exhaustive 7 3 Other Companie
- 12.1.2.1. Company Overview
- 12.1.2.2. Products
- 12.1.2.3. Company Financials
- 12.1.2.4. SWOT Analysis
- 12.1.3 Binderholz Gmbh
- 12.1.3.1. Company Overview
- 12.1.3.2. Products
- 12.1.3.3. Company Financials
- 12.1.3.4. SWOT Analysis
- 12.1.4 Interface Inc
- 12.1.4.1. Company Overview
- 12.1.4.2. Products
- 12.1.4.3. Company Financials
- 12.1.4.4. SWOT Analysis
- 12.1.5 CEMEX
- 12.1.5.1. Company Overview
- 12.1.5.2. Products
- 12.1.5.3. Company Financials
- 12.1.5.4. SWOT Analysis
- 12.1.6 Alumasc Group PLC
- 12.1.6.1. Company Overview
- 12.1.6.2. Products
- 12.1.6.3. Company Financials
- 12.1.6.4. SWOT Analysis
- 12.1.7 BASF SE
- 12.1.7.1. Company Overview
- 12.1.7.2. Products
- 12.1.7.3. Company Financials
- 12.1.7.4. SWOT Analysis
- 12.1.8 Bauder Limited
- 12.1.8.1. Company Overview
- 12.1.8.2. Products
- 12.1.8.3. Company Financials
- 12.1.8.4. SWOT Analysis
- 12.1.9 Amvik Systems
- 12.1.9.1. Company Overview
- 12.1.9.2. Products
- 12.1.9.3. Company Financials
- 12.1.9.4. SWOT Analysis
- 12.1.10 Owens Corning SA
- 12.1.10.1. Company Overview
- 12.1.10.2. Products
- 12.1.10.3. Company Financials
- 12.1.10.4. SWOT Analysis
- 12.1.1 Forbo International SA
- 12.2. Market Entropy
- 12.2.1 Company's Key Areas Served
- 12.2.2 Recent Developments
- 12.3. Company Market Share Analysis 2025
- 12.3.1 Top 5 Companies Market Share Analysis
- 12.3.2 Top 3 Companies Market Share Analysis
- 12.4. List of Potential Customers
- 13. Research Methodology
List of Figures
- Figure 1: Global Green Buildings Market Revenue Breakdown (Million, %) by Region 2025 & 2033
- Figure 2: Asia Pacific Green Buildings Market Revenue (Million), by Product 2025 & 2033
- Figure 3: Asia Pacific Green Buildings Market Revenue Share (%), by Product 2025 & 2033
- Figure 4: Asia Pacific Green Buildings Market Revenue (Million), by End User 2025 & 2033
- Figure 5: Asia Pacific Green Buildings Market Revenue Share (%), by End User 2025 & 2033
- Figure 6: Asia Pacific Green Buildings Market Revenue (Million), by Country 2025 & 2033
- Figure 7: Asia Pacific Green Buildings Market Revenue Share (%), by Country 2025 & 2033
- Figure 8: North America Green Buildings Market Revenue (Million), by Product 2025 & 2033
- Figure 9: North America Green Buildings Market Revenue Share (%), by Product 2025 & 2033
- Figure 10: North America Green Buildings Market Revenue (Million), by End User 2025 & 2033
- Figure 11: North America Green Buildings Market Revenue Share (%), by End User 2025 & 2033
- Figure 12: North America Green Buildings Market Revenue (Million), by Country 2025 & 2033
- Figure 13: North America Green Buildings Market Revenue Share (%), by Country 2025 & 2033
- Figure 14: Europe Green Buildings Market Revenue (Million), by Product 2025 & 2033
- Figure 15: Europe Green Buildings Market Revenue Share (%), by Product 2025 & 2033
- Figure 16: Europe Green Buildings Market Revenue (Million), by End User 2025 & 2033
- Figure 17: Europe Green Buildings Market Revenue Share (%), by End User 2025 & 2033
- Figure 18: Europe Green Buildings Market Revenue (Million), by Country 2025 & 2033
- Figure 19: Europe Green Buildings Market Revenue Share (%), by Country 2025 & 2033
- Figure 20: South America Green Buildings Market Revenue (Million), by Product 2025 & 2033
- Figure 21: South America Green Buildings Market Revenue Share (%), by Product 2025 & 2033
- Figure 22: South America Green Buildings Market Revenue (Million), by End User 2025 & 2033
- Figure 23: South America Green Buildings Market Revenue Share (%), by End User 2025 & 2033
- Figure 24: South America Green Buildings Market Revenue (Million), by Country 2025 & 2033
- Figure 25: South America Green Buildings Market Revenue Share (%), by Country 2025 & 2033
- Figure 26: Middle East and Africa Green Buildings Market Revenue (Million), by Product 2025 & 2033
- Figure 27: Middle East and Africa Green Buildings Market Revenue Share (%), by Product 2025 & 2033
- Figure 28: Middle East and Africa Green Buildings Market Revenue (Million), by End User 2025 & 2033
- Figure 29: Middle East and Africa Green Buildings Market Revenue Share (%), by End User 2025 & 2033
- Figure 30: Middle East and Africa Green Buildings Market Revenue (Million), by Country 2025 & 2033
- Figure 31: Middle East and Africa Green Buildings Market Revenue Share (%), by Country 2025 & 2033
List of Tables
- Table 1: Global Green Buildings Market Revenue Million Forecast, by Product 2020 & 2033
- Table 2: Global Green Buildings Market Revenue Million Forecast, by End User 2020 & 2033
- Table 3: Global Green Buildings Market Revenue Million Forecast, by Region 2020 & 2033
- Table 4: Global Green Buildings Market Revenue Million Forecast, by Product 2020 & 2033
- Table 5: Global Green Buildings Market Revenue Million Forecast, by End User 2020 & 2033
- Table 6: Global Green Buildings Market Revenue Million Forecast, by Country 2020 & 2033
- Table 7: Global Green Buildings Market Revenue Million Forecast, by Product 2020 & 2033
- Table 8: Global Green Buildings Market Revenue Million Forecast, by End User 2020 & 2033
- Table 9: Global Green Buildings Market Revenue Million Forecast, by Country 2020 & 2033
- Table 10: Global Green Buildings Market Revenue Million Forecast, by Product 2020 & 2033
- Table 11: Global Green Buildings Market Revenue Million Forecast, by End User 2020 & 2033
- Table 12: Global Green Buildings Market Revenue Million Forecast, by Country 2020 & 2033
- Table 13: Global Green Buildings Market Revenue Million Forecast, by Product 2020 & 2033
- Table 14: Global Green Buildings Market Revenue Million Forecast, by End User 2020 & 2033
- Table 15: Global Green Buildings Market Revenue Million Forecast, by Country 2020 & 2033
- Table 16: Global Green Buildings Market Revenue Million Forecast, by Product 2020 & 2033
- Table 17: Global Green Buildings Market Revenue Million Forecast, by End User 2020 & 2033
- Table 18: Global Green Buildings Market Revenue Million Forecast, by Country 2020 & 2033
Frequently Asked Questions
1. What is the projected Compound Annual Growth Rate (CAGR) of the Green Buildings Market?
The projected CAGR is approximately 10.82%.
2. Which companies are prominent players in the Green Buildings Market?
Key companies in the market include Forbo International SA, Kingspan Group PLC**List Not Exhaustive 7 3 Other Companie, Binderholz Gmbh, Interface Inc, CEMEX, Alumasc Group PLC, BASF SE, Bauder Limited, Amvik Systems, Owens Corning SA.
3. What are the main segments of the Green Buildings Market?
The market segments include Product, End User.
4. Can you provide details about the market size?
The market size is estimated to be USD 0.59 Million as of 2022.
5. What are some drivers contributing to market growth?
Energy Efficiency in Construction; Flexibility and Customization Options.
6. What are the notable trends driving market growth?
Increasing investment and rise in demand for sustainable buildings in the commercial segment.
7. Are there any restraints impacting market growth?
Limited Availability of Suitable Land for Construction; Lower Quality Compared to Traditional Construction.
8. Can you provide examples of recent developments in the market?
June 2023: Accenture acquired Green Domus, a leading sustainability consultancy based in Brazil, providing clients with the expertise to develop and execute a variety of sustainability initiatives with a strong focus on quantifiable decarbonization.
9. What pricing options are available for accessing the report?
Pricing options include single-user, multi-user, and enterprise licenses priced at USD 4750, USD 5250, and USD 8750 respectively.
10. Is the market size provided in terms of value or volume?
The market size is provided in terms of value, measured in Million.
11. Are there any specific market keywords associated with the report?
Yes, the market keyword associated with the report is "Green Buildings Market," which aids in identifying and referencing the specific market segment covered.
12. How do I determine which pricing option suits my needs best?
The pricing options vary based on user requirements and access needs. Individual users may opt for single-user licenses, while businesses requiring broader access may choose multi-user or enterprise licenses for cost-effective access to the report.
13. Are there any additional resources or data provided in the Green Buildings Market report?
While the report offers comprehensive insights, it's advisable to review the specific contents or supplementary materials provided to ascertain if additional resources or data are available.
14. How can I stay updated on further developments or reports in the Green Buildings Market?
To stay informed about further developments, trends, and reports in the Green Buildings Market, consider subscribing to industry newsletters, following relevant companies and organizations, or regularly checking reputable industry news sources and publications.
Methodology
Step 1 - Identification of Relevant Samples Size from Population Database


Step 2 - Approaches for Defining Global Market Size (Value, Volume* & Price*)

Note*: In applicable scenarios
Step 3 - Data Sources
Primary Research
- Web Analytics
- Survey Reports
- Research Institute
- Latest Research Reports
- Opinion Leaders
Secondary Research
- Annual Reports
- White Paper
- Latest Press Release
- Industry Association
- Paid Database
- Investor Presentations

Step 4 - Data Triangulation
Involves using different sources of information in order to increase the validity of a study
These sources are likely to be stakeholders in a program - participants, other researchers, program staff, other community members, and so on.
Then we put all data in single framework & apply various statistical tools to find out the dynamic on the market.
During the analysis stage, feedback from the stakeholder groups would be compared to determine areas of agreement as well as areas of divergence