

Key Insights
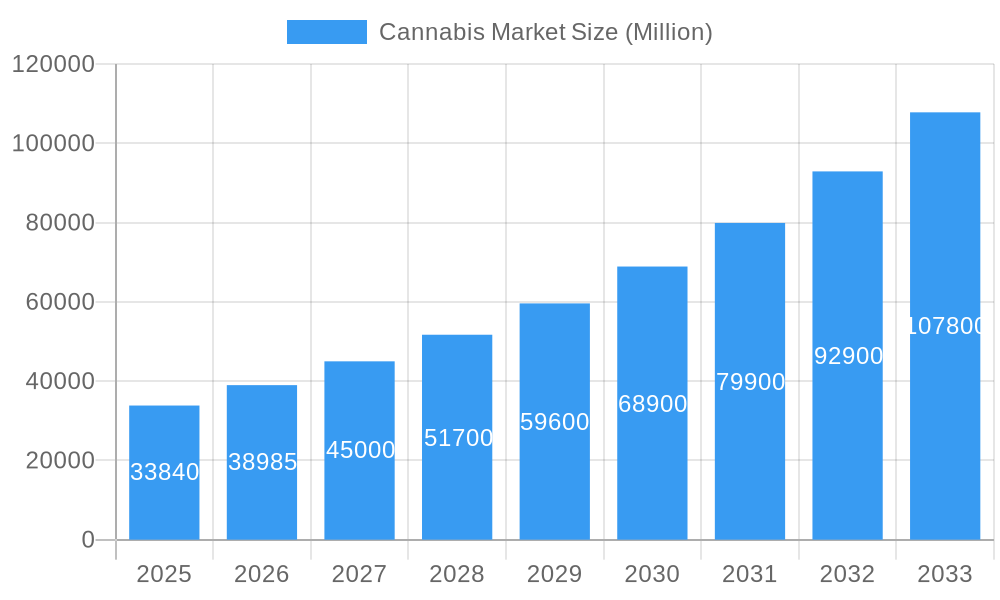
The global cannabis market, valued at $33.84 billion in 2025, is projected to experience robust growth, driven by increasing legalization and acceptance across various regions. A compound annual growth rate (CAGR) of 15.40% from 2025 to 2033 suggests a significant expansion of market size, reaching an estimated $140 billion by 2033. Key growth drivers include evolving consumer preferences toward natural and alternative medicine, coupled with the growing body of scientific research highlighting the therapeutic potential of cannabinoids like THC and CBD. The increasing acceptance of cannabis for both medical and recreational purposes is further fueling market expansion. Different product types, including capsules, concentrates, and edibles, cater to diverse consumer needs and preferences, while the segments of medical and recreational applications further define the market's multifaceted nature. Leading companies such as Canopy Growth Corp, Tilray, and Aurora Cannabis Inc. are actively shaping the market landscape through innovation, expansion, and strategic partnerships. However, challenges remain, including stringent regulations in some regions and concerns surrounding potential health risks associated with high THC consumption. Despite these constraints, the positive regulatory changes and growing consumer demand are poised to propel the global cannabis market toward substantial growth in the coming years.
Cannabis Market Market Size (In Billion)
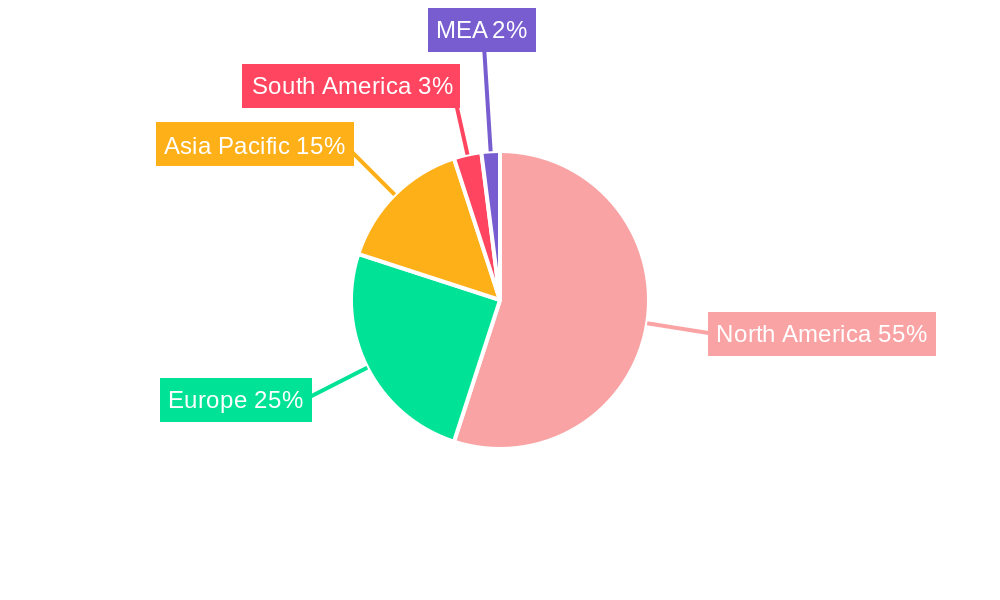
The regional distribution of the market reflects varying degrees of legalization and acceptance. North America, particularly the United States and Canada, currently holds a dominant market share, driven by early legalization initiatives and established industry infrastructure. However, Europe and Asia Pacific are emerging as significant growth markets, with increasing legalization efforts and expanding consumer bases. The expansion into new markets will depend on several factors, including government regulations, public perception, and the ability of companies to adapt to local market conditions. The ongoing research and development in cannabis-based pharmaceuticals and the development of new product formulations will further influence market dynamics. The evolution of the cannabis market will likely witness increased competition, consolidation, and innovation, shaping a dynamic and rapidly evolving landscape.
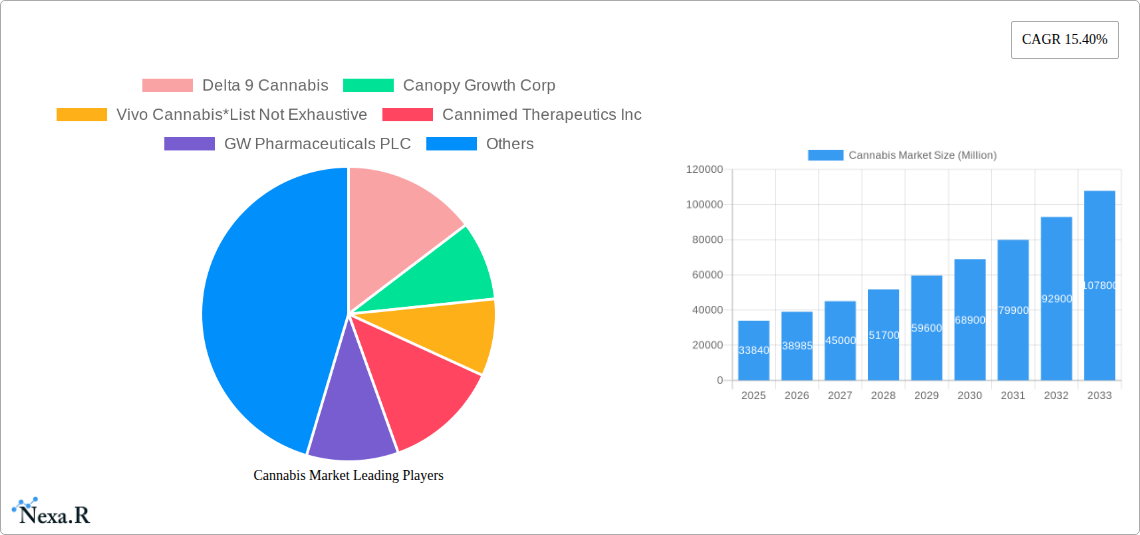
Cannabis Market Company Market Share
Cannabis Market: A Comprehensive Market Report (2019-2033)
This comprehensive report provides an in-depth analysis of the global cannabis market, encompassing its dynamic structure, growth trends, dominant segments, and future outlook. The study period covers 2019-2033, with a base year of 2025 and a forecast period of 2025-2033. This report is crucial for industry professionals, investors, and researchers seeking a complete understanding of this rapidly evolving market valued at xx Million units in 2025.
Cannabis Market Dynamics & Structure
The cannabis market is characterized by intense competition, rapid technological advancements, and evolving regulatory landscapes. Market concentration is moderate, with several key players holding significant shares, while numerous smaller companies also contribute. Technological innovations, particularly in cultivation techniques and product formulation, are driving market growth. Regulatory frameworks vary significantly across jurisdictions, influencing market access and product development. The market also witnesses considerable M&A activity, reflecting its dynamic nature. Competitive substitutes include traditional pharmaceuticals and over-the-counter pain relievers. End-user demographics are expanding, with increasing acceptance across diverse age groups and lifestyles.
- Market Concentration: Moderate, with top 5 players holding approximately xx% market share in 2025.
- M&A Deal Volume (2019-2024): xx deals, averaging xx Million units per deal.
- Innovation Barriers: Stringent regulations, high research and development costs, and limited consumer awareness in some regions.
- End-User Demographics: Shifting towards broader acceptance across age groups and lifestyles.
Cannabis Market Growth Trends & Insights
The global cannabis market has experienced substantial growth in recent years, driven by increasing legalization and acceptance, expanding product offerings, and evolving consumer preferences. The market size witnessed a CAGR of xx% during the historical period (2019-2024), reaching xx Million units in 2024. This growth is projected to continue, with a forecasted CAGR of xx% during the forecast period (2025-2033), reaching xx Million units by 2033. Technological disruptions, such as advancements in extraction methods and delivery systems, are further fueling market expansion. Changing consumer behaviors, including increased demand for high-quality, innovative products, are also influencing market dynamics. Market penetration is expected to increase from xx% in 2024 to xx% by 2033.
Dominant Regions, Countries, or Segments in Cannabis Market
North America currently dominates the cannabis market, driven by early legalization in several states and provinces. Within North America, the United States and Canada are leading contributors. The recreational segment is experiencing faster growth compared to the medical segment, driven by changing social attitudes and increased consumer demand. Among product types, edibles and concentrates are witnessing significant growth. CBD-based products are showing strong market traction due to their perceived health benefits and broader legal acceptance.
- Leading Region: North America (xx% market share in 2025).
- Fastest-Growing Segment: Recreational (xx% CAGR, 2025-2033).
- Key Growth Drivers: Relaxed regulations, increased consumer awareness, and robust marketing campaigns.
- Market Share by Product Type (2025): Edibles (xx%), Concentrates (xx%), Capsules (xx%), Other (xx%).
- Market Share by Application (2025): Recreational (xx%), Medical (xx%).
- Market Share by Compound Type (2025): THC (xx%), CBD (xx%), Balanced THC & CBD (xx%).
Cannabis Market Product Landscape
The cannabis market offers a diverse range of products, including dried flower, oils, capsules, edibles, and concentrates, catering to various consumer preferences and medical needs. Recent innovations focus on enhanced product quality, convenient delivery systems, and precise dosing. Technological advancements are improving extraction methods, resulting in higher potency and purity. Unique selling propositions include customized formulations tailored to specific needs and innovative product formats that enhance the consumer experience.
Key Drivers, Barriers & Challenges in Cannabis Market
Key Drivers:
- Increased Legalization: Expanding acceptance and legalization across various jurisdictions.
- Therapeutic Potential: Growing recognition of cannabis's medicinal benefits.
- Technological Advancements: Innovations in cultivation, extraction, and delivery systems.
Key Challenges & Restraints:
- Regulatory Hurdles: Varied and evolving regulatory frameworks create challenges for market entry and expansion. The stringent regulatory environment leads to approximately xx Million units of lost revenue annually.
- Supply Chain Issues: Limited access to high-quality raw materials and efficient distribution channels.
- Public Perception: Negative perceptions and social stigma still persist in some regions, hindering market growth. Negative publicity cost the industry approximately xx Million units in lost revenue annually.
Emerging Opportunities in Cannabis Market
- International Expansion: Untapped markets in emerging economies present significant growth potential.
- Innovative Product Development: Development of new product formats and formulations to cater to evolving consumer preferences.
- CBD-Infused Products: Expanding consumer adoption of CBD-based products across various sectors.
Growth Accelerators in the Cannabis Market Industry
Strategic partnerships and collaborations are accelerating market growth, fostering innovation, and expanding market reach. Technological advancements, such as personalized medicine and advanced delivery systems, are creating new opportunities. The increasing focus on research and development is leading to a deeper understanding of the therapeutic applications of cannabis, thereby propelling market expansion.
Key Players Shaping the Cannabis Market Market
- Delta 9 Cannabis
- Canopy Growth Corp
- Vivo Cannabis
- Cannimed Therapeutics Inc
- GW Pharmaceuticals PLC
- Aphria Inc
- Tilray
- CV Sciences Inc
- MedReLeaf Corp
- Aurora Cannabis Inc
Notable Milestones in Cannabis Market Sector
- May 2023: Toast and Nirvana Group partnered to introduce innovative products in Oklahoma and New Mexico.
- April 2023: Hello Juice and Smoothie partnered with Beleaf Co. to launch CBD-infused juice shots.
- May 2022: Canopy Growth launched two new flavors for its cannabis-infused carbonated drinks.
In-Depth Cannabis Market Market Outlook
The cannabis market is poised for sustained growth, driven by ongoing legalization efforts, expanding product lines, and increasing consumer acceptance. Strategic investments in research and development, coupled with the development of innovative products and delivery systems, will further fuel market expansion. The market presents attractive opportunities for companies that can effectively navigate the evolving regulatory landscape and meet the growing demand for high-quality, safe, and effective cannabis products. The market is predicted to reach xx Million units by 2033, presenting significant potential for stakeholders.
Cannabis Market Segmentation
- 1. Production Analysis
- 2. Consumption Analysis
- 3. Import Market Analysis (Value & Volume)
- 4. Export Market Analysis (Value & Volume)
- 5. Price Trend Analysis
Cannabis Market Segmentation By Geography
-
1. North America
- 1.1. United States
- 1.2. Canada
- 1.3. Mexico
-
2. South America
- 2.1. Brazil
- 2.2. Argentina
- 2.3. Rest of South America
-
3. Europe
- 3.1. United Kingdom
- 3.2. Germany
- 3.3. France
- 3.4. Italy
- 3.5. Spain
- 3.6. Russia
- 3.7. Benelux
- 3.8. Nordics
- 3.9. Rest of Europe
-
4. Middle East & Africa
- 4.1. Turkey
- 4.2. Israel
- 4.3. GCC
- 4.4. North Africa
- 4.5. South Africa
- 4.6. Rest of Middle East & Africa
-
5. Asia Pacific
- 5.1. China
- 5.2. India
- 5.3. Japan
- 5.4. South Korea
- 5.5. ASEAN
- 5.6. Oceania
- 5.7. Rest of Asia Pacific
Cannabis Market Regional Market Share
Geographic Coverage of Cannabis Market
Cannabis Market REPORT HIGHLIGHTS
| Aspects | Details |
|---|---|
| Study Period | 2020-2034 |
| Base Year | 2025 |
| Estimated Year | 2026 |
| Forecast Period | 2026-2034 |
| Historical Period | 2020-2025 |
| Growth Rate | CAGR of 15.40% from 2020-2034 |
| Segmentation |
|
Table of Contents
- 1. Introduction
- 1.1. Research Scope
- 1.2. Market Segmentation
- 1.3. Research Objective
- 1.4. Definitions and Assumptions
- 2. Executive Summary
- 2.1. Market Snapshot
- 3. Market Dynamics
- 3.1. Market Drivers
- 3.2. Market Restrains
- 3.3. Market Trends
- 3.4. Market Opportunities
- 4. Market Factor Analysis
- 4.1. Porters Five Forces
- 4.1.1. Bargaining Power of Suppliers
- 4.1.2. Bargaining Power of Buyers
- 4.1.3. Threat of New Entrants
- 4.1.4. Threat of Substitutes
- 4.1.5. Competitive Rivalry
- 4.2. PESTEL analysis
- 4.3. BCG Analysis
- 4.3.1. Stars (High Growth, High Market Share)
- 4.3.2. Cash Cows (Low Growth, High Market Share)
- 4.3.3. Question Mark (High Growth, Low Market Share)
- 4.3.4. Dogs (Low Growth, Low Market Share)
- 4.4. Ansoff Matrix Analysis
- 4.5. Supply Chain Analysis
- 4.6. Regulatory Landscape
- 4.7. Current Market Potential and Opportunity Assessment (TAM–SAM–SOM Framework)
- 4.8. NRP Analyst Note
- 4.1. Porters Five Forces
- 5. Market Analysis, Insights and Forecast 2021-2033
- 5.1. Market Analysis, Insights and Forecast - by Production Analysis
- 5.2. Market Analysis, Insights and Forecast - by Consumption Analysis
- 5.3. Market Analysis, Insights and Forecast - by Import Market Analysis (Value & Volume)
- 5.4. Market Analysis, Insights and Forecast - by Export Market Analysis (Value & Volume)
- 5.5. Market Analysis, Insights and Forecast - by Price Trend Analysis
- 5.6. Market Analysis, Insights and Forecast - by Region
- 5.6.1. North America
- 5.6.2. South America
- 5.6.3. Europe
- 5.6.4. Middle East & Africa
- 5.6.5. Asia Pacific
- 6. Global Cannabis Market Analysis, Insights and Forecast, 2021-2033
- 6.1. Market Analysis, Insights and Forecast - by Production Analysis
- 6.2. Market Analysis, Insights and Forecast - by Consumption Analysis
- 6.3. Market Analysis, Insights and Forecast - by Import Market Analysis (Value & Volume)
- 6.4. Market Analysis, Insights and Forecast - by Export Market Analysis (Value & Volume)
- 6.5. Market Analysis, Insights and Forecast - by Price Trend Analysis
- 7. North America Cannabis Market Analysis, Insights and Forecast, 2020-2032
- 7.1. Market Analysis, Insights and Forecast - by Production Analysis
- 7.2. Market Analysis, Insights and Forecast - by Consumption Analysis
- 7.3. Market Analysis, Insights and Forecast - by Import Market Analysis (Value & Volume)
- 7.4. Market Analysis, Insights and Forecast - by Export Market Analysis (Value & Volume)
- 7.5. Market Analysis, Insights and Forecast - by Price Trend Analysis
- 8. South America Cannabis Market Analysis, Insights and Forecast, 2020-2032
- 8.1. Market Analysis, Insights and Forecast - by Production Analysis
- 8.2. Market Analysis, Insights and Forecast - by Consumption Analysis
- 8.3. Market Analysis, Insights and Forecast - by Import Market Analysis (Value & Volume)
- 8.4. Market Analysis, Insights and Forecast - by Export Market Analysis (Value & Volume)
- 8.5. Market Analysis, Insights and Forecast - by Price Trend Analysis
- 9. Europe Cannabis Market Analysis, Insights and Forecast, 2020-2032
- 9.1. Market Analysis, Insights and Forecast - by Production Analysis
- 9.2. Market Analysis, Insights and Forecast - by Consumption Analysis
- 9.3. Market Analysis, Insights and Forecast - by Import Market Analysis (Value & Volume)
- 9.4. Market Analysis, Insights and Forecast - by Export Market Analysis (Value & Volume)
- 9.5. Market Analysis, Insights and Forecast - by Price Trend Analysis
- 10. Middle East & Africa Cannabis Market Analysis, Insights and Forecast, 2020-2032
- 10.1. Market Analysis, Insights and Forecast - by Production Analysis
- 10.2. Market Analysis, Insights and Forecast - by Consumption Analysis
- 10.3. Market Analysis, Insights and Forecast - by Import Market Analysis (Value & Volume)
- 10.4. Market Analysis, Insights and Forecast - by Export Market Analysis (Value & Volume)
- 10.5. Market Analysis, Insights and Forecast - by Price Trend Analysis
- 11. Asia Pacific Cannabis Market Analysis, Insights and Forecast, 2020-2032
- 11.1. Market Analysis, Insights and Forecast - by Production Analysis
- 11.2. Market Analysis, Insights and Forecast - by Consumption Analysis
- 11.3. Market Analysis, Insights and Forecast - by Import Market Analysis (Value & Volume)
- 11.4. Market Analysis, Insights and Forecast - by Export Market Analysis (Value & Volume)
- 11.5. Market Analysis, Insights and Forecast - by Price Trend Analysis
- 12. Competitive Analysis
- 12.1. Company Profiles
- 12.1.1 Delta 9 Cannabis
- 12.1.1.1. Company Overview
- 12.1.1.2. Products
- 12.1.1.3. Company Financials
- 12.1.1.4. SWOT Analysis
- 12.1.2 Canopy Growth Corp
- 12.1.2.1. Company Overview
- 12.1.2.2. Products
- 12.1.2.3. Company Financials
- 12.1.2.4. SWOT Analysis
- 12.1.3 Vivo Cannabis*List Not Exhaustive
- 12.1.3.1. Company Overview
- 12.1.3.2. Products
- 12.1.3.3. Company Financials
- 12.1.3.4. SWOT Analysis
- 12.1.4 Cannimed Therapeutics Inc
- 12.1.4.1. Company Overview
- 12.1.4.2. Products
- 12.1.4.3. Company Financials
- 12.1.4.4. SWOT Analysis
- 12.1.5 GW Pharmaceuticals PLC
- 12.1.5.1. Company Overview
- 12.1.5.2. Products
- 12.1.5.3. Company Financials
- 12.1.5.4. SWOT Analysis
- 12.1.6 Aphria Inc
- 12.1.6.1. Company Overview
- 12.1.6.2. Products
- 12.1.6.3. Company Financials
- 12.1.6.4. SWOT Analysis
- 12.1.7 Tilray
- 12.1.7.1. Company Overview
- 12.1.7.2. Products
- 12.1.7.3. Company Financials
- 12.1.7.4. SWOT Analysis
- 12.1.8 CV Sciences Inc
- 12.1.8.1. Company Overview
- 12.1.8.2. Products
- 12.1.8.3. Company Financials
- 12.1.8.4. SWOT Analysis
- 12.1.9 MedReLeaf Corp
- 12.1.9.1. Company Overview
- 12.1.9.2. Products
- 12.1.9.3. Company Financials
- 12.1.9.4. SWOT Analysis
- 12.1.10 Aurora Cannabis Inc
- 12.1.10.1. Company Overview
- 12.1.10.2. Products
- 12.1.10.3. Company Financials
- 12.1.10.4. SWOT Analysis
- 12.1.1 Delta 9 Cannabis
- 12.2. Market Entropy
- 12.2.1 Company's Key Areas Served
- 12.2.2 Recent Developments
- 12.3. Company Market Share Analysis 2025
- 12.3.1 Top 5 Companies Market Share Analysis
- 12.3.2 Top 3 Companies Market Share Analysis
- 12.4. List of Potential Customers
- 13. Research Methodology
List of Figures
- Figure 1: Global Cannabis Market Revenue Breakdown (Million, %) by Region 2025 & 2033
- Figure 2: Global Cannabis Market Volume Breakdown (Kiloton, %) by Region 2025 & 2033
- Figure 3: North America Cannabis Market Revenue (Million), by Production Analysis 2025 & 2033
- Figure 4: North America Cannabis Market Volume (Kiloton), by Production Analysis 2025 & 2033
- Figure 5: North America Cannabis Market Revenue Share (%), by Production Analysis 2025 & 2033
- Figure 6: North America Cannabis Market Volume Share (%), by Production Analysis 2025 & 2033
- Figure 7: North America Cannabis Market Revenue (Million), by Consumption Analysis 2025 & 2033
- Figure 8: North America Cannabis Market Volume (Kiloton), by Consumption Analysis 2025 & 2033
- Figure 9: North America Cannabis Market Revenue Share (%), by Consumption Analysis 2025 & 2033
- Figure 10: North America Cannabis Market Volume Share (%), by Consumption Analysis 2025 & 2033
- Figure 11: North America Cannabis Market Revenue (Million), by Import Market Analysis (Value & Volume) 2025 & 2033
- Figure 12: North America Cannabis Market Volume (Kiloton), by Import Market Analysis (Value & Volume) 2025 & 2033
- Figure 13: North America Cannabis Market Revenue Share (%), by Import Market Analysis (Value & Volume) 2025 & 2033
- Figure 14: North America Cannabis Market Volume Share (%), by Import Market Analysis (Value & Volume) 2025 & 2033
- Figure 15: North America Cannabis Market Revenue (Million), by Export Market Analysis (Value & Volume) 2025 & 2033
- Figure 16: North America Cannabis Market Volume (Kiloton), by Export Market Analysis (Value & Volume) 2025 & 2033
- Figure 17: North America Cannabis Market Revenue Share (%), by Export Market Analysis (Value & Volume) 2025 & 2033
- Figure 18: North America Cannabis Market Volume Share (%), by Export Market Analysis (Value & Volume) 2025 & 2033
- Figure 19: North America Cannabis Market Revenue (Million), by Price Trend Analysis 2025 & 2033
- Figure 20: North America Cannabis Market Volume (Kiloton), by Price Trend Analysis 2025 & 2033
- Figure 21: North America Cannabis Market Revenue Share (%), by Price Trend Analysis 2025 & 2033
- Figure 22: North America Cannabis Market Volume Share (%), by Price Trend Analysis 2025 & 2033
- Figure 23: North America Cannabis Market Revenue (Million), by Country 2025 & 2033
- Figure 24: North America Cannabis Market Volume (Kiloton), by Country 2025 & 2033
- Figure 25: North America Cannabis Market Revenue Share (%), by Country 2025 & 2033
- Figure 26: North America Cannabis Market Volume Share (%), by Country 2025 & 2033
- Figure 27: South America Cannabis Market Revenue (Million), by Production Analysis 2025 & 2033
- Figure 28: South America Cannabis Market Volume (Kiloton), by Production Analysis 2025 & 2033
- Figure 29: South America Cannabis Market Revenue Share (%), by Production Analysis 2025 & 2033
- Figure 30: South America Cannabis Market Volume Share (%), by Production Analysis 2025 & 2033
- Figure 31: South America Cannabis Market Revenue (Million), by Consumption Analysis 2025 & 2033
- Figure 32: South America Cannabis Market Volume (Kiloton), by Consumption Analysis 2025 & 2033
- Figure 33: South America Cannabis Market Revenue Share (%), by Consumption Analysis 2025 & 2033
- Figure 34: South America Cannabis Market Volume Share (%), by Consumption Analysis 2025 & 2033
- Figure 35: South America Cannabis Market Revenue (Million), by Import Market Analysis (Value & Volume) 2025 & 2033
- Figure 36: South America Cannabis Market Volume (Kiloton), by Import Market Analysis (Value & Volume) 2025 & 2033
- Figure 37: South America Cannabis Market Revenue Share (%), by Import Market Analysis (Value & Volume) 2025 & 2033
- Figure 38: South America Cannabis Market Volume Share (%), by Import Market Analysis (Value & Volume) 2025 & 2033
- Figure 39: South America Cannabis Market Revenue (Million), by Export Market Analysis (Value & Volume) 2025 & 2033
- Figure 40: South America Cannabis Market Volume (Kiloton), by Export Market Analysis (Value & Volume) 2025 & 2033
- Figure 41: South America Cannabis Market Revenue Share (%), by Export Market Analysis (Value & Volume) 2025 & 2033
- Figure 42: South America Cannabis Market Volume Share (%), by Export Market Analysis (Value & Volume) 2025 & 2033
- Figure 43: South America Cannabis Market Revenue (Million), by Price Trend Analysis 2025 & 2033
- Figure 44: South America Cannabis Market Volume (Kiloton), by Price Trend Analysis 2025 & 2033
- Figure 45: South America Cannabis Market Revenue Share (%), by Price Trend Analysis 2025 & 2033
- Figure 46: South America Cannabis Market Volume Share (%), by Price Trend Analysis 2025 & 2033
- Figure 47: South America Cannabis Market Revenue (Million), by Country 2025 & 2033
- Figure 48: South America Cannabis Market Volume (Kiloton), by Country 2025 & 2033
- Figure 49: South America Cannabis Market Revenue Share (%), by Country 2025 & 2033
- Figure 50: South America Cannabis Market Volume Share (%), by Country 2025 & 2033
- Figure 51: Europe Cannabis Market Revenue (Million), by Production Analysis 2025 & 2033
- Figure 52: Europe Cannabis Market Volume (Kiloton), by Production Analysis 2025 & 2033
- Figure 53: Europe Cannabis Market Revenue Share (%), by Production Analysis 2025 & 2033
- Figure 54: Europe Cannabis Market Volume Share (%), by Production Analysis 2025 & 2033
- Figure 55: Europe Cannabis Market Revenue (Million), by Consumption Analysis 2025 & 2033
- Figure 56: Europe Cannabis Market Volume (Kiloton), by Consumption Analysis 2025 & 2033
- Figure 57: Europe Cannabis Market Revenue Share (%), by Consumption Analysis 2025 & 2033
- Figure 58: Europe Cannabis Market Volume Share (%), by Consumption Analysis 2025 & 2033
- Figure 59: Europe Cannabis Market Revenue (Million), by Import Market Analysis (Value & Volume) 2025 & 2033
- Figure 60: Europe Cannabis Market Volume (Kiloton), by Import Market Analysis (Value & Volume) 2025 & 2033
- Figure 61: Europe Cannabis Market Revenue Share (%), by Import Market Analysis (Value & Volume) 2025 & 2033
- Figure 62: Europe Cannabis Market Volume Share (%), by Import Market Analysis (Value & Volume) 2025 & 2033
- Figure 63: Europe Cannabis Market Revenue (Million), by Export Market Analysis (Value & Volume) 2025 & 2033
- Figure 64: Europe Cannabis Market Volume (Kiloton), by Export Market Analysis (Value & Volume) 2025 & 2033
- Figure 65: Europe Cannabis Market Revenue Share (%), by Export Market Analysis (Value & Volume) 2025 & 2033
- Figure 66: Europe Cannabis Market Volume Share (%), by Export Market Analysis (Value & Volume) 2025 & 2033
- Figure 67: Europe Cannabis Market Revenue (Million), by Price Trend Analysis 2025 & 2033
- Figure 68: Europe Cannabis Market Volume (Kiloton), by Price Trend Analysis 2025 & 2033
- Figure 69: Europe Cannabis Market Revenue Share (%), by Price Trend Analysis 2025 & 2033
- Figure 70: Europe Cannabis Market Volume Share (%), by Price Trend Analysis 2025 & 2033
- Figure 71: Europe Cannabis Market Revenue (Million), by Country 2025 & 2033
- Figure 72: Europe Cannabis Market Volume (Kiloton), by Country 2025 & 2033
- Figure 73: Europe Cannabis Market Revenue Share (%), by Country 2025 & 2033
- Figure 74: Europe Cannabis Market Volume Share (%), by Country 2025 & 2033
- Figure 75: Middle East & Africa Cannabis Market Revenue (Million), by Production Analysis 2025 & 2033
- Figure 76: Middle East & Africa Cannabis Market Volume (Kiloton), by Production Analysis 2025 & 2033
- Figure 77: Middle East & Africa Cannabis Market Revenue Share (%), by Production Analysis 2025 & 2033
- Figure 78: Middle East & Africa Cannabis Market Volume Share (%), by Production Analysis 2025 & 2033
- Figure 79: Middle East & Africa Cannabis Market Revenue (Million), by Consumption Analysis 2025 & 2033
- Figure 80: Middle East & Africa Cannabis Market Volume (Kiloton), by Consumption Analysis 2025 & 2033
- Figure 81: Middle East & Africa Cannabis Market Revenue Share (%), by Consumption Analysis 2025 & 2033
- Figure 82: Middle East & Africa Cannabis Market Volume Share (%), by Consumption Analysis 2025 & 2033
- Figure 83: Middle East & Africa Cannabis Market Revenue (Million), by Import Market Analysis (Value & Volume) 2025 & 2033
- Figure 84: Middle East & Africa Cannabis Market Volume (Kiloton), by Import Market Analysis (Value & Volume) 2025 & 2033
- Figure 85: Middle East & Africa Cannabis Market Revenue Share (%), by Import Market Analysis (Value & Volume) 2025 & 2033
- Figure 86: Middle East & Africa Cannabis Market Volume Share (%), by Import Market Analysis (Value & Volume) 2025 & 2033
- Figure 87: Middle East & Africa Cannabis Market Revenue (Million), by Export Market Analysis (Value & Volume) 2025 & 2033
- Figure 88: Middle East & Africa Cannabis Market Volume (Kiloton), by Export Market Analysis (Value & Volume) 2025 & 2033
- Figure 89: Middle East & Africa Cannabis Market Revenue Share (%), by Export Market Analysis (Value & Volume) 2025 & 2033
- Figure 90: Middle East & Africa Cannabis Market Volume Share (%), by Export Market Analysis (Value & Volume) 2025 & 2033
- Figure 91: Middle East & Africa Cannabis Market Revenue (Million), by Price Trend Analysis 2025 & 2033
- Figure 92: Middle East & Africa Cannabis Market Volume (Kiloton), by Price Trend Analysis 2025 & 2033
- Figure 93: Middle East & Africa Cannabis Market Revenue Share (%), by Price Trend Analysis 2025 & 2033
- Figure 94: Middle East & Africa Cannabis Market Volume Share (%), by Price Trend Analysis 2025 & 2033
- Figure 95: Middle East & Africa Cannabis Market Revenue (Million), by Country 2025 & 2033
- Figure 96: Middle East & Africa Cannabis Market Volume (Kiloton), by Country 2025 & 2033
- Figure 97: Middle East & Africa Cannabis Market Revenue Share (%), by Country 2025 & 2033
- Figure 98: Middle East & Africa Cannabis Market Volume Share (%), by Country 2025 & 2033
- Figure 99: Asia Pacific Cannabis Market Revenue (Million), by Production Analysis 2025 & 2033
- Figure 100: Asia Pacific Cannabis Market Volume (Kiloton), by Production Analysis 2025 & 2033
- Figure 101: Asia Pacific Cannabis Market Revenue Share (%), by Production Analysis 2025 & 2033
- Figure 102: Asia Pacific Cannabis Market Volume Share (%), by Production Analysis 2025 & 2033
- Figure 103: Asia Pacific Cannabis Market Revenue (Million), by Consumption Analysis 2025 & 2033
- Figure 104: Asia Pacific Cannabis Market Volume (Kiloton), by Consumption Analysis 2025 & 2033
- Figure 105: Asia Pacific Cannabis Market Revenue Share (%), by Consumption Analysis 2025 & 2033
- Figure 106: Asia Pacific Cannabis Market Volume Share (%), by Consumption Analysis 2025 & 2033
- Figure 107: Asia Pacific Cannabis Market Revenue (Million), by Import Market Analysis (Value & Volume) 2025 & 2033
- Figure 108: Asia Pacific Cannabis Market Volume (Kiloton), by Import Market Analysis (Value & Volume) 2025 & 2033
- Figure 109: Asia Pacific Cannabis Market Revenue Share (%), by Import Market Analysis (Value & Volume) 2025 & 2033
- Figure 110: Asia Pacific Cannabis Market Volume Share (%), by Import Market Analysis (Value & Volume) 2025 & 2033
- Figure 111: Asia Pacific Cannabis Market Revenue (Million), by Export Market Analysis (Value & Volume) 2025 & 2033
- Figure 112: Asia Pacific Cannabis Market Volume (Kiloton), by Export Market Analysis (Value & Volume) 2025 & 2033
- Figure 113: Asia Pacific Cannabis Market Revenue Share (%), by Export Market Analysis (Value & Volume) 2025 & 2033
- Figure 114: Asia Pacific Cannabis Market Volume Share (%), by Export Market Analysis (Value & Volume) 2025 & 2033
- Figure 115: Asia Pacific Cannabis Market Revenue (Million), by Price Trend Analysis 2025 & 2033
- Figure 116: Asia Pacific Cannabis Market Volume (Kiloton), by Price Trend Analysis 2025 & 2033
- Figure 117: Asia Pacific Cannabis Market Revenue Share (%), by Price Trend Analysis 2025 & 2033
- Figure 118: Asia Pacific Cannabis Market Volume Share (%), by Price Trend Analysis 2025 & 2033
- Figure 119: Asia Pacific Cannabis Market Revenue (Million), by Country 2025 & 2033
- Figure 120: Asia Pacific Cannabis Market Volume (Kiloton), by Country 2025 & 2033
- Figure 121: Asia Pacific Cannabis Market Revenue Share (%), by Country 2025 & 2033
- Figure 122: Asia Pacific Cannabis Market Volume Share (%), by Country 2025 & 2033
List of Tables
- Table 1: Global Cannabis Market Revenue Million Forecast, by Production Analysis 2020 & 2033
- Table 2: Global Cannabis Market Volume Kiloton Forecast, by Production Analysis 2020 & 2033
- Table 3: Global Cannabis Market Revenue Million Forecast, by Consumption Analysis 2020 & 2033
- Table 4: Global Cannabis Market Volume Kiloton Forecast, by Consumption Analysis 2020 & 2033
- Table 5: Global Cannabis Market Revenue Million Forecast, by Import Market Analysis (Value & Volume) 2020 & 2033
- Table 6: Global Cannabis Market Volume Kiloton Forecast, by Import Market Analysis (Value & Volume) 2020 & 2033
- Table 7: Global Cannabis Market Revenue Million Forecast, by Export Market Analysis (Value & Volume) 2020 & 2033
- Table 8: Global Cannabis Market Volume Kiloton Forecast, by Export Market Analysis (Value & Volume) 2020 & 2033
- Table 9: Global Cannabis Market Revenue Million Forecast, by Price Trend Analysis 2020 & 2033
- Table 10: Global Cannabis Market Volume Kiloton Forecast, by Price Trend Analysis 2020 & 2033
- Table 11: Global Cannabis Market Revenue Million Forecast, by Region 2020 & 2033
- Table 12: Global Cannabis Market Volume Kiloton Forecast, by Region 2020 & 2033
- Table 13: Global Cannabis Market Revenue Million Forecast, by Production Analysis 2020 & 2033
- Table 14: Global Cannabis Market Volume Kiloton Forecast, by Production Analysis 2020 & 2033
- Table 15: Global Cannabis Market Revenue Million Forecast, by Consumption Analysis 2020 & 2033
- Table 16: Global Cannabis Market Volume Kiloton Forecast, by Consumption Analysis 2020 & 2033
- Table 17: Global Cannabis Market Revenue Million Forecast, by Import Market Analysis (Value & Volume) 2020 & 2033
- Table 18: Global Cannabis Market Volume Kiloton Forecast, by Import Market Analysis (Value & Volume) 2020 & 2033
- Table 19: Global Cannabis Market Revenue Million Forecast, by Export Market Analysis (Value & Volume) 2020 & 2033
- Table 20: Global Cannabis Market Volume Kiloton Forecast, by Export Market Analysis (Value & Volume) 2020 & 2033
- Table 21: Global Cannabis Market Revenue Million Forecast, by Price Trend Analysis 2020 & 2033
- Table 22: Global Cannabis Market Volume Kiloton Forecast, by Price Trend Analysis 2020 & 2033
- Table 23: Global Cannabis Market Revenue Million Forecast, by Country 2020 & 2033
- Table 24: Global Cannabis Market Volume Kiloton Forecast, by Country 2020 & 2033
- Table 25: United States Cannabis Market Revenue (Million) Forecast, by Application 2020 & 2033
- Table 26: United States Cannabis Market Volume (Kiloton) Forecast, by Application 2020 & 2033
- Table 27: Canada Cannabis Market Revenue (Million) Forecast, by Application 2020 & 2033
- Table 28: Canada Cannabis Market Volume (Kiloton) Forecast, by Application 2020 & 2033
- Table 29: Mexico Cannabis Market Revenue (Million) Forecast, by Application 2020 & 2033
- Table 30: Mexico Cannabis Market Volume (Kiloton) Forecast, by Application 2020 & 2033
- Table 31: Global Cannabis Market Revenue Million Forecast, by Production Analysis 2020 & 2033
- Table 32: Global Cannabis Market Volume Kiloton Forecast, by Production Analysis 2020 & 2033
- Table 33: Global Cannabis Market Revenue Million Forecast, by Consumption Analysis 2020 & 2033
- Table 34: Global Cannabis Market Volume Kiloton Forecast, by Consumption Analysis 2020 & 2033
- Table 35: Global Cannabis Market Revenue Million Forecast, by Import Market Analysis (Value & Volume) 2020 & 2033
- Table 36: Global Cannabis Market Volume Kiloton Forecast, by Import Market Analysis (Value & Volume) 2020 & 2033
- Table 37: Global Cannabis Market Revenue Million Forecast, by Export Market Analysis (Value & Volume) 2020 & 2033
- Table 38: Global Cannabis Market Volume Kiloton Forecast, by Export Market Analysis (Value & Volume) 2020 & 2033
- Table 39: Global Cannabis Market Revenue Million Forecast, by Price Trend Analysis 2020 & 2033
- Table 40: Global Cannabis Market Volume Kiloton Forecast, by Price Trend Analysis 2020 & 2033
- Table 41: Global Cannabis Market Revenue Million Forecast, by Country 2020 & 2033
- Table 42: Global Cannabis Market Volume Kiloton Forecast, by Country 2020 & 2033
- Table 43: Brazil Cannabis Market Revenue (Million) Forecast, by Application 2020 & 2033
- Table 44: Brazil Cannabis Market Volume (Kiloton) Forecast, by Application 2020 & 2033
- Table 45: Argentina Cannabis Market Revenue (Million) Forecast, by Application 2020 & 2033
- Table 46: Argentina Cannabis Market Volume (Kiloton) Forecast, by Application 2020 & 2033
- Table 47: Rest of South America Cannabis Market Revenue (Million) Forecast, by Application 2020 & 2033
- Table 48: Rest of South America Cannabis Market Volume (Kiloton) Forecast, by Application 2020 & 2033
- Table 49: Global Cannabis Market Revenue Million Forecast, by Production Analysis 2020 & 2033
- Table 50: Global Cannabis Market Volume Kiloton Forecast, by Production Analysis 2020 & 2033
- Table 51: Global Cannabis Market Revenue Million Forecast, by Consumption Analysis 2020 & 2033
- Table 52: Global Cannabis Market Volume Kiloton Forecast, by Consumption Analysis 2020 & 2033
- Table 53: Global Cannabis Market Revenue Million Forecast, by Import Market Analysis (Value & Volume) 2020 & 2033
- Table 54: Global Cannabis Market Volume Kiloton Forecast, by Import Market Analysis (Value & Volume) 2020 & 2033
- Table 55: Global Cannabis Market Revenue Million Forecast, by Export Market Analysis (Value & Volume) 2020 & 2033
- Table 56: Global Cannabis Market Volume Kiloton Forecast, by Export Market Analysis (Value & Volume) 2020 & 2033
- Table 57: Global Cannabis Market Revenue Million Forecast, by Price Trend Analysis 2020 & 2033
- Table 58: Global Cannabis Market Volume Kiloton Forecast, by Price Trend Analysis 2020 & 2033
- Table 59: Global Cannabis Market Revenue Million Forecast, by Country 2020 & 2033
- Table 60: Global Cannabis Market Volume Kiloton Forecast, by Country 2020 & 2033
- Table 61: United Kingdom Cannabis Market Revenue (Million) Forecast, by Application 2020 & 2033
- Table 62: United Kingdom Cannabis Market Volume (Kiloton) Forecast, by Application 2020 & 2033
- Table 63: Germany Cannabis Market Revenue (Million) Forecast, by Application 2020 & 2033
- Table 64: Germany Cannabis Market Volume (Kiloton) Forecast, by Application 2020 & 2033
- Table 65: France Cannabis Market Revenue (Million) Forecast, by Application 2020 & 2033
- Table 66: France Cannabis Market Volume (Kiloton) Forecast, by Application 2020 & 2033
- Table 67: Italy Cannabis Market Revenue (Million) Forecast, by Application 2020 & 2033
- Table 68: Italy Cannabis Market Volume (Kiloton) Forecast, by Application 2020 & 2033
- Table 69: Spain Cannabis Market Revenue (Million) Forecast, by Application 2020 & 2033
- Table 70: Spain Cannabis Market Volume (Kiloton) Forecast, by Application 2020 & 2033
- Table 71: Russia Cannabis Market Revenue (Million) Forecast, by Application 2020 & 2033
- Table 72: Russia Cannabis Market Volume (Kiloton) Forecast, by Application 2020 & 2033
- Table 73: Benelux Cannabis Market Revenue (Million) Forecast, by Application 2020 & 2033
- Table 74: Benelux Cannabis Market Volume (Kiloton) Forecast, by Application 2020 & 2033
- Table 75: Nordics Cannabis Market Revenue (Million) Forecast, by Application 2020 & 2033
- Table 76: Nordics Cannabis Market Volume (Kiloton) Forecast, by Application 2020 & 2033
- Table 77: Rest of Europe Cannabis Market Revenue (Million) Forecast, by Application 2020 & 2033
- Table 78: Rest of Europe Cannabis Market Volume (Kiloton) Forecast, by Application 2020 & 2033
- Table 79: Global Cannabis Market Revenue Million Forecast, by Production Analysis 2020 & 2033
- Table 80: Global Cannabis Market Volume Kiloton Forecast, by Production Analysis 2020 & 2033
- Table 81: Global Cannabis Market Revenue Million Forecast, by Consumption Analysis 2020 & 2033
- Table 82: Global Cannabis Market Volume Kiloton Forecast, by Consumption Analysis 2020 & 2033
- Table 83: Global Cannabis Market Revenue Million Forecast, by Import Market Analysis (Value & Volume) 2020 & 2033
- Table 84: Global Cannabis Market Volume Kiloton Forecast, by Import Market Analysis (Value & Volume) 2020 & 2033
- Table 85: Global Cannabis Market Revenue Million Forecast, by Export Market Analysis (Value & Volume) 2020 & 2033
- Table 86: Global Cannabis Market Volume Kiloton Forecast, by Export Market Analysis (Value & Volume) 2020 & 2033
- Table 87: Global Cannabis Market Revenue Million Forecast, by Price Trend Analysis 2020 & 2033
- Table 88: Global Cannabis Market Volume Kiloton Forecast, by Price Trend Analysis 2020 & 2033
- Table 89: Global Cannabis Market Revenue Million Forecast, by Country 2020 & 2033
- Table 90: Global Cannabis Market Volume Kiloton Forecast, by Country 2020 & 2033
- Table 91: Turkey Cannabis Market Revenue (Million) Forecast, by Application 2020 & 2033
- Table 92: Turkey Cannabis Market Volume (Kiloton) Forecast, by Application 2020 & 2033
- Table 93: Israel Cannabis Market Revenue (Million) Forecast, by Application 2020 & 2033
- Table 94: Israel Cannabis Market Volume (Kiloton) Forecast, by Application 2020 & 2033
- Table 95: GCC Cannabis Market Revenue (Million) Forecast, by Application 2020 & 2033
- Table 96: GCC Cannabis Market Volume (Kiloton) Forecast, by Application 2020 & 2033
- Table 97: North Africa Cannabis Market Revenue (Million) Forecast, by Application 2020 & 2033
- Table 98: North Africa Cannabis Market Volume (Kiloton) Forecast, by Application 2020 & 2033
- Table 99: South Africa Cannabis Market Revenue (Million) Forecast, by Application 2020 & 2033
- Table 100: South Africa Cannabis Market Volume (Kiloton) Forecast, by Application 2020 & 2033
- Table 101: Rest of Middle East & Africa Cannabis Market Revenue (Million) Forecast, by Application 2020 & 2033
- Table 102: Rest of Middle East & Africa Cannabis Market Volume (Kiloton) Forecast, by Application 2020 & 2033
- Table 103: Global Cannabis Market Revenue Million Forecast, by Production Analysis 2020 & 2033
- Table 104: Global Cannabis Market Volume Kiloton Forecast, by Production Analysis 2020 & 2033
- Table 105: Global Cannabis Market Revenue Million Forecast, by Consumption Analysis 2020 & 2033
- Table 106: Global Cannabis Market Volume Kiloton Forecast, by Consumption Analysis 2020 & 2033
- Table 107: Global Cannabis Market Revenue Million Forecast, by Import Market Analysis (Value & Volume) 2020 & 2033
- Table 108: Global Cannabis Market Volume Kiloton Forecast, by Import Market Analysis (Value & Volume) 2020 & 2033
- Table 109: Global Cannabis Market Revenue Million Forecast, by Export Market Analysis (Value & Volume) 2020 & 2033
- Table 110: Global Cannabis Market Volume Kiloton Forecast, by Export Market Analysis (Value & Volume) 2020 & 2033
- Table 111: Global Cannabis Market Revenue Million Forecast, by Price Trend Analysis 2020 & 2033
- Table 112: Global Cannabis Market Volume Kiloton Forecast, by Price Trend Analysis 2020 & 2033
- Table 113: Global Cannabis Market Revenue Million Forecast, by Country 2020 & 2033
- Table 114: Global Cannabis Market Volume Kiloton Forecast, by Country 2020 & 2033
- Table 115: China Cannabis Market Revenue (Million) Forecast, by Application 2020 & 2033
- Table 116: China Cannabis Market Volume (Kiloton) Forecast, by Application 2020 & 2033
- Table 117: India Cannabis Market Revenue (Million) Forecast, by Application 2020 & 2033
- Table 118: India Cannabis Market Volume (Kiloton) Forecast, by Application 2020 & 2033
- Table 119: Japan Cannabis Market Revenue (Million) Forecast, by Application 2020 & 2033
- Table 120: Japan Cannabis Market Volume (Kiloton) Forecast, by Application 2020 & 2033
- Table 121: South Korea Cannabis Market Revenue (Million) Forecast, by Application 2020 & 2033
- Table 122: South Korea Cannabis Market Volume (Kiloton) Forecast, by Application 2020 & 2033
- Table 123: ASEAN Cannabis Market Revenue (Million) Forecast, by Application 2020 & 2033
- Table 124: ASEAN Cannabis Market Volume (Kiloton) Forecast, by Application 2020 & 2033
- Table 125: Oceania Cannabis Market Revenue (Million) Forecast, by Application 2020 & 2033
- Table 126: Oceania Cannabis Market Volume (Kiloton) Forecast, by Application 2020 & 2033
- Table 127: Rest of Asia Pacific Cannabis Market Revenue (Million) Forecast, by Application 2020 & 2033
- Table 128: Rest of Asia Pacific Cannabis Market Volume (Kiloton) Forecast, by Application 2020 & 2033
Frequently Asked Questions
1. What is the projected Compound Annual Growth Rate (CAGR) of the Cannabis Market?
The projected CAGR is approximately 15.40%.
2. Which companies are prominent players in the Cannabis Market?
Key companies in the market include Delta 9 Cannabis, Canopy Growth Corp, Vivo Cannabis*List Not Exhaustive, Cannimed Therapeutics Inc, GW Pharmaceuticals PLC, Aphria Inc, Tilray, CV Sciences Inc, MedReLeaf Corp, Aurora Cannabis Inc.
3. What are the main segments of the Cannabis Market?
The market segments include Production Analysis, Consumption Analysis, Import Market Analysis (Value & Volume), Export Market Analysis (Value & Volume), Price Trend Analysis.
4. Can you provide details about the market size?
The market size is estimated to be USD 33.84 Million as of 2022.
5. What are some drivers contributing to market growth?
Increasing Legalization of Cannabis; Growing Focus on Health Benefits of Cannabis.
6. What are the notable trends driving market growth?
Legalization of Cannabis.
7. Are there any restraints impacting market growth?
Lack of Data on Dosages and Results; Lack of Access to Financial Assistance.
8. Can you provide examples of recent developments in the market?
May 2023: Toast and Nirvana Group formed a partnership to introduce innovative products for patients and consumers in Oklahoma and New Mexico.
9. What pricing options are available for accessing the report?
Pricing options include single-user, multi-user, and enterprise licenses priced at USD 4750, USD 5250, and USD 8750 respectively.
10. Is the market size provided in terms of value or volume?
The market size is provided in terms of value, measured in Million and volume, measured in Kiloton.
11. Are there any specific market keywords associated with the report?
Yes, the market keyword associated with the report is "Cannabis Market," which aids in identifying and referencing the specific market segment covered.
12. How do I determine which pricing option suits my needs best?
The pricing options vary based on user requirements and access needs. Individual users may opt for single-user licenses, while businesses requiring broader access may choose multi-user or enterprise licenses for cost-effective access to the report.
13. Are there any additional resources or data provided in the Cannabis Market report?
While the report offers comprehensive insights, it's advisable to review the specific contents or supplementary materials provided to ascertain if additional resources or data are available.
14. How can I stay updated on further developments or reports in the Cannabis Market?
To stay informed about further developments, trends, and reports in the Cannabis Market, consider subscribing to industry newsletters, following relevant companies and organizations, or regularly checking reputable industry news sources and publications.
Methodology
Step 1 - Identification of Relevant Samples Size from Population Database


Step 2 - Approaches for Defining Global Market Size (Value, Volume* & Price*)

Note*: In applicable scenarios
Step 3 - Data Sources
Primary Research
- Web Analytics
- Survey Reports
- Research Institute
- Latest Research Reports
- Opinion Leaders
Secondary Research
- Annual Reports
- White Paper
- Latest Press Release
- Industry Association
- Paid Database
- Investor Presentations

Step 4 - Data Triangulation
Involves using different sources of information in order to increase the validity of a study
These sources are likely to be stakeholders in a program - participants, other researchers, program staff, other community members, and so on.
Then we put all data in single framework & apply various statistical tools to find out the dynamic on the market.
During the analysis stage, feedback from the stakeholder groups would be compared to determine areas of agreement as well as areas of divergence