

Key Insights
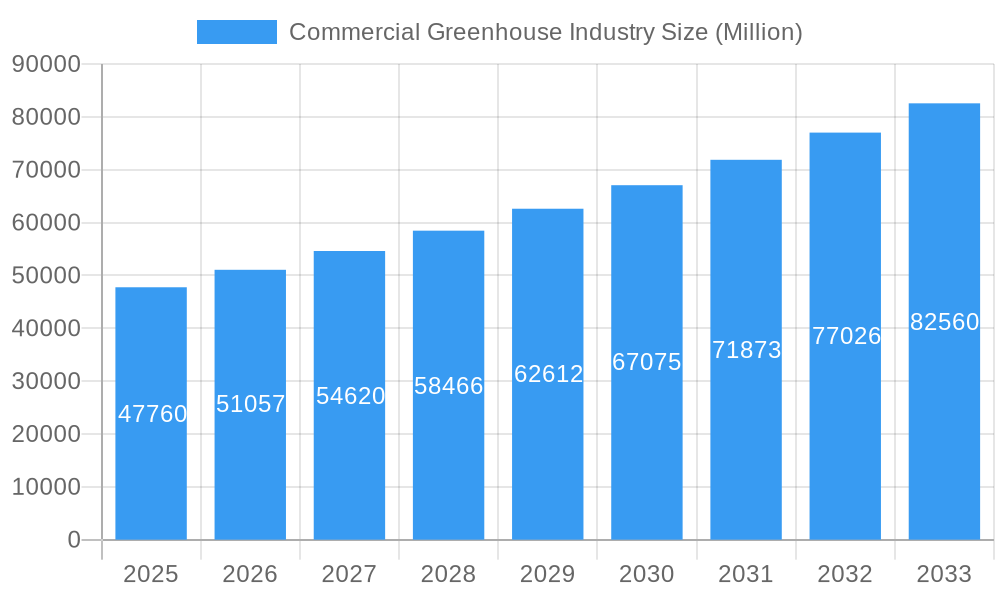
The commercial greenhouse industry, valued at $47.76 billion in 2025, is experiencing robust growth, projected to expand at a compound annual growth rate (CAGR) of 7% from 2025 to 2033. This expansion is driven by several key factors. Increasing consumer demand for fresh, locally sourced produce is fueling the need for efficient and technologically advanced greenhouse operations. Furthermore, advancements in greenhouse technology, such as automated climate control systems, energy-efficient lighting solutions (LEDs), and sophisticated irrigation techniques, are significantly improving yields and reducing operational costs. The growing adoption of vertical farming and hydroponics within greenhouses further contributes to market growth, offering higher production densities and reduced land requirements. Government initiatives promoting sustainable agriculture and food security also play a vital role in fostering industry expansion. The segment breakdown reveals a diverse market, with glass greenhouses holding a significant share due to their durability and light transmission capabilities, while plastic greenhouses are favored for cost-effectiveness. Heating and cooling systems constitute major equipment segments, reflecting the critical role of climate control in optimizing plant growth. Horticultural crops, including fruits, vegetables, and flowers, dominate crop types, underpinning the industry's focus on food production and ornamental horticulture. Key players like Lumigrow, Certhon, and Richel Group are driving innovation and market competition. Regional analysis suggests that North America and Europe currently hold substantial market shares, although the Asia-Pacific region is poised for significant growth driven by increasing agricultural investments and rising consumer incomes.
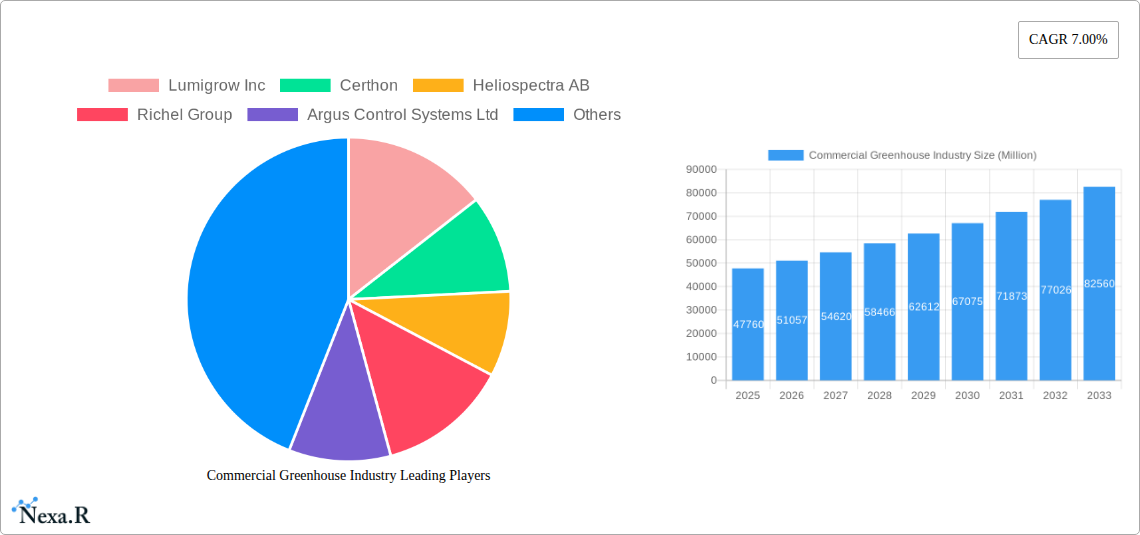
Commercial Greenhouse Industry Market Size (In Billion)
The competitive landscape is marked by both established players and emerging technology companies. Established greenhouse manufacturers are focusing on expanding their product portfolios to include advanced technologies, while newer companies are entering the market with innovative solutions, particularly in areas like precision agriculture and data analytics. This combination of established players and innovative entrants fosters a dynamic environment with continuous improvements in technology and efficiency. The market's growth trajectory is expected to continue, driven by increasing demand for sustainable food production, technological advancements, and supportive government policies. However, challenges such as high initial investment costs, dependence on energy resources, and potential environmental concerns related to water and energy consumption must be addressed for sustained and responsible industry growth.
Commercial Greenhouse Industry Company Market Share
Commercial Greenhouse Industry Market Report: 2019-2033
This comprehensive report provides an in-depth analysis of the Commercial Greenhouse Industry, encompassing market dynamics, growth trends, regional segmentation, product landscape, key players, and future outlook. With a study period spanning 2019-2033 (base year 2025, forecast period 2025-2033), this report is an essential resource for industry professionals, investors, and strategic decision-makers. The report covers key parent markets such as Agriculture and Horticulture and child markets including Glass Greenhouses, Plastic Greenhouses, and various crop types. The market size is valued in Million units.
Commercial Greenhouse Industry Market Dynamics & Structure
This section analyzes the competitive landscape of the commercial greenhouse industry, encompassing market concentration, technological innovation, regulatory frameworks, and M&A activities. The global commercial greenhouse market is characterized by a moderately concentrated structure with several significant players holding substantial market share. Technological innovation, driven by factors such as automation, precision agriculture and data analytics, is a key growth driver. Stringent environmental regulations and increasing consumer demand for sustainably produced food are shaping the industry's trajectory.
- Market Concentration: The top 5 players hold approximately xx% of the market share (2024).
- Technological Innovation: Adoption of AI, IoT, and automation technologies continues to accelerate, pushing market growth.
- Regulatory Framework: Government policies promoting sustainable agriculture and food security are significantly impacting the industry.
- Competitive Substitutes: Hydroponics and vertical farming represent alternative technologies with varying levels of competition.
- End-User Demographics: The primary end-users are commercial growers, agricultural businesses, and food retailers.
- M&A Trends: xx M&A deals were recorded in the historical period, with an estimated xx million USD total transaction value. Strategic partnerships are becoming increasingly common to enhance technological capabilities and expand market reach. Innovation barriers include high initial investment costs for advanced technologies and a skills gap within the workforce.
Commercial Greenhouse Industry Growth Trends & Insights
The global commercial greenhouse market exhibited strong growth during the historical period (2019-2024), reaching a value of xx million units in 2024. This growth is anticipated to continue during the forecast period (2025-2033), with a projected CAGR of xx%. Increased demand for fresh produce, coupled with advancements in greenhouse technology and automation, are the primary drivers of this growth. The adoption rate of advanced technologies, such as climate control systems and automated irrigation, is steadily increasing, further enhancing market expansion. Consumer preference shifts towards locally sourced and sustainably grown food are also contributing factors. Market penetration of advanced technologies is estimated at xx% in 2024 and is projected to reach xx% by 2033.
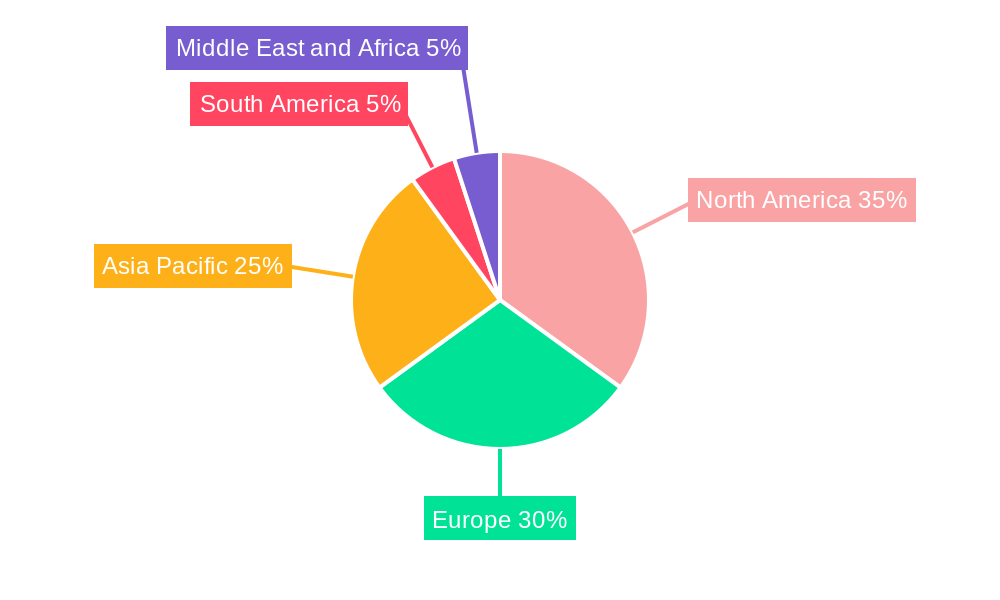
Dominant Regions, Countries, or Segments in Commercial Greenhouse Industry
North America and Europe currently dominate the commercial greenhouse market, accounting for a combined xx% market share in 2024. However, regions like Asia-Pacific are witnessing rapid growth driven by rising agricultural demands and supportive government initiatives. Within the segments, glass greenhouses maintain a larger market share compared to plastic greenhouses due to their durability and suitability for year-round cultivation. However, plastic greenhouses are gaining traction due to lower initial investment costs. The heating systems segment holds significant market share within equipment types, followed by cooling systems and other equipment like lighting and automation solutions. Horticulture crops, specifically tomatoes and leafy greens, comprise the largest segment within crop types.
- Key Drivers (North America): Strong consumer demand for fresh produce, favorable government policies.
- Key Drivers (Europe): Established agricultural infrastructure, technological advancements.
- Key Drivers (Asia-Pacific): Rapid economic growth, increasing urbanization, supportive government policies.
- Glass Greenhouses: Superior climate control and durability lead to higher market share, but initial investments are high.
- Plastic Greenhouses: Lower cost and ease of installation drive growth, particularly in developing economies.
- Horticulture Crops: High consumer demand and profitability ensure dominance in the crop segment.
Commercial Greenhouse Industry Product Landscape
The commercial greenhouse industry offers a diverse range of products, including advanced climate control systems, automated irrigation systems, lighting solutions, and software for precision agriculture. Recent innovations focus on enhancing energy efficiency, optimizing resource utilization, and improving crop yields. Key features include smart sensors, data analytics platforms, and robotic systems for automation. The unique selling propositions for many products include reduced operating costs, increased productivity, and enhanced crop quality.
Key Drivers, Barriers & Challenges in Commercial Greenhouse Industry
Key Drivers: Rising consumer demand for fresh produce, technological advancements improving efficiency and yields, favorable government policies promoting sustainable agriculture, increasing investments in agricultural technology.
Challenges: High initial investment costs for advanced technologies, fluctuating energy prices, dependence on reliable water resources, skilled labor shortages, supply chain disruptions due to global events, and intense competition from established players. These factors lead to significant economic challenges for smaller greenhouse operations.
Emerging Opportunities in Commercial Greenhouse Industry
Emerging opportunities include the expansion into untapped markets (e.g., Africa, South America), the development of vertical farming and indoor agriculture technologies, and the increasing integration of renewable energy sources into greenhouse operations. The growing interest in organic and sustainably grown produce presents significant growth potential for commercial greenhouse operators adopting eco-friendly practices.
Growth Accelerators in the Commercial Greenhouse Industry Industry
Technological advancements such as AI-powered crop monitoring and robotic automation are significant growth catalysts. Strategic partnerships between greenhouse operators and technology providers are accelerating innovation and market penetration. Expansion into new geographical regions with favorable growing conditions and strong consumer demand further accelerates market growth.
Key Players Shaping the Commercial Greenhouse Industry Market
- Lumigrow Inc
- Certhon
- Heliospectra AB
- Richel Group
- Argus Control Systems Ltd
- Agra Tech Inc
- Rough Brothers Inc
- Logiqs BV
- International Greenhouse Company
- Gibraltar Industries (Nexus Corporation)
Notable Milestones in Commercial Greenhouse Industry Sector
- September 2023: Richel Group enters a three-year strategic partnership to enhance its high-tech greenhouse construction capabilities in challenging climates. This significantly expands their reach into new markets.
- June 2023: Certhon and Living Greens Farm partner to globally expand aeroponic growing technology, leveraging Certhon's expertise and network. This collaboration could redefine growing practices and market accessibility.
- February 2023: Heliospectra AB launches MITRA Flex, a flexible far-red light solution, offering customizable spectral control for optimized plant growth. This product innovation enhances the market's lighting technology options.
In-Depth Commercial Greenhouse Industry Market Outlook
The commercial greenhouse industry is poised for continued robust growth driven by technological innovation, evolving consumer preferences, and strategic investments. The increasing adoption of sustainable practices and the exploration of new cultivation methods present considerable opportunities for market expansion. Focus on technological advancements, strategic partnerships, and market diversification will shape the future competitive landscape. The predicted market value in 2033 is estimated to be xx million units.
Commercial Greenhouse Industry Segmentation
- 1. Production Analysis
- 2. Consumption Analysis
- 3. Import Market Analysis (Value & Volume)
- 4. Export Market Analysis (Value & Volume)
- 5. Price Trend Analysis
Commercial Greenhouse Industry Segmentation By Geography
-
1. North America
- 1.1. United States
- 1.2. Canada
- 1.3. Mexico
-
2. South America
- 2.1. Brazil
- 2.2. Argentina
- 2.3. Rest of South America
-
3. Europe
- 3.1. United Kingdom
- 3.2. Germany
- 3.3. France
- 3.4. Italy
- 3.5. Spain
- 3.6. Russia
- 3.7. Benelux
- 3.8. Nordics
- 3.9. Rest of Europe
-
4. Middle East & Africa
- 4.1. Turkey
- 4.2. Israel
- 4.3. GCC
- 4.4. North Africa
- 4.5. South Africa
- 4.6. Rest of Middle East & Africa
-
5. Asia Pacific
- 5.1. China
- 5.2. India
- 5.3. Japan
- 5.4. South Korea
- 5.5. ASEAN
- 5.6. Oceania
- 5.7. Rest of Asia Pacific
Commercial Greenhouse Industry Regional Market Share
Geographic Coverage of Commercial Greenhouse Industry
Commercial Greenhouse Industry REPORT HIGHLIGHTS
| Aspects | Details |
|---|---|
| Study Period | 2020-2034 |
| Base Year | 2025 |
| Estimated Year | 2026 |
| Forecast Period | 2026-2034 |
| Historical Period | 2020-2025 |
| Growth Rate | CAGR of 7.00% from 2020-2034 |
| Segmentation |
|
Table of Contents
- 1. Introduction
- 1.1. Research Scope
- 1.2. Market Segmentation
- 1.3. Research Objective
- 1.4. Definitions and Assumptions
- 2. Executive Summary
- 2.1. Market Snapshot
- 3. Market Dynamics
- 3.1. Market Drivers
- 3.2. Market Restrains
- 3.3. Market Trends
- 3.4. Market Opportunities
- 4. Market Factor Analysis
- 4.1. Porters Five Forces
- 4.1.1. Bargaining Power of Suppliers
- 4.1.2. Bargaining Power of Buyers
- 4.1.3. Threat of New Entrants
- 4.1.4. Threat of Substitutes
- 4.1.5. Competitive Rivalry
- 4.2. PESTEL analysis
- 4.3. BCG Analysis
- 4.3.1. Stars (High Growth, High Market Share)
- 4.3.2. Cash Cows (Low Growth, High Market Share)
- 4.3.3. Question Mark (High Growth, Low Market Share)
- 4.3.4. Dogs (Low Growth, Low Market Share)
- 4.4. Ansoff Matrix Analysis
- 4.5. Supply Chain Analysis
- 4.6. Regulatory Landscape
- 4.7. Current Market Potential and Opportunity Assessment (TAM–SAM–SOM Framework)
- 4.8. NRP Analyst Note
- 4.1. Porters Five Forces
- 5. Market Analysis, Insights and Forecast 2021-2033
- 5.1. Market Analysis, Insights and Forecast - by Production Analysis
- 5.2. Market Analysis, Insights and Forecast - by Consumption Analysis
- 5.3. Market Analysis, Insights and Forecast - by Import Market Analysis (Value & Volume)
- 5.4. Market Analysis, Insights and Forecast - by Export Market Analysis (Value & Volume)
- 5.5. Market Analysis, Insights and Forecast - by Price Trend Analysis
- 5.6. Market Analysis, Insights and Forecast - by Region
- 5.6.1. North America
- 5.6.2. South America
- 5.6.3. Europe
- 5.6.4. Middle East & Africa
- 5.6.5. Asia Pacific
- 6. Global Commercial Greenhouse Industry Analysis, Insights and Forecast, 2021-2033
- 6.1. Market Analysis, Insights and Forecast - by Production Analysis
- 6.2. Market Analysis, Insights and Forecast - by Consumption Analysis
- 6.3. Market Analysis, Insights and Forecast - by Import Market Analysis (Value & Volume)
- 6.4. Market Analysis, Insights and Forecast - by Export Market Analysis (Value & Volume)
- 6.5. Market Analysis, Insights and Forecast - by Price Trend Analysis
- 7. North America Commercial Greenhouse Industry Analysis, Insights and Forecast, 2020-2032
- 7.1. Market Analysis, Insights and Forecast - by Production Analysis
- 7.2. Market Analysis, Insights and Forecast - by Consumption Analysis
- 7.3. Market Analysis, Insights and Forecast - by Import Market Analysis (Value & Volume)
- 7.4. Market Analysis, Insights and Forecast - by Export Market Analysis (Value & Volume)
- 7.5. Market Analysis, Insights and Forecast - by Price Trend Analysis
- 8. South America Commercial Greenhouse Industry Analysis, Insights and Forecast, 2020-2032
- 8.1. Market Analysis, Insights and Forecast - by Production Analysis
- 8.2. Market Analysis, Insights and Forecast - by Consumption Analysis
- 8.3. Market Analysis, Insights and Forecast - by Import Market Analysis (Value & Volume)
- 8.4. Market Analysis, Insights and Forecast - by Export Market Analysis (Value & Volume)
- 8.5. Market Analysis, Insights and Forecast - by Price Trend Analysis
- 9. Europe Commercial Greenhouse Industry Analysis, Insights and Forecast, 2020-2032
- 9.1. Market Analysis, Insights and Forecast - by Production Analysis
- 9.2. Market Analysis, Insights and Forecast - by Consumption Analysis
- 9.3. Market Analysis, Insights and Forecast - by Import Market Analysis (Value & Volume)
- 9.4. Market Analysis, Insights and Forecast - by Export Market Analysis (Value & Volume)
- 9.5. Market Analysis, Insights and Forecast - by Price Trend Analysis
- 10. Middle East & Africa Commercial Greenhouse Industry Analysis, Insights and Forecast, 2020-2032
- 10.1. Market Analysis, Insights and Forecast - by Production Analysis
- 10.2. Market Analysis, Insights and Forecast - by Consumption Analysis
- 10.3. Market Analysis, Insights and Forecast - by Import Market Analysis (Value & Volume)
- 10.4. Market Analysis, Insights and Forecast - by Export Market Analysis (Value & Volume)
- 10.5. Market Analysis, Insights and Forecast - by Price Trend Analysis
- 11. Asia Pacific Commercial Greenhouse Industry Analysis, Insights and Forecast, 2020-2032
- 11.1. Market Analysis, Insights and Forecast - by Production Analysis
- 11.2. Market Analysis, Insights and Forecast - by Consumption Analysis
- 11.3. Market Analysis, Insights and Forecast - by Import Market Analysis (Value & Volume)
- 11.4. Market Analysis, Insights and Forecast - by Export Market Analysis (Value & Volume)
- 11.5. Market Analysis, Insights and Forecast - by Price Trend Analysis
- 12. Competitive Analysis
- 12.1. Company Profiles
- 12.1.1 Lumigrow Inc
- 12.1.1.1. Company Overview
- 12.1.1.2. Products
- 12.1.1.3. Company Financials
- 12.1.1.4. SWOT Analysis
- 12.1.2 Certhon
- 12.1.2.1. Company Overview
- 12.1.2.2. Products
- 12.1.2.3. Company Financials
- 12.1.2.4. SWOT Analysis
- 12.1.3 Heliospectra AB
- 12.1.3.1. Company Overview
- 12.1.3.2. Products
- 12.1.3.3. Company Financials
- 12.1.3.4. SWOT Analysis
- 12.1.4 Richel Group
- 12.1.4.1. Company Overview
- 12.1.4.2. Products
- 12.1.4.3. Company Financials
- 12.1.4.4. SWOT Analysis
- 12.1.5 Argus Control Systems Ltd
- 12.1.5.1. Company Overview
- 12.1.5.2. Products
- 12.1.5.3. Company Financials
- 12.1.5.4. SWOT Analysis
- 12.1.6 Agra Tech Inc *List Not Exhaustive
- 12.1.6.1. Company Overview
- 12.1.6.2. Products
- 12.1.6.3. Company Financials
- 12.1.6.4. SWOT Analysis
- 12.1.7 Rough Brothers Inc
- 12.1.7.1. Company Overview
- 12.1.7.2. Products
- 12.1.7.3. Company Financials
- 12.1.7.4. SWOT Analysis
- 12.1.8 Logiqs BV
- 12.1.8.1. Company Overview
- 12.1.8.2. Products
- 12.1.8.3. Company Financials
- 12.1.8.4. SWOT Analysis
- 12.1.9 International Greenhouse Company
- 12.1.9.1. Company Overview
- 12.1.9.2. Products
- 12.1.9.3. Company Financials
- 12.1.9.4. SWOT Analysis
- 12.1.10 Gibraltar Industries (Nexus Corporation)
- 12.1.10.1. Company Overview
- 12.1.10.2. Products
- 12.1.10.3. Company Financials
- 12.1.10.4. SWOT Analysis
- 12.1.1 Lumigrow Inc
- 12.2. Market Entropy
- 12.2.1 Company's Key Areas Served
- 12.2.2 Recent Developments
- 12.3. Company Market Share Analysis 2025
- 12.3.1 Top 5 Companies Market Share Analysis
- 12.3.2 Top 3 Companies Market Share Analysis
- 12.4. List of Potential Customers
- 13. Research Methodology
List of Figures
- Figure 1: Global Commercial Greenhouse Industry Revenue Breakdown (Million, %) by Region 2025 & 2033
- Figure 2: Global Commercial Greenhouse Industry Volume Breakdown (Kiloton, %) by Region 2025 & 2033
- Figure 3: North America Commercial Greenhouse Industry Revenue (Million), by Production Analysis 2025 & 2033
- Figure 4: North America Commercial Greenhouse Industry Volume (Kiloton), by Production Analysis 2025 & 2033
- Figure 5: North America Commercial Greenhouse Industry Revenue Share (%), by Production Analysis 2025 & 2033
- Figure 6: North America Commercial Greenhouse Industry Volume Share (%), by Production Analysis 2025 & 2033
- Figure 7: North America Commercial Greenhouse Industry Revenue (Million), by Consumption Analysis 2025 & 2033
- Figure 8: North America Commercial Greenhouse Industry Volume (Kiloton), by Consumption Analysis 2025 & 2033
- Figure 9: North America Commercial Greenhouse Industry Revenue Share (%), by Consumption Analysis 2025 & 2033
- Figure 10: North America Commercial Greenhouse Industry Volume Share (%), by Consumption Analysis 2025 & 2033
- Figure 11: North America Commercial Greenhouse Industry Revenue (Million), by Import Market Analysis (Value & Volume) 2025 & 2033
- Figure 12: North America Commercial Greenhouse Industry Volume (Kiloton), by Import Market Analysis (Value & Volume) 2025 & 2033
- Figure 13: North America Commercial Greenhouse Industry Revenue Share (%), by Import Market Analysis (Value & Volume) 2025 & 2033
- Figure 14: North America Commercial Greenhouse Industry Volume Share (%), by Import Market Analysis (Value & Volume) 2025 & 2033
- Figure 15: North America Commercial Greenhouse Industry Revenue (Million), by Export Market Analysis (Value & Volume) 2025 & 2033
- Figure 16: North America Commercial Greenhouse Industry Volume (Kiloton), by Export Market Analysis (Value & Volume) 2025 & 2033
- Figure 17: North America Commercial Greenhouse Industry Revenue Share (%), by Export Market Analysis (Value & Volume) 2025 & 2033
- Figure 18: North America Commercial Greenhouse Industry Volume Share (%), by Export Market Analysis (Value & Volume) 2025 & 2033
- Figure 19: North America Commercial Greenhouse Industry Revenue (Million), by Price Trend Analysis 2025 & 2033
- Figure 20: North America Commercial Greenhouse Industry Volume (Kiloton), by Price Trend Analysis 2025 & 2033
- Figure 21: North America Commercial Greenhouse Industry Revenue Share (%), by Price Trend Analysis 2025 & 2033
- Figure 22: North America Commercial Greenhouse Industry Volume Share (%), by Price Trend Analysis 2025 & 2033
- Figure 23: North America Commercial Greenhouse Industry Revenue (Million), by Country 2025 & 2033
- Figure 24: North America Commercial Greenhouse Industry Volume (Kiloton), by Country 2025 & 2033
- Figure 25: North America Commercial Greenhouse Industry Revenue Share (%), by Country 2025 & 2033
- Figure 26: North America Commercial Greenhouse Industry Volume Share (%), by Country 2025 & 2033
- Figure 27: South America Commercial Greenhouse Industry Revenue (Million), by Production Analysis 2025 & 2033
- Figure 28: South America Commercial Greenhouse Industry Volume (Kiloton), by Production Analysis 2025 & 2033
- Figure 29: South America Commercial Greenhouse Industry Revenue Share (%), by Production Analysis 2025 & 2033
- Figure 30: South America Commercial Greenhouse Industry Volume Share (%), by Production Analysis 2025 & 2033
- Figure 31: South America Commercial Greenhouse Industry Revenue (Million), by Consumption Analysis 2025 & 2033
- Figure 32: South America Commercial Greenhouse Industry Volume (Kiloton), by Consumption Analysis 2025 & 2033
- Figure 33: South America Commercial Greenhouse Industry Revenue Share (%), by Consumption Analysis 2025 & 2033
- Figure 34: South America Commercial Greenhouse Industry Volume Share (%), by Consumption Analysis 2025 & 2033
- Figure 35: South America Commercial Greenhouse Industry Revenue (Million), by Import Market Analysis (Value & Volume) 2025 & 2033
- Figure 36: South America Commercial Greenhouse Industry Volume (Kiloton), by Import Market Analysis (Value & Volume) 2025 & 2033
- Figure 37: South America Commercial Greenhouse Industry Revenue Share (%), by Import Market Analysis (Value & Volume) 2025 & 2033
- Figure 38: South America Commercial Greenhouse Industry Volume Share (%), by Import Market Analysis (Value & Volume) 2025 & 2033
- Figure 39: South America Commercial Greenhouse Industry Revenue (Million), by Export Market Analysis (Value & Volume) 2025 & 2033
- Figure 40: South America Commercial Greenhouse Industry Volume (Kiloton), by Export Market Analysis (Value & Volume) 2025 & 2033
- Figure 41: South America Commercial Greenhouse Industry Revenue Share (%), by Export Market Analysis (Value & Volume) 2025 & 2033
- Figure 42: South America Commercial Greenhouse Industry Volume Share (%), by Export Market Analysis (Value & Volume) 2025 & 2033
- Figure 43: South America Commercial Greenhouse Industry Revenue (Million), by Price Trend Analysis 2025 & 2033
- Figure 44: South America Commercial Greenhouse Industry Volume (Kiloton), by Price Trend Analysis 2025 & 2033
- Figure 45: South America Commercial Greenhouse Industry Revenue Share (%), by Price Trend Analysis 2025 & 2033
- Figure 46: South America Commercial Greenhouse Industry Volume Share (%), by Price Trend Analysis 2025 & 2033
- Figure 47: South America Commercial Greenhouse Industry Revenue (Million), by Country 2025 & 2033
- Figure 48: South America Commercial Greenhouse Industry Volume (Kiloton), by Country 2025 & 2033
- Figure 49: South America Commercial Greenhouse Industry Revenue Share (%), by Country 2025 & 2033
- Figure 50: South America Commercial Greenhouse Industry Volume Share (%), by Country 2025 & 2033
- Figure 51: Europe Commercial Greenhouse Industry Revenue (Million), by Production Analysis 2025 & 2033
- Figure 52: Europe Commercial Greenhouse Industry Volume (Kiloton), by Production Analysis 2025 & 2033
- Figure 53: Europe Commercial Greenhouse Industry Revenue Share (%), by Production Analysis 2025 & 2033
- Figure 54: Europe Commercial Greenhouse Industry Volume Share (%), by Production Analysis 2025 & 2033
- Figure 55: Europe Commercial Greenhouse Industry Revenue (Million), by Consumption Analysis 2025 & 2033
- Figure 56: Europe Commercial Greenhouse Industry Volume (Kiloton), by Consumption Analysis 2025 & 2033
- Figure 57: Europe Commercial Greenhouse Industry Revenue Share (%), by Consumption Analysis 2025 & 2033
- Figure 58: Europe Commercial Greenhouse Industry Volume Share (%), by Consumption Analysis 2025 & 2033
- Figure 59: Europe Commercial Greenhouse Industry Revenue (Million), by Import Market Analysis (Value & Volume) 2025 & 2033
- Figure 60: Europe Commercial Greenhouse Industry Volume (Kiloton), by Import Market Analysis (Value & Volume) 2025 & 2033
- Figure 61: Europe Commercial Greenhouse Industry Revenue Share (%), by Import Market Analysis (Value & Volume) 2025 & 2033
- Figure 62: Europe Commercial Greenhouse Industry Volume Share (%), by Import Market Analysis (Value & Volume) 2025 & 2033
- Figure 63: Europe Commercial Greenhouse Industry Revenue (Million), by Export Market Analysis (Value & Volume) 2025 & 2033
- Figure 64: Europe Commercial Greenhouse Industry Volume (Kiloton), by Export Market Analysis (Value & Volume) 2025 & 2033
- Figure 65: Europe Commercial Greenhouse Industry Revenue Share (%), by Export Market Analysis (Value & Volume) 2025 & 2033
- Figure 66: Europe Commercial Greenhouse Industry Volume Share (%), by Export Market Analysis (Value & Volume) 2025 & 2033
- Figure 67: Europe Commercial Greenhouse Industry Revenue (Million), by Price Trend Analysis 2025 & 2033
- Figure 68: Europe Commercial Greenhouse Industry Volume (Kiloton), by Price Trend Analysis 2025 & 2033
- Figure 69: Europe Commercial Greenhouse Industry Revenue Share (%), by Price Trend Analysis 2025 & 2033
- Figure 70: Europe Commercial Greenhouse Industry Volume Share (%), by Price Trend Analysis 2025 & 2033
- Figure 71: Europe Commercial Greenhouse Industry Revenue (Million), by Country 2025 & 2033
- Figure 72: Europe Commercial Greenhouse Industry Volume (Kiloton), by Country 2025 & 2033
- Figure 73: Europe Commercial Greenhouse Industry Revenue Share (%), by Country 2025 & 2033
- Figure 74: Europe Commercial Greenhouse Industry Volume Share (%), by Country 2025 & 2033
- Figure 75: Middle East & Africa Commercial Greenhouse Industry Revenue (Million), by Production Analysis 2025 & 2033
- Figure 76: Middle East & Africa Commercial Greenhouse Industry Volume (Kiloton), by Production Analysis 2025 & 2033
- Figure 77: Middle East & Africa Commercial Greenhouse Industry Revenue Share (%), by Production Analysis 2025 & 2033
- Figure 78: Middle East & Africa Commercial Greenhouse Industry Volume Share (%), by Production Analysis 2025 & 2033
- Figure 79: Middle East & Africa Commercial Greenhouse Industry Revenue (Million), by Consumption Analysis 2025 & 2033
- Figure 80: Middle East & Africa Commercial Greenhouse Industry Volume (Kiloton), by Consumption Analysis 2025 & 2033
- Figure 81: Middle East & Africa Commercial Greenhouse Industry Revenue Share (%), by Consumption Analysis 2025 & 2033
- Figure 82: Middle East & Africa Commercial Greenhouse Industry Volume Share (%), by Consumption Analysis 2025 & 2033
- Figure 83: Middle East & Africa Commercial Greenhouse Industry Revenue (Million), by Import Market Analysis (Value & Volume) 2025 & 2033
- Figure 84: Middle East & Africa Commercial Greenhouse Industry Volume (Kiloton), by Import Market Analysis (Value & Volume) 2025 & 2033
- Figure 85: Middle East & Africa Commercial Greenhouse Industry Revenue Share (%), by Import Market Analysis (Value & Volume) 2025 & 2033
- Figure 86: Middle East & Africa Commercial Greenhouse Industry Volume Share (%), by Import Market Analysis (Value & Volume) 2025 & 2033
- Figure 87: Middle East & Africa Commercial Greenhouse Industry Revenue (Million), by Export Market Analysis (Value & Volume) 2025 & 2033
- Figure 88: Middle East & Africa Commercial Greenhouse Industry Volume (Kiloton), by Export Market Analysis (Value & Volume) 2025 & 2033
- Figure 89: Middle East & Africa Commercial Greenhouse Industry Revenue Share (%), by Export Market Analysis (Value & Volume) 2025 & 2033
- Figure 90: Middle East & Africa Commercial Greenhouse Industry Volume Share (%), by Export Market Analysis (Value & Volume) 2025 & 2033
- Figure 91: Middle East & Africa Commercial Greenhouse Industry Revenue (Million), by Price Trend Analysis 2025 & 2033
- Figure 92: Middle East & Africa Commercial Greenhouse Industry Volume (Kiloton), by Price Trend Analysis 2025 & 2033
- Figure 93: Middle East & Africa Commercial Greenhouse Industry Revenue Share (%), by Price Trend Analysis 2025 & 2033
- Figure 94: Middle East & Africa Commercial Greenhouse Industry Volume Share (%), by Price Trend Analysis 2025 & 2033
- Figure 95: Middle East & Africa Commercial Greenhouse Industry Revenue (Million), by Country 2025 & 2033
- Figure 96: Middle East & Africa Commercial Greenhouse Industry Volume (Kiloton), by Country 2025 & 2033
- Figure 97: Middle East & Africa Commercial Greenhouse Industry Revenue Share (%), by Country 2025 & 2033
- Figure 98: Middle East & Africa Commercial Greenhouse Industry Volume Share (%), by Country 2025 & 2033
- Figure 99: Asia Pacific Commercial Greenhouse Industry Revenue (Million), by Production Analysis 2025 & 2033
- Figure 100: Asia Pacific Commercial Greenhouse Industry Volume (Kiloton), by Production Analysis 2025 & 2033
- Figure 101: Asia Pacific Commercial Greenhouse Industry Revenue Share (%), by Production Analysis 2025 & 2033
- Figure 102: Asia Pacific Commercial Greenhouse Industry Volume Share (%), by Production Analysis 2025 & 2033
- Figure 103: Asia Pacific Commercial Greenhouse Industry Revenue (Million), by Consumption Analysis 2025 & 2033
- Figure 104: Asia Pacific Commercial Greenhouse Industry Volume (Kiloton), by Consumption Analysis 2025 & 2033
- Figure 105: Asia Pacific Commercial Greenhouse Industry Revenue Share (%), by Consumption Analysis 2025 & 2033
- Figure 106: Asia Pacific Commercial Greenhouse Industry Volume Share (%), by Consumption Analysis 2025 & 2033
- Figure 107: Asia Pacific Commercial Greenhouse Industry Revenue (Million), by Import Market Analysis (Value & Volume) 2025 & 2033
- Figure 108: Asia Pacific Commercial Greenhouse Industry Volume (Kiloton), by Import Market Analysis (Value & Volume) 2025 & 2033
- Figure 109: Asia Pacific Commercial Greenhouse Industry Revenue Share (%), by Import Market Analysis (Value & Volume) 2025 & 2033
- Figure 110: Asia Pacific Commercial Greenhouse Industry Volume Share (%), by Import Market Analysis (Value & Volume) 2025 & 2033
- Figure 111: Asia Pacific Commercial Greenhouse Industry Revenue (Million), by Export Market Analysis (Value & Volume) 2025 & 2033
- Figure 112: Asia Pacific Commercial Greenhouse Industry Volume (Kiloton), by Export Market Analysis (Value & Volume) 2025 & 2033
- Figure 113: Asia Pacific Commercial Greenhouse Industry Revenue Share (%), by Export Market Analysis (Value & Volume) 2025 & 2033
- Figure 114: Asia Pacific Commercial Greenhouse Industry Volume Share (%), by Export Market Analysis (Value & Volume) 2025 & 2033
- Figure 115: Asia Pacific Commercial Greenhouse Industry Revenue (Million), by Price Trend Analysis 2025 & 2033
- Figure 116: Asia Pacific Commercial Greenhouse Industry Volume (Kiloton), by Price Trend Analysis 2025 & 2033
- Figure 117: Asia Pacific Commercial Greenhouse Industry Revenue Share (%), by Price Trend Analysis 2025 & 2033
- Figure 118: Asia Pacific Commercial Greenhouse Industry Volume Share (%), by Price Trend Analysis 2025 & 2033
- Figure 119: Asia Pacific Commercial Greenhouse Industry Revenue (Million), by Country 2025 & 2033
- Figure 120: Asia Pacific Commercial Greenhouse Industry Volume (Kiloton), by Country 2025 & 2033
- Figure 121: Asia Pacific Commercial Greenhouse Industry Revenue Share (%), by Country 2025 & 2033
- Figure 122: Asia Pacific Commercial Greenhouse Industry Volume Share (%), by Country 2025 & 2033
List of Tables
- Table 1: Global Commercial Greenhouse Industry Revenue Million Forecast, by Production Analysis 2020 & 2033
- Table 2: Global Commercial Greenhouse Industry Volume Kiloton Forecast, by Production Analysis 2020 & 2033
- Table 3: Global Commercial Greenhouse Industry Revenue Million Forecast, by Consumption Analysis 2020 & 2033
- Table 4: Global Commercial Greenhouse Industry Volume Kiloton Forecast, by Consumption Analysis 2020 & 2033
- Table 5: Global Commercial Greenhouse Industry Revenue Million Forecast, by Import Market Analysis (Value & Volume) 2020 & 2033
- Table 6: Global Commercial Greenhouse Industry Volume Kiloton Forecast, by Import Market Analysis (Value & Volume) 2020 & 2033
- Table 7: Global Commercial Greenhouse Industry Revenue Million Forecast, by Export Market Analysis (Value & Volume) 2020 & 2033
- Table 8: Global Commercial Greenhouse Industry Volume Kiloton Forecast, by Export Market Analysis (Value & Volume) 2020 & 2033
- Table 9: Global Commercial Greenhouse Industry Revenue Million Forecast, by Price Trend Analysis 2020 & 2033
- Table 10: Global Commercial Greenhouse Industry Volume Kiloton Forecast, by Price Trend Analysis 2020 & 2033
- Table 11: Global Commercial Greenhouse Industry Revenue Million Forecast, by Region 2020 & 2033
- Table 12: Global Commercial Greenhouse Industry Volume Kiloton Forecast, by Region 2020 & 2033
- Table 13: Global Commercial Greenhouse Industry Revenue Million Forecast, by Production Analysis 2020 & 2033
- Table 14: Global Commercial Greenhouse Industry Volume Kiloton Forecast, by Production Analysis 2020 & 2033
- Table 15: Global Commercial Greenhouse Industry Revenue Million Forecast, by Consumption Analysis 2020 & 2033
- Table 16: Global Commercial Greenhouse Industry Volume Kiloton Forecast, by Consumption Analysis 2020 & 2033
- Table 17: Global Commercial Greenhouse Industry Revenue Million Forecast, by Import Market Analysis (Value & Volume) 2020 & 2033
- Table 18: Global Commercial Greenhouse Industry Volume Kiloton Forecast, by Import Market Analysis (Value & Volume) 2020 & 2033
- Table 19: Global Commercial Greenhouse Industry Revenue Million Forecast, by Export Market Analysis (Value & Volume) 2020 & 2033
- Table 20: Global Commercial Greenhouse Industry Volume Kiloton Forecast, by Export Market Analysis (Value & Volume) 2020 & 2033
- Table 21: Global Commercial Greenhouse Industry Revenue Million Forecast, by Price Trend Analysis 2020 & 2033
- Table 22: Global Commercial Greenhouse Industry Volume Kiloton Forecast, by Price Trend Analysis 2020 & 2033
- Table 23: Global Commercial Greenhouse Industry Revenue Million Forecast, by Country 2020 & 2033
- Table 24: Global Commercial Greenhouse Industry Volume Kiloton Forecast, by Country 2020 & 2033
- Table 25: United States Commercial Greenhouse Industry Revenue (Million) Forecast, by Application 2020 & 2033
- Table 26: United States Commercial Greenhouse Industry Volume (Kiloton) Forecast, by Application 2020 & 2033
- Table 27: Canada Commercial Greenhouse Industry Revenue (Million) Forecast, by Application 2020 & 2033
- Table 28: Canada Commercial Greenhouse Industry Volume (Kiloton) Forecast, by Application 2020 & 2033
- Table 29: Mexico Commercial Greenhouse Industry Revenue (Million) Forecast, by Application 2020 & 2033
- Table 30: Mexico Commercial Greenhouse Industry Volume (Kiloton) Forecast, by Application 2020 & 2033
- Table 31: Global Commercial Greenhouse Industry Revenue Million Forecast, by Production Analysis 2020 & 2033
- Table 32: Global Commercial Greenhouse Industry Volume Kiloton Forecast, by Production Analysis 2020 & 2033
- Table 33: Global Commercial Greenhouse Industry Revenue Million Forecast, by Consumption Analysis 2020 & 2033
- Table 34: Global Commercial Greenhouse Industry Volume Kiloton Forecast, by Consumption Analysis 2020 & 2033
- Table 35: Global Commercial Greenhouse Industry Revenue Million Forecast, by Import Market Analysis (Value & Volume) 2020 & 2033
- Table 36: Global Commercial Greenhouse Industry Volume Kiloton Forecast, by Import Market Analysis (Value & Volume) 2020 & 2033
- Table 37: Global Commercial Greenhouse Industry Revenue Million Forecast, by Export Market Analysis (Value & Volume) 2020 & 2033
- Table 38: Global Commercial Greenhouse Industry Volume Kiloton Forecast, by Export Market Analysis (Value & Volume) 2020 & 2033
- Table 39: Global Commercial Greenhouse Industry Revenue Million Forecast, by Price Trend Analysis 2020 & 2033
- Table 40: Global Commercial Greenhouse Industry Volume Kiloton Forecast, by Price Trend Analysis 2020 & 2033
- Table 41: Global Commercial Greenhouse Industry Revenue Million Forecast, by Country 2020 & 2033
- Table 42: Global Commercial Greenhouse Industry Volume Kiloton Forecast, by Country 2020 & 2033
- Table 43: Brazil Commercial Greenhouse Industry Revenue (Million) Forecast, by Application 2020 & 2033
- Table 44: Brazil Commercial Greenhouse Industry Volume (Kiloton) Forecast, by Application 2020 & 2033
- Table 45: Argentina Commercial Greenhouse Industry Revenue (Million) Forecast, by Application 2020 & 2033
- Table 46: Argentina Commercial Greenhouse Industry Volume (Kiloton) Forecast, by Application 2020 & 2033
- Table 47: Rest of South America Commercial Greenhouse Industry Revenue (Million) Forecast, by Application 2020 & 2033
- Table 48: Rest of South America Commercial Greenhouse Industry Volume (Kiloton) Forecast, by Application 2020 & 2033
- Table 49: Global Commercial Greenhouse Industry Revenue Million Forecast, by Production Analysis 2020 & 2033
- Table 50: Global Commercial Greenhouse Industry Volume Kiloton Forecast, by Production Analysis 2020 & 2033
- Table 51: Global Commercial Greenhouse Industry Revenue Million Forecast, by Consumption Analysis 2020 & 2033
- Table 52: Global Commercial Greenhouse Industry Volume Kiloton Forecast, by Consumption Analysis 2020 & 2033
- Table 53: Global Commercial Greenhouse Industry Revenue Million Forecast, by Import Market Analysis (Value & Volume) 2020 & 2033
- Table 54: Global Commercial Greenhouse Industry Volume Kiloton Forecast, by Import Market Analysis (Value & Volume) 2020 & 2033
- Table 55: Global Commercial Greenhouse Industry Revenue Million Forecast, by Export Market Analysis (Value & Volume) 2020 & 2033
- Table 56: Global Commercial Greenhouse Industry Volume Kiloton Forecast, by Export Market Analysis (Value & Volume) 2020 & 2033
- Table 57: Global Commercial Greenhouse Industry Revenue Million Forecast, by Price Trend Analysis 2020 & 2033
- Table 58: Global Commercial Greenhouse Industry Volume Kiloton Forecast, by Price Trend Analysis 2020 & 2033
- Table 59: Global Commercial Greenhouse Industry Revenue Million Forecast, by Country 2020 & 2033
- Table 60: Global Commercial Greenhouse Industry Volume Kiloton Forecast, by Country 2020 & 2033
- Table 61: United Kingdom Commercial Greenhouse Industry Revenue (Million) Forecast, by Application 2020 & 2033
- Table 62: United Kingdom Commercial Greenhouse Industry Volume (Kiloton) Forecast, by Application 2020 & 2033
- Table 63: Germany Commercial Greenhouse Industry Revenue (Million) Forecast, by Application 2020 & 2033
- Table 64: Germany Commercial Greenhouse Industry Volume (Kiloton) Forecast, by Application 2020 & 2033
- Table 65: France Commercial Greenhouse Industry Revenue (Million) Forecast, by Application 2020 & 2033
- Table 66: France Commercial Greenhouse Industry Volume (Kiloton) Forecast, by Application 2020 & 2033
- Table 67: Italy Commercial Greenhouse Industry Revenue (Million) Forecast, by Application 2020 & 2033
- Table 68: Italy Commercial Greenhouse Industry Volume (Kiloton) Forecast, by Application 2020 & 2033
- Table 69: Spain Commercial Greenhouse Industry Revenue (Million) Forecast, by Application 2020 & 2033
- Table 70: Spain Commercial Greenhouse Industry Volume (Kiloton) Forecast, by Application 2020 & 2033
- Table 71: Russia Commercial Greenhouse Industry Revenue (Million) Forecast, by Application 2020 & 2033
- Table 72: Russia Commercial Greenhouse Industry Volume (Kiloton) Forecast, by Application 2020 & 2033
- Table 73: Benelux Commercial Greenhouse Industry Revenue (Million) Forecast, by Application 2020 & 2033
- Table 74: Benelux Commercial Greenhouse Industry Volume (Kiloton) Forecast, by Application 2020 & 2033
- Table 75: Nordics Commercial Greenhouse Industry Revenue (Million) Forecast, by Application 2020 & 2033
- Table 76: Nordics Commercial Greenhouse Industry Volume (Kiloton) Forecast, by Application 2020 & 2033
- Table 77: Rest of Europe Commercial Greenhouse Industry Revenue (Million) Forecast, by Application 2020 & 2033
- Table 78: Rest of Europe Commercial Greenhouse Industry Volume (Kiloton) Forecast, by Application 2020 & 2033
- Table 79: Global Commercial Greenhouse Industry Revenue Million Forecast, by Production Analysis 2020 & 2033
- Table 80: Global Commercial Greenhouse Industry Volume Kiloton Forecast, by Production Analysis 2020 & 2033
- Table 81: Global Commercial Greenhouse Industry Revenue Million Forecast, by Consumption Analysis 2020 & 2033
- Table 82: Global Commercial Greenhouse Industry Volume Kiloton Forecast, by Consumption Analysis 2020 & 2033
- Table 83: Global Commercial Greenhouse Industry Revenue Million Forecast, by Import Market Analysis (Value & Volume) 2020 & 2033
- Table 84: Global Commercial Greenhouse Industry Volume Kiloton Forecast, by Import Market Analysis (Value & Volume) 2020 & 2033
- Table 85: Global Commercial Greenhouse Industry Revenue Million Forecast, by Export Market Analysis (Value & Volume) 2020 & 2033
- Table 86: Global Commercial Greenhouse Industry Volume Kiloton Forecast, by Export Market Analysis (Value & Volume) 2020 & 2033
- Table 87: Global Commercial Greenhouse Industry Revenue Million Forecast, by Price Trend Analysis 2020 & 2033
- Table 88: Global Commercial Greenhouse Industry Volume Kiloton Forecast, by Price Trend Analysis 2020 & 2033
- Table 89: Global Commercial Greenhouse Industry Revenue Million Forecast, by Country 2020 & 2033
- Table 90: Global Commercial Greenhouse Industry Volume Kiloton Forecast, by Country 2020 & 2033
- Table 91: Turkey Commercial Greenhouse Industry Revenue (Million) Forecast, by Application 2020 & 2033
- Table 92: Turkey Commercial Greenhouse Industry Volume (Kiloton) Forecast, by Application 2020 & 2033
- Table 93: Israel Commercial Greenhouse Industry Revenue (Million) Forecast, by Application 2020 & 2033
- Table 94: Israel Commercial Greenhouse Industry Volume (Kiloton) Forecast, by Application 2020 & 2033
- Table 95: GCC Commercial Greenhouse Industry Revenue (Million) Forecast, by Application 2020 & 2033
- Table 96: GCC Commercial Greenhouse Industry Volume (Kiloton) Forecast, by Application 2020 & 2033
- Table 97: North Africa Commercial Greenhouse Industry Revenue (Million) Forecast, by Application 2020 & 2033
- Table 98: North Africa Commercial Greenhouse Industry Volume (Kiloton) Forecast, by Application 2020 & 2033
- Table 99: South Africa Commercial Greenhouse Industry Revenue (Million) Forecast, by Application 2020 & 2033
- Table 100: South Africa Commercial Greenhouse Industry Volume (Kiloton) Forecast, by Application 2020 & 2033
- Table 101: Rest of Middle East & Africa Commercial Greenhouse Industry Revenue (Million) Forecast, by Application 2020 & 2033
- Table 102: Rest of Middle East & Africa Commercial Greenhouse Industry Volume (Kiloton) Forecast, by Application 2020 & 2033
- Table 103: Global Commercial Greenhouse Industry Revenue Million Forecast, by Production Analysis 2020 & 2033
- Table 104: Global Commercial Greenhouse Industry Volume Kiloton Forecast, by Production Analysis 2020 & 2033
- Table 105: Global Commercial Greenhouse Industry Revenue Million Forecast, by Consumption Analysis 2020 & 2033
- Table 106: Global Commercial Greenhouse Industry Volume Kiloton Forecast, by Consumption Analysis 2020 & 2033
- Table 107: Global Commercial Greenhouse Industry Revenue Million Forecast, by Import Market Analysis (Value & Volume) 2020 & 2033
- Table 108: Global Commercial Greenhouse Industry Volume Kiloton Forecast, by Import Market Analysis (Value & Volume) 2020 & 2033
- Table 109: Global Commercial Greenhouse Industry Revenue Million Forecast, by Export Market Analysis (Value & Volume) 2020 & 2033
- Table 110: Global Commercial Greenhouse Industry Volume Kiloton Forecast, by Export Market Analysis (Value & Volume) 2020 & 2033
- Table 111: Global Commercial Greenhouse Industry Revenue Million Forecast, by Price Trend Analysis 2020 & 2033
- Table 112: Global Commercial Greenhouse Industry Volume Kiloton Forecast, by Price Trend Analysis 2020 & 2033
- Table 113: Global Commercial Greenhouse Industry Revenue Million Forecast, by Country 2020 & 2033
- Table 114: Global Commercial Greenhouse Industry Volume Kiloton Forecast, by Country 2020 & 2033
- Table 115: China Commercial Greenhouse Industry Revenue (Million) Forecast, by Application 2020 & 2033
- Table 116: China Commercial Greenhouse Industry Volume (Kiloton) Forecast, by Application 2020 & 2033
- Table 117: India Commercial Greenhouse Industry Revenue (Million) Forecast, by Application 2020 & 2033
- Table 118: India Commercial Greenhouse Industry Volume (Kiloton) Forecast, by Application 2020 & 2033
- Table 119: Japan Commercial Greenhouse Industry Revenue (Million) Forecast, by Application 2020 & 2033
- Table 120: Japan Commercial Greenhouse Industry Volume (Kiloton) Forecast, by Application 2020 & 2033
- Table 121: South Korea Commercial Greenhouse Industry Revenue (Million) Forecast, by Application 2020 & 2033
- Table 122: South Korea Commercial Greenhouse Industry Volume (Kiloton) Forecast, by Application 2020 & 2033
- Table 123: ASEAN Commercial Greenhouse Industry Revenue (Million) Forecast, by Application 2020 & 2033
- Table 124: ASEAN Commercial Greenhouse Industry Volume (Kiloton) Forecast, by Application 2020 & 2033
- Table 125: Oceania Commercial Greenhouse Industry Revenue (Million) Forecast, by Application 2020 & 2033
- Table 126: Oceania Commercial Greenhouse Industry Volume (Kiloton) Forecast, by Application 2020 & 2033
- Table 127: Rest of Asia Pacific Commercial Greenhouse Industry Revenue (Million) Forecast, by Application 2020 & 2033
- Table 128: Rest of Asia Pacific Commercial Greenhouse Industry Volume (Kiloton) Forecast, by Application 2020 & 2033
Frequently Asked Questions
1. What is the projected Compound Annual Growth Rate (CAGR) of the Commercial Greenhouse Industry?
The projected CAGR is approximately 7.00%.
2. Which companies are prominent players in the Commercial Greenhouse Industry?
Key companies in the market include Lumigrow Inc, Certhon, Heliospectra AB, Richel Group, Argus Control Systems Ltd, Agra Tech Inc *List Not Exhaustive, Rough Brothers Inc, Logiqs BV, International Greenhouse Company, Gibraltar Industries (Nexus Corporation).
3. What are the main segments of the Commercial Greenhouse Industry?
The market segments include Production Analysis, Consumption Analysis, Import Market Analysis (Value & Volume), Export Market Analysis (Value & Volume), Price Trend Analysis.
4. Can you provide details about the market size?
The market size is estimated to be USD 47.76 Million as of 2022.
5. What are some drivers contributing to market growth?
Decreasing Per Capita Arable Land; Increased Demand for Food.
6. What are the notable trends driving market growth?
Horticultural Crops Are In High Demand.
7. Are there any restraints impacting market growth?
High Initial Investments; Requirement of Precision Agriculture.
8. Can you provide examples of recent developments in the market?
September 2023: Richel Group has been in a three-year, exclusive strategic partnership to increase its efficiency in designing, manufacturing, and building high-tech greenhouses in challenging climates and distant regions, including the Middle East and Asia.
9. What pricing options are available for accessing the report?
Pricing options include single-user, multi-user, and enterprise licenses priced at USD 4750, USD 5250, and USD 8750 respectively.
10. Is the market size provided in terms of value or volume?
The market size is provided in terms of value, measured in Million and volume, measured in Kiloton.
11. Are there any specific market keywords associated with the report?
Yes, the market keyword associated with the report is "Commercial Greenhouse Industry," which aids in identifying and referencing the specific market segment covered.
12. How do I determine which pricing option suits my needs best?
The pricing options vary based on user requirements and access needs. Individual users may opt for single-user licenses, while businesses requiring broader access may choose multi-user or enterprise licenses for cost-effective access to the report.
13. Are there any additional resources or data provided in the Commercial Greenhouse Industry report?
While the report offers comprehensive insights, it's advisable to review the specific contents or supplementary materials provided to ascertain if additional resources or data are available.
14. How can I stay updated on further developments or reports in the Commercial Greenhouse Industry?
To stay informed about further developments, trends, and reports in the Commercial Greenhouse Industry, consider subscribing to industry newsletters, following relevant companies and organizations, or regularly checking reputable industry news sources and publications.
Methodology
Step 1 - Identification of Relevant Samples Size from Population Database


Step 2 - Approaches for Defining Global Market Size (Value, Volume* & Price*)

Note*: In applicable scenarios
Step 3 - Data Sources
Primary Research
- Web Analytics
- Survey Reports
- Research Institute
- Latest Research Reports
- Opinion Leaders
Secondary Research
- Annual Reports
- White Paper
- Latest Press Release
- Industry Association
- Paid Database
- Investor Presentations

Step 4 - Data Triangulation
Involves using different sources of information in order to increase the validity of a study
These sources are likely to be stakeholders in a program - participants, other researchers, program staff, other community members, and so on.
Then we put all data in single framework & apply various statistical tools to find out the dynamic on the market.
During the analysis stage, feedback from the stakeholder groups would be compared to determine areas of agreement as well as areas of divergence