

Key Insights
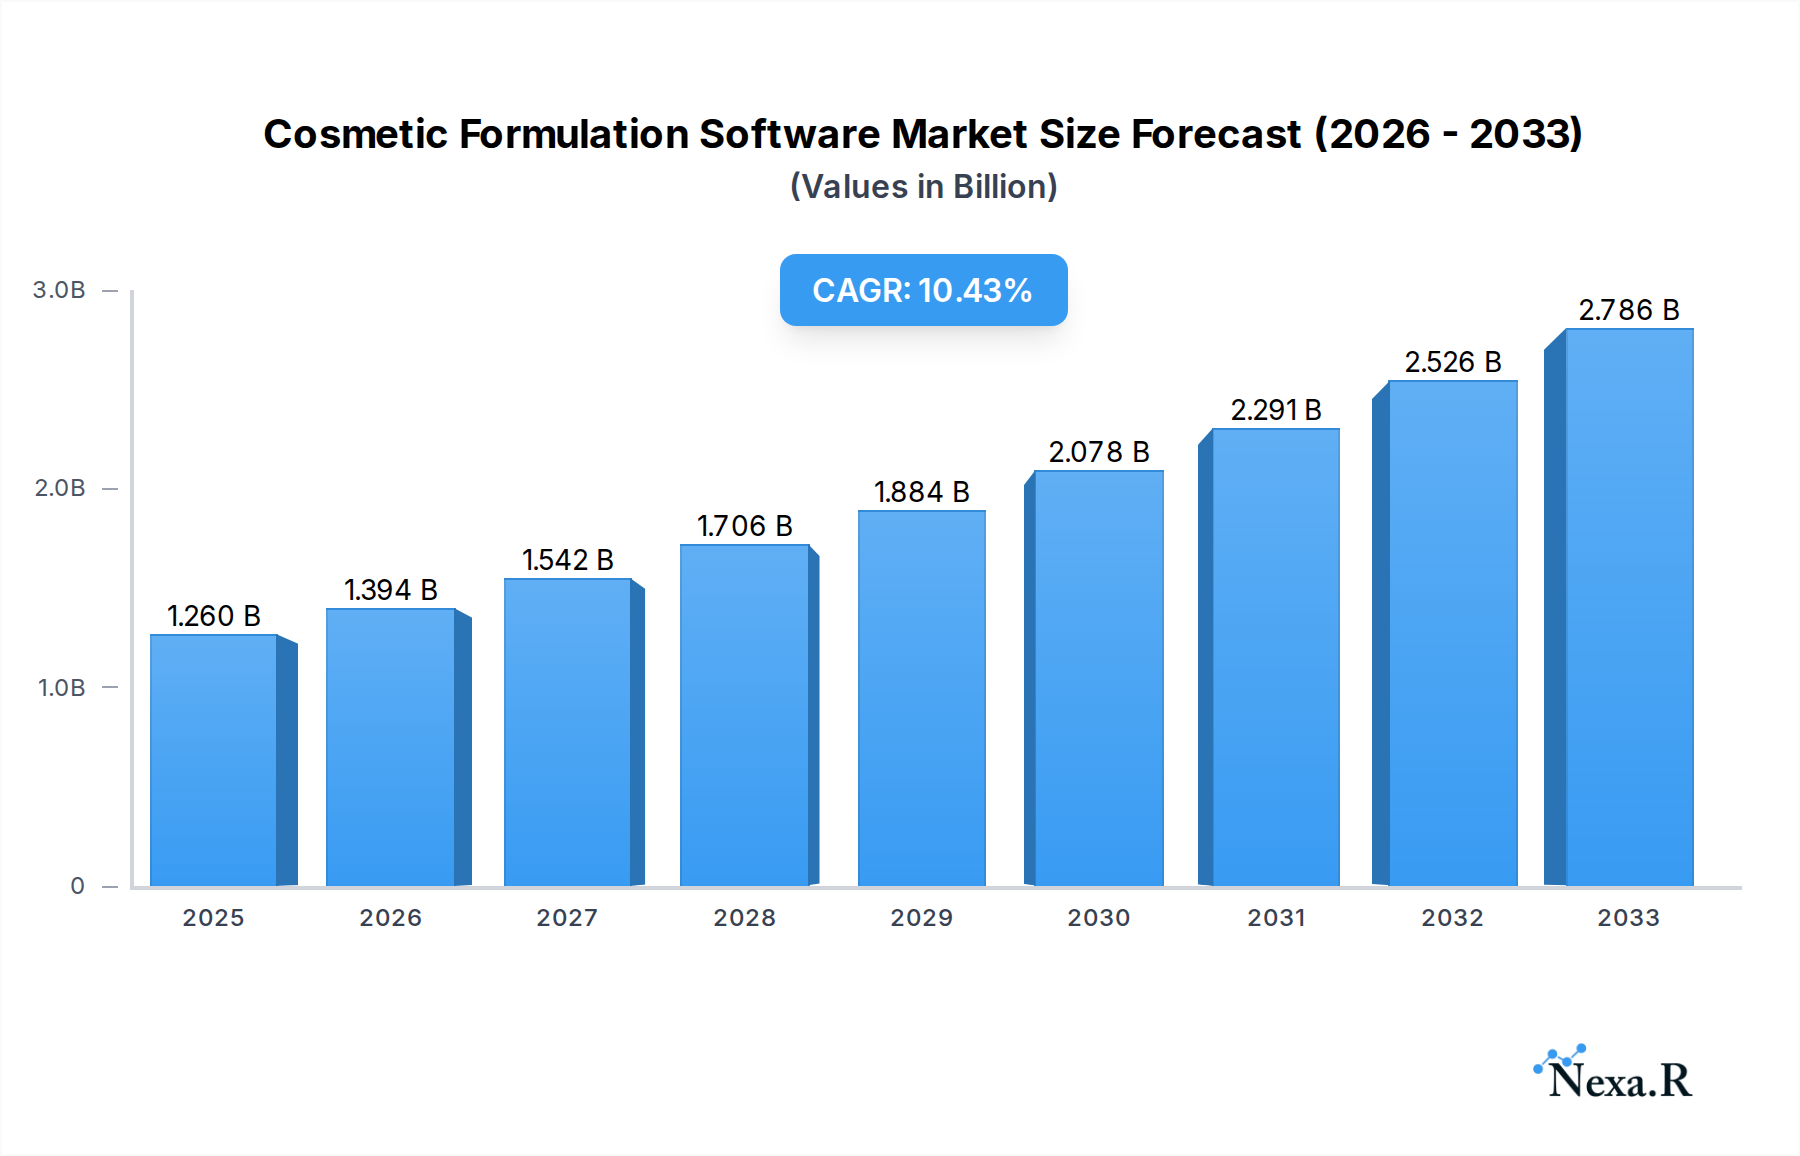
The global Cosmetic Formulation Software market is poised for significant expansion, projected to reach an estimated $1.26 billion in 2025 and exhibiting a robust Compound Annual Growth Rate (CAGR) of 10.5% through 2033. This impressive growth trajectory is fueled by several dynamic market drivers, most notably the escalating demand for personalized cosmetics driven by evolving consumer preferences and the increasing complexity of product development. The rise of clean beauty, sustainable sourcing, and the need for stringent regulatory compliance are compelling manufacturers to adopt sophisticated software solutions for efficient formulation, testing, and ingredient management. Furthermore, advancements in artificial intelligence and machine learning are enabling more accurate ingredient interactions, efficacy predictions, and the development of innovative product lines, thus acting as a powerful catalyst for market adoption. The increasing adoption of cloud-based solutions, offering enhanced accessibility, scalability, and collaborative features, is also playing a pivotal role in accelerating market penetration across diverse user segments.

Cosmetic Formulation Software Market Size (In Billion)
The market is strategically segmented by application into Personal and Enterprise, with Enterprise solutions dominating due to their comprehensive functionalities for larger R&D departments and production facilities. By type, both On-premise and Cloud-based solutions cater to distinct needs, though the latter is experiencing accelerated growth owing to its cost-effectiveness and flexibility. Key players like Microsoft and SAP are leading the charge with their integrated enterprise solutions, while specialized companies such as Katana MRP and BatchMaster Software are carving out niches in specific areas of formulation and manufacturing. The market's expansion is anticipated to be particularly strong in the Asia Pacific region, driven by a rapidly growing cosmetics industry and increasing investments in R&D. While the market enjoys strong growth prospects, potential restraints such as high initial investment costs for advanced software and the need for specialized training could pose challenges in certain segments, though the overall outlook remains exceptionally positive.
Cosmetic Formulation Software Company Market Share
Unveiling the Future of Beauty: A Comprehensive Report on Cosmetic Formulation Software
This in-depth report delivers a critical analysis of the Cosmetic Formulation Software market, a vital sector underpinning innovation and efficiency within the global beauty industry. Covering the period from 2019 to 2033, with a deep dive into the base and forecast years of 2025-2033, this research provides actionable insights for stakeholders, from burgeoning startups to established enterprises. We dissect market dynamics, growth trends, regional dominance, product landscapes, and the pivotal players shaping the future of cosmetic creation.
Cosmetic Formulation Software Market Dynamics & Structure
The Cosmetic Formulation Software market exhibits a moderately concentrated structure, with established players like Microsoft, SAP, and BatchMaster Software holding significant sway, alongside agile innovators such as cosmetri GmbH and Coptis. Technological innovation is a primary driver, fueled by the relentless demand for faster product development cycles, enhanced sustainability, and precise ingredient management. Regulatory frameworks, particularly around ingredient safety and compliance, are increasingly dictating software functionalities, pushing for traceability and robust data management. Competitive product substitutes, while present in the form of manual spreadsheets or basic inventory systems, are rapidly being outpaced by the sophisticated capabilities of dedicated formulation software. End-user demographics are broadening, encompassing not only large enterprises but also a growing segment of personal or indie beauty brands. Mergers and Acquisitions (M&A) trends, while not yet dominating, are emerging as a key strategy for consolidation and talent acquisition, with an estimated 15-20 M&A deals observed annually over the historical period. Innovation barriers primarily revolve around the complexity of integrating diverse data streams and the initial cost of adoption for smaller businesses, alongside the need for continuous software updates to keep pace with evolving scientific research.
- Market Concentration: Moderately concentrated, with a mix of large enterprise solutions and niche players.
- Key Innovation Drivers: Demand for speed, sustainability, ingredient precision, and regulatory compliance.
- Regulatory Impact: Driving demand for traceability, data security, and audit-ready features.
- Competitive Landscape: Dedicated software offers significant advantages over manual or basic systems.
- End-User Evolution: Growing adoption by personal/indie beauty brands alongside enterprises.
- M&A Activity: An emerging strategy for market consolidation and technology acquisition.
Cosmetic Formulation Software Growth Trends & Insights
The Cosmetic Formulation Software market is poised for robust expansion, projected to grow from an estimated $1.5 billion in 2025 to $2.8 billion by 2033, exhibiting a Compound Annual Growth Rate (CAGR) of approximately 8.5%. This substantial growth is underpinned by escalating adoption rates across both personal and enterprise segments, as businesses recognize the transformative power of these solutions in optimizing product development, ensuring quality control, and streamlining compliance. Technological disruptions, such as the integration of AI for ingredient discovery and formulation optimization, alongside advancements in cloud-based platforms offering greater accessibility and scalability, are further accelerating market penetration. Consumer behavior shifts, driven by a growing demand for personalized beauty products, clean ingredients, and transparent supply chains, are compelling manufacturers to leverage sophisticated software for rapid innovation and accurate product information dissemination. The market penetration for enterprise-level solutions currently stands at around 60%, with the personal segment showing a rapid, albeit smaller, initial adoption rate. The increasing complexity of global regulations and the emphasis on sustainability are acting as significant catalysts, making advanced formulation software indispensable for competitive success. The shift towards cloud-based solutions is particularly pronounced, offering enhanced collaboration and real-time data access, which is crucial for agile product development in the fast-paced beauty industry.
Dominant Regions, Countries, or Segments in Cosmetic Formulation Software
The Enterprise segment is unequivocally the dominant force driving growth in the Cosmetic Formulation Software market, commanding an estimated 75% of the market share in 2025. This dominance stems from the inherent needs of larger cosmetic manufacturers for sophisticated features like advanced inventory management, complex multi-ingredient formulation capabilities, and rigorous compliance tracking. Geographically, North America is projected to lead the market, expected to contribute over 35% of the global revenue in 2025. This leadership is propelled by a highly developed beauty industry, a strong emphasis on R&D, and significant investment in digital transformation by major cosmetic corporations. Supportive economic policies that encourage innovation and a robust infrastructure for cloud-based services further bolster its position. Europe follows closely, driven by stringent regulatory landscapes such as REACH, which necessitates advanced software for compliance. The Asia-Pacific region, while currently a smaller contributor, presents the most significant growth potential, fueled by a burgeoning middle class, increasing disposable income, and the rapid expansion of local beauty brands seeking to scale their operations. The cloud-based segment is also experiencing exponential growth, expected to capture 65% of the market by 2025, eclipsing the on-premise solutions due to its flexibility, scalability, and lower initial investment.
- Dominant Segment: Enterprise, accounting for approximately 75% market share in 2025.
- Leading Region: North America, expected to contribute over 35% of global revenue in 2025.
- Key Drivers in North America: Developed beauty industry, R&D investment, digital transformation initiatives.
- Emerging Growth Region: Asia-Pacific, driven by expanding middle class and local brand growth.
- Dominant Deployment Type: Cloud-based, projected to capture 65% market share by 2025.
Cosmetic Formulation Software Product Landscape
The product landscape of Cosmetic Formulation Software is characterized by continuous innovation, focusing on delivering integrated solutions that enhance efficiency and accuracy throughout the product lifecycle. Key innovations include AI-powered ingredient selection for novel formulations, real-time cost analysis and optimization, and sophisticated regulatory compliance modules that automatically flag potential issues. Performance metrics such as reduced formulation time (by up to 40%), improved accuracy in ingredient calculations, and streamlined batch record generation are central to the appeal of these solutions. Unique selling propositions often lie in specialized features like stability testing simulation, sensory profiling integration, and advanced intellectual property protection for proprietary formulas. Technological advancements are pushing towards greater interoperability with laboratory equipment and broader supply chain management systems, creating a holistic ecosystem for beauty product development.
Key Drivers, Barriers & Challenges in Cosmetic Formulation Software
Key Drivers: The Cosmetic Formulation Software market is propelled by several critical factors. The relentless demand for innovation and speed-to-market in the highly competitive beauty industry is paramount. Increasing regulatory complexity and the need for stringent compliance, particularly concerning ingredient safety and sustainability, necessitate robust software solutions. Furthermore, the growing trend towards personalization and clean beauty requires precise formulation control and transparency. Technological advancements, such as AI and cloud computing, are enabling more sophisticated and accessible software.
Barriers & Challenges: Key challenges include the initial cost of adoption, which can be prohibitive for smaller businesses. The complexity of integrating new software with existing legacy systems presents a significant hurdle. Resistance to change among some workforce segments and the need for continuous training can also impede adoption. Supply chain disruptions and the ever-evolving nature of scientific research require constant software updates, adding to maintenance costs. Intense competition among software providers and the potential for data security breaches also pose considerable challenges.
Emerging Opportunities in Cosmetic Formulation Software
Emerging opportunities in the Cosmetic Formulation Software sector are ripe for exploitation. The burgeoning direct-to-consumer (DTC) beauty market and the rise of indie brands present a significant untapped market for more accessible and scalable formulation solutions. The increasing global emphasis on sustainability and eco-friendly product development is driving demand for software with advanced life cycle assessment and ingredient sourcing capabilities. Furthermore, the integration of virtual try-on technologies and augmented reality (AR) within formulation platforms offers exciting prospects for product visualization and consumer engagement. Opportunities also lie in developing specialized modules for niche product categories, such as professional salon products or medical-grade skincare.
Growth Accelerators in the Cosmetic Formulation Software Industry
Several key catalysts are accelerating long-term growth in the Cosmetic Formulation Software industry. Technological breakthroughs, particularly in artificial intelligence for predictive formulation and material science, are creating new avenues for product development. Strategic partnerships between software providers and ingredient suppliers, research institutions, or even beauty retailers can foster ecosystem growth and innovation. Market expansion strategies, targeting emerging economies with rapidly growing beauty markets, offer substantial revenue potential. Furthermore, the increasing demand for data analytics and insights within R&D departments is driving the adoption of software that can provide actionable intelligence on market trends and consumer preferences.
Key Players Shaping the Cosmetic Formulation Software Market
- Microsoft
- SAP
- Katana MRP
- BatchMaster Software
- cosmetri GmbH
- Coptis
- ProcessPro
- Formulator Software
- Stratotec
- beCPG
Notable Milestones in Cosmetic Formulation Software Sector
- 2019-2021: Increased adoption of cloud-based solutions driven by remote work trends and the need for greater accessibility.
- 2020: Significant investment in AI and machine learning capabilities for ingredient discovery and formulation optimization by leading software providers.
- 2021: Launch of enhanced sustainability tracking features in several formulation software platforms in response to growing consumer demand.
- 2022: Emergence of specialized formulation software catering to the rapidly growing indie beauty brand segment.
- 2023: Increased M&A activity as larger players sought to acquire innovative technologies and expand their market reach.
- 2024: Growing integration of formulation software with broader ERP and supply chain management systems for end-to-end visibility.
In-Depth Cosmetic Formulation Software Market Outlook
The Cosmetic Formulation Software market is set for a future characterized by sustained growth and innovation. The increasing reliance on digital tools for product development, coupled with evolving consumer demands for personalized, sustainable, and transparent beauty products, will continue to fuel market expansion. Growth accelerators such as advancements in AI, the development of specialized modules for niche markets, and strategic partnerships will further propel the industry forward. The ongoing shift towards cloud-based solutions will democratize access to powerful formulation tools, empowering a wider range of businesses. Strategic opportunities lie in leveraging data analytics for predictive formulation, enhancing interoperability across the value chain, and addressing the specific needs of emerging markets, ensuring a vibrant and dynamic future for cosmetic innovation.
Cosmetic Formulation Software Segmentation
-
1. Application
- 1.1. Personal
- 1.2. Enterprise
-
2. Type
- 2.1. On-premise
- 2.2. Cloud-based
Cosmetic Formulation Software Segmentation By Geography
-
1. North America
- 1.1. United States
- 1.2. Canada
- 1.3. Mexico
-
2. South America
- 2.1. Brazil
- 2.2. Argentina
- 2.3. Rest of South America
-
3. Europe
- 3.1. United Kingdom
- 3.2. Germany
- 3.3. France
- 3.4. Italy
- 3.5. Spain
- 3.6. Russia
- 3.7. Benelux
- 3.8. Nordics
- 3.9. Rest of Europe
-
4. Middle East & Africa
- 4.1. Turkey
- 4.2. Israel
- 4.3. GCC
- 4.4. North Africa
- 4.5. South Africa
- 4.6. Rest of Middle East & Africa
-
5. Asia Pacific
- 5.1. China
- 5.2. India
- 5.3. Japan
- 5.4. South Korea
- 5.5. ASEAN
- 5.6. Oceania
- 5.7. Rest of Asia Pacific
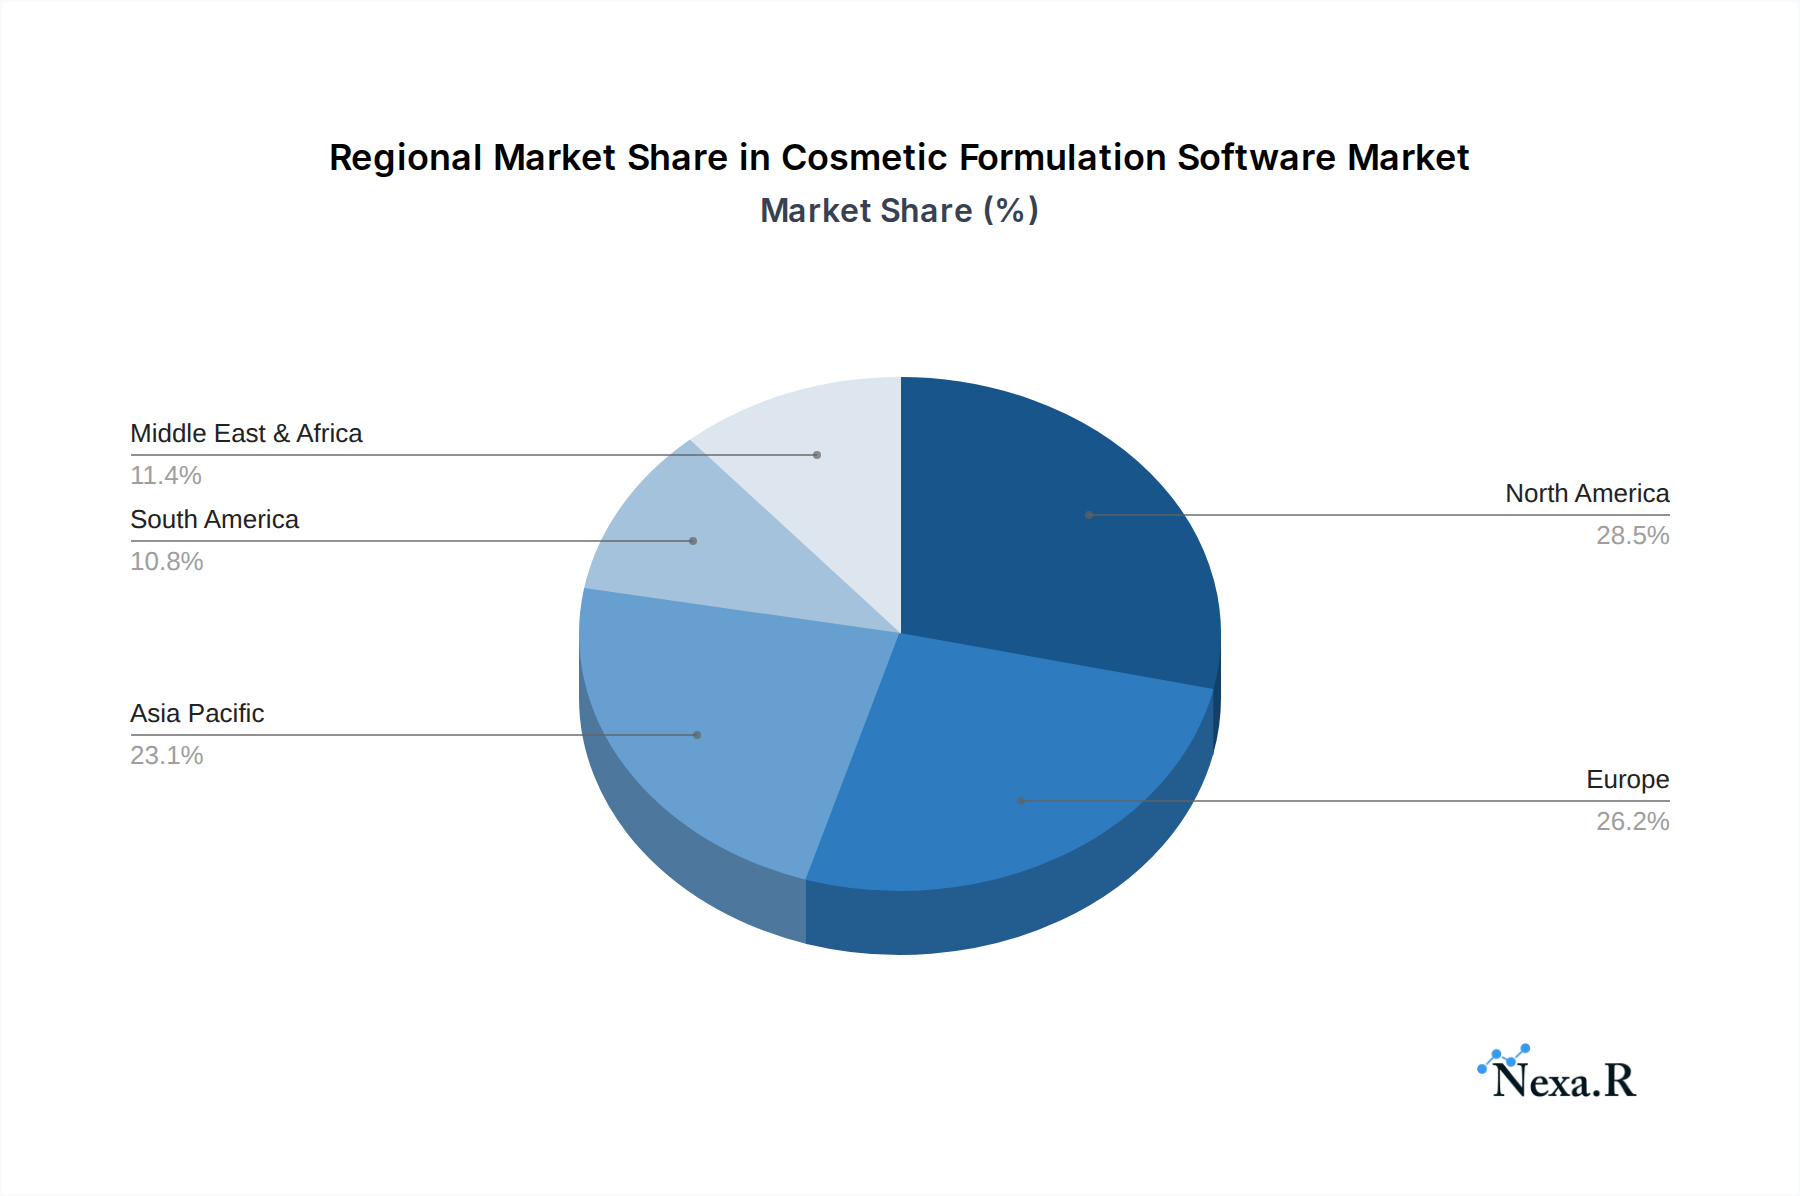
Cosmetic Formulation Software Regional Market Share
Geographic Coverage of Cosmetic Formulation Software
Cosmetic Formulation Software REPORT HIGHLIGHTS
| Aspects | Details |
|---|---|
| Study Period | 2020-2034 |
| Base Year | 2025 |
| Estimated Year | 2026 |
| Forecast Period | 2026-2034 |
| Historical Period | 2020-2025 |
| Growth Rate | CAGR of 10.5% from 2020-2034 |
| Segmentation |
|
Table of Contents
- 1. Introduction
- 1.1. Research Scope
- 1.2. Market Segmentation
- 1.3. Research Methodology
- 1.4. Definitions and Assumptions
- 2. Executive Summary
- 2.1. Introduction
- 3. Market Dynamics
- 3.1. Introduction
- 3.2. Market Drivers
- 3.3. Market Restrains
- 3.4. Market Trends
- 4. Market Factor Analysis
- 4.1. Porters Five Forces
- 4.2. Supply/Value Chain
- 4.3. PESTEL analysis
- 4.4. Market Entropy
- 4.5. Patent/Trademark Analysis
- 5. Global Cosmetic Formulation Software Analysis, Insights and Forecast, 2020-2032
- 5.1. Market Analysis, Insights and Forecast - by Application
- 5.1.1. Personal
- 5.1.2. Enterprise
- 5.2. Market Analysis, Insights and Forecast - by Type
- 5.2.1. On-premise
- 5.2.2. Cloud-based
- 5.3. Market Analysis, Insights and Forecast - by Region
- 5.3.1. North America
- 5.3.2. South America
- 5.3.3. Europe
- 5.3.4. Middle East & Africa
- 5.3.5. Asia Pacific
- 5.1. Market Analysis, Insights and Forecast - by Application
- 6. North America Cosmetic Formulation Software Analysis, Insights and Forecast, 2020-2032
- 6.1. Market Analysis, Insights and Forecast - by Application
- 6.1.1. Personal
- 6.1.2. Enterprise
- 6.2. Market Analysis, Insights and Forecast - by Type
- 6.2.1. On-premise
- 6.2.2. Cloud-based
- 6.1. Market Analysis, Insights and Forecast - by Application
- 7. South America Cosmetic Formulation Software Analysis, Insights and Forecast, 2020-2032
- 7.1. Market Analysis, Insights and Forecast - by Application
- 7.1.1. Personal
- 7.1.2. Enterprise
- 7.2. Market Analysis, Insights and Forecast - by Type
- 7.2.1. On-premise
- 7.2.2. Cloud-based
- 7.1. Market Analysis, Insights and Forecast - by Application
- 8. Europe Cosmetic Formulation Software Analysis, Insights and Forecast, 2020-2032
- 8.1. Market Analysis, Insights and Forecast - by Application
- 8.1.1. Personal
- 8.1.2. Enterprise
- 8.2. Market Analysis, Insights and Forecast - by Type
- 8.2.1. On-premise
- 8.2.2. Cloud-based
- 8.1. Market Analysis, Insights and Forecast - by Application
- 9. Middle East & Africa Cosmetic Formulation Software Analysis, Insights and Forecast, 2020-2032
- 9.1. Market Analysis, Insights and Forecast - by Application
- 9.1.1. Personal
- 9.1.2. Enterprise
- 9.2. Market Analysis, Insights and Forecast - by Type
- 9.2.1. On-premise
- 9.2.2. Cloud-based
- 9.1. Market Analysis, Insights and Forecast - by Application
- 10. Asia Pacific Cosmetic Formulation Software Analysis, Insights and Forecast, 2020-2032
- 10.1. Market Analysis, Insights and Forecast - by Application
- 10.1.1. Personal
- 10.1.2. Enterprise
- 10.2. Market Analysis, Insights and Forecast - by Type
- 10.2.1. On-premise
- 10.2.2. Cloud-based
- 10.1. Market Analysis, Insights and Forecast - by Application
- 11. Competitive Analysis
- 11.1. Global Market Share Analysis 2025
- 11.2. Company Profiles
- 11.2.1 Microsoft
- 11.2.1.1. Overview
- 11.2.1.2. Products
- 11.2.1.3. SWOT Analysis
- 11.2.1.4. Recent Developments
- 11.2.1.5. Financials (Based on Availability)
- 11.2.2 SAP
- 11.2.2.1. Overview
- 11.2.2.2. Products
- 11.2.2.3. SWOT Analysis
- 11.2.2.4. Recent Developments
- 11.2.2.5. Financials (Based on Availability)
- 11.2.3 Katana MRP
- 11.2.3.1. Overview
- 11.2.3.2. Products
- 11.2.3.3. SWOT Analysis
- 11.2.3.4. Recent Developments
- 11.2.3.5. Financials (Based on Availability)
- 11.2.4 BatchMaster Software
- 11.2.4.1. Overview
- 11.2.4.2. Products
- 11.2.4.3. SWOT Analysis
- 11.2.4.4. Recent Developments
- 11.2.4.5. Financials (Based on Availability)
- 11.2.5 cosmetri GmbH
- 11.2.5.1. Overview
- 11.2.5.2. Products
- 11.2.5.3. SWOT Analysis
- 11.2.5.4. Recent Developments
- 11.2.5.5. Financials (Based on Availability)
- 11.2.6 Coptis
- 11.2.6.1. Overview
- 11.2.6.2. Products
- 11.2.6.3. SWOT Analysis
- 11.2.6.4. Recent Developments
- 11.2.6.5. Financials (Based on Availability)
- 11.2.7 ProcessPro
- 11.2.7.1. Overview
- 11.2.7.2. Products
- 11.2.7.3. SWOT Analysis
- 11.2.7.4. Recent Developments
- 11.2.7.5. Financials (Based on Availability)
- 11.2.8 Formulator Software
- 11.2.8.1. Overview
- 11.2.8.2. Products
- 11.2.8.3. SWOT Analysis
- 11.2.8.4. Recent Developments
- 11.2.8.5. Financials (Based on Availability)
- 11.2.9 Stratotec
- 11.2.9.1. Overview
- 11.2.9.2. Products
- 11.2.9.3. SWOT Analysis
- 11.2.9.4. Recent Developments
- 11.2.9.5. Financials (Based on Availability)
- 11.2.10 beCPG
- 11.2.10.1. Overview
- 11.2.10.2. Products
- 11.2.10.3. SWOT Analysis
- 11.2.10.4. Recent Developments
- 11.2.10.5. Financials (Based on Availability)
- 11.2.1 Microsoft
List of Figures
- Figure 1: Global Cosmetic Formulation Software Revenue Breakdown (billion, %) by Region 2025 & 2033
- Figure 2: North America Cosmetic Formulation Software Revenue (billion), by Application 2025 & 2033
- Figure 3: North America Cosmetic Formulation Software Revenue Share (%), by Application 2025 & 2033
- Figure 4: North America Cosmetic Formulation Software Revenue (billion), by Type 2025 & 2033
- Figure 5: North America Cosmetic Formulation Software Revenue Share (%), by Type 2025 & 2033
- Figure 6: North America Cosmetic Formulation Software Revenue (billion), by Country 2025 & 2033
- Figure 7: North America Cosmetic Formulation Software Revenue Share (%), by Country 2025 & 2033
- Figure 8: South America Cosmetic Formulation Software Revenue (billion), by Application 2025 & 2033
- Figure 9: South America Cosmetic Formulation Software Revenue Share (%), by Application 2025 & 2033
- Figure 10: South America Cosmetic Formulation Software Revenue (billion), by Type 2025 & 2033
- Figure 11: South America Cosmetic Formulation Software Revenue Share (%), by Type 2025 & 2033
- Figure 12: South America Cosmetic Formulation Software Revenue (billion), by Country 2025 & 2033
- Figure 13: South America Cosmetic Formulation Software Revenue Share (%), by Country 2025 & 2033
- Figure 14: Europe Cosmetic Formulation Software Revenue (billion), by Application 2025 & 2033
- Figure 15: Europe Cosmetic Formulation Software Revenue Share (%), by Application 2025 & 2033
- Figure 16: Europe Cosmetic Formulation Software Revenue (billion), by Type 2025 & 2033
- Figure 17: Europe Cosmetic Formulation Software Revenue Share (%), by Type 2025 & 2033
- Figure 18: Europe Cosmetic Formulation Software Revenue (billion), by Country 2025 & 2033
- Figure 19: Europe Cosmetic Formulation Software Revenue Share (%), by Country 2025 & 2033
- Figure 20: Middle East & Africa Cosmetic Formulation Software Revenue (billion), by Application 2025 & 2033
- Figure 21: Middle East & Africa Cosmetic Formulation Software Revenue Share (%), by Application 2025 & 2033
- Figure 22: Middle East & Africa Cosmetic Formulation Software Revenue (billion), by Type 2025 & 2033
- Figure 23: Middle East & Africa Cosmetic Formulation Software Revenue Share (%), by Type 2025 & 2033
- Figure 24: Middle East & Africa Cosmetic Formulation Software Revenue (billion), by Country 2025 & 2033
- Figure 25: Middle East & Africa Cosmetic Formulation Software Revenue Share (%), by Country 2025 & 2033
- Figure 26: Asia Pacific Cosmetic Formulation Software Revenue (billion), by Application 2025 & 2033
- Figure 27: Asia Pacific Cosmetic Formulation Software Revenue Share (%), by Application 2025 & 2033
- Figure 28: Asia Pacific Cosmetic Formulation Software Revenue (billion), by Type 2025 & 2033
- Figure 29: Asia Pacific Cosmetic Formulation Software Revenue Share (%), by Type 2025 & 2033
- Figure 30: Asia Pacific Cosmetic Formulation Software Revenue (billion), by Country 2025 & 2033
- Figure 31: Asia Pacific Cosmetic Formulation Software Revenue Share (%), by Country 2025 & 2033
List of Tables
- Table 1: Global Cosmetic Formulation Software Revenue billion Forecast, by Application 2020 & 2033
- Table 2: Global Cosmetic Formulation Software Revenue billion Forecast, by Type 2020 & 2033
- Table 3: Global Cosmetic Formulation Software Revenue billion Forecast, by Region 2020 & 2033
- Table 4: Global Cosmetic Formulation Software Revenue billion Forecast, by Application 2020 & 2033
- Table 5: Global Cosmetic Formulation Software Revenue billion Forecast, by Type 2020 & 2033
- Table 6: Global Cosmetic Formulation Software Revenue billion Forecast, by Country 2020 & 2033
- Table 7: United States Cosmetic Formulation Software Revenue (billion) Forecast, by Application 2020 & 2033
- Table 8: Canada Cosmetic Formulation Software Revenue (billion) Forecast, by Application 2020 & 2033
- Table 9: Mexico Cosmetic Formulation Software Revenue (billion) Forecast, by Application 2020 & 2033
- Table 10: Global Cosmetic Formulation Software Revenue billion Forecast, by Application 2020 & 2033
- Table 11: Global Cosmetic Formulation Software Revenue billion Forecast, by Type 2020 & 2033
- Table 12: Global Cosmetic Formulation Software Revenue billion Forecast, by Country 2020 & 2033
- Table 13: Brazil Cosmetic Formulation Software Revenue (billion) Forecast, by Application 2020 & 2033
- Table 14: Argentina Cosmetic Formulation Software Revenue (billion) Forecast, by Application 2020 & 2033
- Table 15: Rest of South America Cosmetic Formulation Software Revenue (billion) Forecast, by Application 2020 & 2033
- Table 16: Global Cosmetic Formulation Software Revenue billion Forecast, by Application 2020 & 2033
- Table 17: Global Cosmetic Formulation Software Revenue billion Forecast, by Type 2020 & 2033
- Table 18: Global Cosmetic Formulation Software Revenue billion Forecast, by Country 2020 & 2033
- Table 19: United Kingdom Cosmetic Formulation Software Revenue (billion) Forecast, by Application 2020 & 2033
- Table 20: Germany Cosmetic Formulation Software Revenue (billion) Forecast, by Application 2020 & 2033
- Table 21: France Cosmetic Formulation Software Revenue (billion) Forecast, by Application 2020 & 2033
- Table 22: Italy Cosmetic Formulation Software Revenue (billion) Forecast, by Application 2020 & 2033
- Table 23: Spain Cosmetic Formulation Software Revenue (billion) Forecast, by Application 2020 & 2033
- Table 24: Russia Cosmetic Formulation Software Revenue (billion) Forecast, by Application 2020 & 2033
- Table 25: Benelux Cosmetic Formulation Software Revenue (billion) Forecast, by Application 2020 & 2033
- Table 26: Nordics Cosmetic Formulation Software Revenue (billion) Forecast, by Application 2020 & 2033
- Table 27: Rest of Europe Cosmetic Formulation Software Revenue (billion) Forecast, by Application 2020 & 2033
- Table 28: Global Cosmetic Formulation Software Revenue billion Forecast, by Application 2020 & 2033
- Table 29: Global Cosmetic Formulation Software Revenue billion Forecast, by Type 2020 & 2033
- Table 30: Global Cosmetic Formulation Software Revenue billion Forecast, by Country 2020 & 2033
- Table 31: Turkey Cosmetic Formulation Software Revenue (billion) Forecast, by Application 2020 & 2033
- Table 32: Israel Cosmetic Formulation Software Revenue (billion) Forecast, by Application 2020 & 2033
- Table 33: GCC Cosmetic Formulation Software Revenue (billion) Forecast, by Application 2020 & 2033
- Table 34: North Africa Cosmetic Formulation Software Revenue (billion) Forecast, by Application 2020 & 2033
- Table 35: South Africa Cosmetic Formulation Software Revenue (billion) Forecast, by Application 2020 & 2033
- Table 36: Rest of Middle East & Africa Cosmetic Formulation Software Revenue (billion) Forecast, by Application 2020 & 2033
- Table 37: Global Cosmetic Formulation Software Revenue billion Forecast, by Application 2020 & 2033
- Table 38: Global Cosmetic Formulation Software Revenue billion Forecast, by Type 2020 & 2033
- Table 39: Global Cosmetic Formulation Software Revenue billion Forecast, by Country 2020 & 2033
- Table 40: China Cosmetic Formulation Software Revenue (billion) Forecast, by Application 2020 & 2033
- Table 41: India Cosmetic Formulation Software Revenue (billion) Forecast, by Application 2020 & 2033
- Table 42: Japan Cosmetic Formulation Software Revenue (billion) Forecast, by Application 2020 & 2033
- Table 43: South Korea Cosmetic Formulation Software Revenue (billion) Forecast, by Application 2020 & 2033
- Table 44: ASEAN Cosmetic Formulation Software Revenue (billion) Forecast, by Application 2020 & 2033
- Table 45: Oceania Cosmetic Formulation Software Revenue (billion) Forecast, by Application 2020 & 2033
- Table 46: Rest of Asia Pacific Cosmetic Formulation Software Revenue (billion) Forecast, by Application 2020 & 2033
Frequently Asked Questions
1. What is the projected Compound Annual Growth Rate (CAGR) of the Cosmetic Formulation Software?
The projected CAGR is approximately 10.5%.
2. Which companies are prominent players in the Cosmetic Formulation Software?
Key companies in the market include Microsoft, SAP, Katana MRP, BatchMaster Software, cosmetri GmbH, Coptis, ProcessPro, Formulator Software, Stratotec, beCPG.
3. What are the main segments of the Cosmetic Formulation Software?
The market segments include Application, Type.
4. Can you provide details about the market size?
The market size is estimated to be USD 1.26 billion as of 2022.
5. What are some drivers contributing to market growth?
N/A
6. What are the notable trends driving market growth?
N/A
7. Are there any restraints impacting market growth?
N/A
8. Can you provide examples of recent developments in the market?
N/A
9. What pricing options are available for accessing the report?
Pricing options include single-user, multi-user, and enterprise licenses priced at USD 4250.00, USD 6375.00, and USD 8500.00 respectively.
10. Is the market size provided in terms of value or volume?
The market size is provided in terms of value, measured in billion.
11. Are there any specific market keywords associated with the report?
Yes, the market keyword associated with the report is "Cosmetic Formulation Software," which aids in identifying and referencing the specific market segment covered.
12. How do I determine which pricing option suits my needs best?
The pricing options vary based on user requirements and access needs. Individual users may opt for single-user licenses, while businesses requiring broader access may choose multi-user or enterprise licenses for cost-effective access to the report.
13. Are there any additional resources or data provided in the Cosmetic Formulation Software report?
While the report offers comprehensive insights, it's advisable to review the specific contents or supplementary materials provided to ascertain if additional resources or data are available.
14. How can I stay updated on further developments or reports in the Cosmetic Formulation Software?
To stay informed about further developments, trends, and reports in the Cosmetic Formulation Software, consider subscribing to industry newsletters, following relevant companies and organizations, or regularly checking reputable industry news sources and publications.
Methodology
Step 1 - Identification of Relevant Samples Size from Population Database


Step 2 - Approaches for Defining Global Market Size (Value, Volume* & Price*)

Note*: In applicable scenarios
Step 3 - Data Sources
Primary Research
- Web Analytics
- Survey Reports
- Research Institute
- Latest Research Reports
- Opinion Leaders
Secondary Research
- Annual Reports
- White Paper
- Latest Press Release
- Industry Association
- Paid Database
- Investor Presentations

Step 4 - Data Triangulation
Involves using different sources of information in order to increase the validity of a study
These sources are likely to be stakeholders in a program - participants, other researchers, program staff, other community members, and so on.
Then we put all data in single framework & apply various statistical tools to find out the dynamic on the market.
During the analysis stage, feedback from the stakeholder groups would be compared to determine areas of agreement as well as areas of divergence