

Key Insights
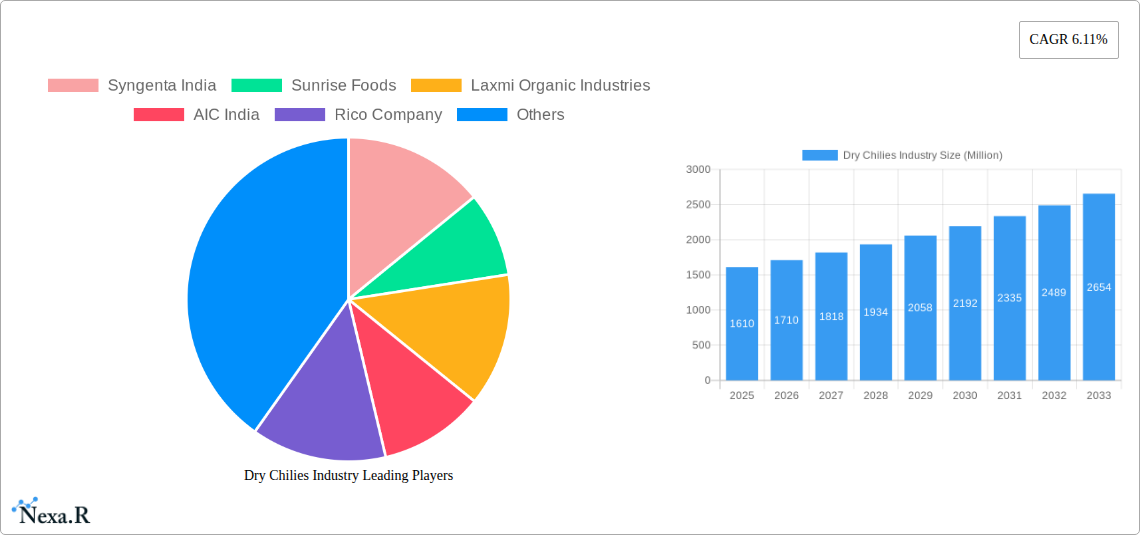
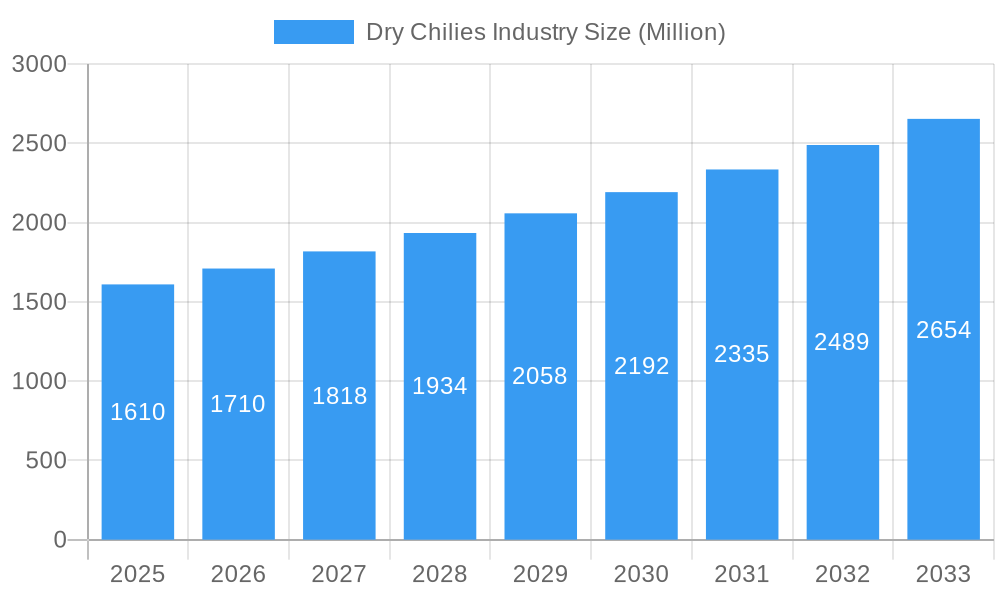
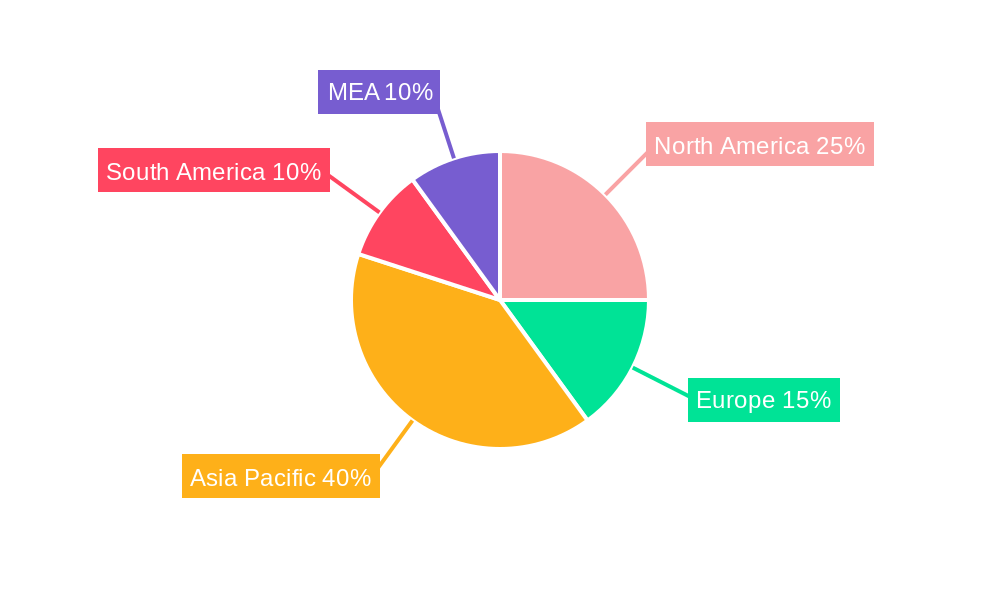
The global dry chilies market, valued at $1.61 billion in 2025, is projected to experience robust growth, driven by a compound annual growth rate (CAGR) of 6.11% from 2025 to 2033. This expansion is fueled by several key factors. Increasing demand from the food and beverage industry, particularly in processed foods, sauces, and spice blends, is a significant driver. The growing popularity of ethnic cuisines globally further boosts consumption. Furthermore, the use of dry chilies in pharmaceuticals (capsaicin-based remedies), cosmetics (skincare products), and even pesticides contributes to market diversification and growth. The market is segmented by product type (Guajillo, Ancho, Chipotle, Pasilla, California Chili) and application, reflecting diverse usage across various industries. Leading companies like Syngenta India, Sunrise Foods, Laxmi Organic Industries, AIC India, and Rico Company are actively shaping market dynamics through innovation and expansion. Regional variations in consumption patterns are observed, with North America and Asia Pacific representing significant market shares, driven by robust demand and established supply chains. While challenges such as fluctuating raw material prices and weather patterns affecting chili yields may present restraints, the overall market outlook remains positive, driven by consistent demand and ongoing product diversification.
Dry Chilies Industry Market Size (In Billion)
The forecast period of 2025-2033 anticipates continued expansion, with growth potentially accelerating as new applications for dry chilies are discovered and consumer preferences evolve. The Asia-Pacific region, specifically India and China, is expected to witness significant growth due to high chili consumption rates and expanding processing industries. North America will also maintain a substantial market share due to established distribution networks and increasing demand for spicy food products. Strategic collaborations between chili producers, food processors, and ingredient suppliers will likely further propel market growth in the coming years. Innovation in chili processing technologies, ensuring consistent quality and extended shelf life, will also play a crucial role in shaping market trends. This positive outlook underscores the significant potential of the dry chilies market for investors and stakeholders.
Dry Chilies Industry Company Market Share
Dry Chilies Industry Market Report: 2019-2033
This comprehensive report provides an in-depth analysis of the global dry chilies industry, encompassing market dynamics, growth trends, regional segmentation, product landscape, key players, and future outlook. The study covers the period 2019-2033, with a base year of 2025 and a forecast period of 2025-2033. The report segments the market by product type (Guajillo, Ancho, Chipotle, Pasilla, California Chili) and application (food and beverage, pharmaceuticals, cosmetics, pesticides), offering granular insights into this dynamic sector. This report is crucial for industry professionals, investors, and strategists seeking to understand and capitalize on opportunities within the dry chilies market.
Dry Chilies Industry Market Dynamics & Structure
The global dry chilies market is characterized by moderate concentration, with a few large players alongside numerous smaller regional producers. Technological innovation, primarily focused on improving yield, quality, and processing efficiency, plays a crucial role. Regulatory frameworks vary across regions, influencing production practices and trade. Competitive substitutes include other spices and flavoring agents, impacting market share. End-user demographics are influenced by culinary traditions and health trends. M&A activity remains moderate, with strategic acquisitions aimed at expanding geographical reach and product portfolios.
- Market Concentration: Moderately concentrated, with top 5 players holding approximately xx% market share in 2024.
- Technological Innovation: Focus on improving yield through hybrid seeds and efficient drying techniques. Barriers include access to technology and high initial investment costs.
- Regulatory Frameworks: Vary widely across regions, impacting production standards and trade policies.
- Competitive Substitutes: Other spices, flavoring agents, and artificial alternatives exert competitive pressure.
- End-User Demographics: Driven by evolving culinary trends and increasing demand for natural ingredients in diverse applications.
- M&A Trends: xx M&A deals recorded between 2019-2024, primarily focused on vertical integration and geographical expansion.
Dry Chilies Industry Growth Trends & Insights
The global dry chilies market is experiencing a dynamic period of expansion, projected to achieve a Compound Annual Growth Rate (CAGR) of approximately [Insert updated CAGR value]% during the historical period (2019-2024). This surge is primarily fueled by the escalating demand from the food and beverage industry, coupled with a broadening spectrum of applications across diverse sectors. The market size impressively reached [Insert updated market size value] million units in 2024 and is on track to ascend to an estimated [Insert updated projected market size value] million units by 2033, reflecting a robust CAGR of [Insert updated forecast CAGR value]% during the forecast period (2025-2033).
Key catalysts for this growth include significant technological advancements. Innovations in improved seed varieties are enhancing crop yields and resilience, while the adoption of more efficient processing methods is leading to higher quality products and reduced waste. Furthermore, a pronounced shift in consumer preferences towards natural and organic food products is providing a substantial boost to the market. Emerging economies are expected to witness a significant increase in market penetration, serving as potent engines for overall market expansion. However, it's crucial to acknowledge the existing challenges posed by climate change impacts on cultivation and potential supply chain disruptions, which require strategic mitigation efforts.
Dominant Regions, Countries, or Segments in Dry Chilies Industry
The dry chilies market is largely dominated by key regions including India, Mexico, and China. These regions benefit immensely from highly favorable climatic conditions conducive to chili cultivation and boast established large-scale production capabilities. Within the diverse product landscape, the Ancho and Chipotle segments command a significant market share, primarily owing to their widespread versatility and essential role in a multitude of culinary applications globally. The food and beverage industry continues to be the paramount end-use segment, accounting for an estimated [Insert updated percentage value]% of the total market demand in 2024.
- Key Drivers: A confluence of favorable climatic conditions, deeply entrenched and refined cultivation practices, and substantial government support initiatives in key producing nations are pivotal to sustained market growth.
- India: Stands out with its immense domestic consumption coupled with significant export potential, further bolstered by supportive government policies and a thriving agricultural sector.
- Mexico: Holds a formidable position due to its substantial production of specific, highly sought-after varieties like Chipotle and Ancho, and a robust global export market for these products.
- China: Exhibits high domestic demand for dry chilies, supported by a rapidly growing processing industry and extensive production across a wide array of chili varieties.
- Food & Beverage Industry: Remains the undisputed dominant end-use sector, experiencing continuous growth driven by the increasing consumer appetite for chili-infused products such as sauces, pastes, and seasonings.
Dry Chilies Industry Product Landscape
The dry chilies market offers a diverse range of products, including Guajillo, Ancho, Chipotle, Pasilla, and California Chili, each with unique flavor profiles and applications. Technological advancements have focused on improving drying techniques to preserve flavor and quality, as well as developing new varieties with enhanced pungency or sweetness. Unique selling propositions often center around origin, flavor profile, and quality certifications.
Key Drivers, Barriers & Challenges in Dry Chilies Industry
Key Drivers:
- Growing demand from the food and beverage industry.
- Increasing use in other sectors, such as pharmaceuticals and cosmetics.
- Favorable climatic conditions in key producing regions.
- Government support and investments in research and development.
Key Challenges & Restraints:
- Price volatility due to weather patterns and fluctuating demand.
- Supply chain disruptions and logistical challenges.
- Labor shortages and increasing production costs.
- Stringent regulatory requirements for food safety and quality. These factors resulted in a xx% decrease in supply in 2022, impacting overall market growth.
Emerging Opportunities in Dry Chilies Industry
- Expansion into new markets, particularly in emerging economies.
- Development of value-added products, such as chili powder blends and extracts.
- Growing demand for organic and sustainably produced dry chilies.
- Exploration of novel applications in the healthcare and cosmetic industries.
Growth Accelerators in the Dry Chilies Industry
The dry chilies industry is being significantly propelled forward by a wave of innovation and strategic development. Technological breakthroughs in advanced seed development are yielding more resilient and higher-yielding chili varieties. Concurrently, the refinement of farming practices and the implementation of highly efficient processing techniques are contributing to improved product quality and cost-effectiveness. Strategic partnerships, forming crucial links between farmers, processors, and leading food companies, are instrumental in optimizing supply chain management, ensuring timely delivery and consistent quality. Furthermore, the successful expansion into previously untapped new markets and a growing consumer awareness regarding the manifold health benefits associated with chili consumption are creating fertile ground for further market opportunities.
Key Players Shaping the Dry Chilies Industry Market
- Syngenta India
- Sunrise Foods
- Laxmi Organic Industries
- AIC India
- Rico Company
- [Add more key players if available and relevant]
Notable Milestones in Dry Chilies Industry Sector
- November 2022: Indonesian government implements strategic policies to boost domestic chili production, reducing reliance on imports. This initiative is expected to positively impact regional market dynamics by increasing supply and reducing price volatility.
- June 2022: Syngenta India partners with AIC to provide price risk protection for farmers, enhancing agricultural stability and improving long-term supply predictability.
In-Depth Dry Chilies Industry Market Outlook
The dry chilies market is exceptionally well-positioned for sustained and robust growth over the next decade. This optimistic outlook is underpinned by the consistent and increasing demand originating from the food and beverage sector, coupled with the successful exploration and adoption of dry chilies in a wider array of novel applications. Ongoing advancements in processing technologies and cultivation methods will further solidify this growth trajectory. Strategic opportunities abound for stakeholders who can focus on developing innovative value-added products, enhancing the efficiency and resilience of supply chains, and actively pursuing market penetration in emerging economies. The increasing global emphasis on sustainability and the growing demand for organically produced goods will undoubtedly play a pivotal role in shaping the future landscape of the dry chilies market, presenting both challenges and significant opportunities for forward-thinking businesses.
Dry Chilies Industry Segmentation
- 1. Production Analysis
- 2. Consumption Analysis
- 3. Import Market Analysis (Value & Volume)
- 4. Export Market Analysis (Value & Volume)
- 5. Price Trend Analysis
Dry Chilies Industry Segmentation By Geography
-
1. North America
- 1.1. United States
- 1.2. Canada
- 1.3. Mexico
-
2. Europe
- 2.1. United Kingdom
- 2.2. Germany
- 2.3. France
- 2.4. Spain
-
3. Asia Pacific
- 3.1. China
- 3.2. Australia
- 3.3. India
-
4. South America
- 4.1. Brazil
- 4.2. Argentina
-
5. Africa
- 5.1. South Africa
- 5.2. Egypt
Dry Chilies Industry Regional Market Share
Geographic Coverage of Dry Chilies Industry
Dry Chilies Industry REPORT HIGHLIGHTS
| Aspects | Details |
|---|---|
| Study Period | 2020-2034 |
| Base Year | 2025 |
| Estimated Year | 2026 |
| Forecast Period | 2026-2034 |
| Historical Period | 2020-2025 |
| Growth Rate | CAGR of 6.11% from 2020-2034 |
| Segmentation |
|
Table of Contents
- 1. Introduction
- 1.1. Research Scope
- 1.2. Market Segmentation
- 1.3. Research Methodology
- 1.4. Definitions and Assumptions
- 2. Executive Summary
- 2.1. Introduction
- 3. Market Dynamics
- 3.1. Introduction
- 3.2. Market Drivers
- 3.2.1. Increasing Berry Consumption for Health Benefits; Increasing Adoption of High-Technology Farm Practices; Growing Usage of Berries in the Food and Beverage Industries
- 3.3. Market Restrains
- 3.3.1. High Production Cost Involved in Berry Production; Increasing Disease and Pest Infestations
- 3.4. Market Trends
- 3.4.1. High Demand for the Exotic and Spicy Oriental Dishes
- 4. Market Factor Analysis
- 4.1. Porters Five Forces
- 4.2. Supply/Value Chain
- 4.3. PESTEL analysis
- 4.4. Market Entropy
- 4.5. Patent/Trademark Analysis
- 5. Global Dry Chilies Industry Analysis, Insights and Forecast, 2020-2032
- 5.1. Market Analysis, Insights and Forecast - by Production Analysis
- 5.2. Market Analysis, Insights and Forecast - by Consumption Analysis
- 5.3. Market Analysis, Insights and Forecast - by Import Market Analysis (Value & Volume)
- 5.4. Market Analysis, Insights and Forecast - by Export Market Analysis (Value & Volume)
- 5.5. Market Analysis, Insights and Forecast - by Price Trend Analysis
- 5.6. Market Analysis, Insights and Forecast - by Region
- 5.6.1. North America
- 5.6.2. Europe
- 5.6.3. Asia Pacific
- 5.6.4. South America
- 5.6.5. Africa
- 5.1. Market Analysis, Insights and Forecast - by Production Analysis
- 6. North America Dry Chilies Industry Analysis, Insights and Forecast, 2020-2032
- 6.1. Market Analysis, Insights and Forecast - by Production Analysis
- 6.2. Market Analysis, Insights and Forecast - by Consumption Analysis
- 6.3. Market Analysis, Insights and Forecast - by Import Market Analysis (Value & Volume)
- 6.4. Market Analysis, Insights and Forecast - by Export Market Analysis (Value & Volume)
- 6.5. Market Analysis, Insights and Forecast - by Price Trend Analysis
- 6.1. Market Analysis, Insights and Forecast - by Production Analysis
- 7. Europe Dry Chilies Industry Analysis, Insights and Forecast, 2020-2032
- 7.1. Market Analysis, Insights and Forecast - by Production Analysis
- 7.2. Market Analysis, Insights and Forecast - by Consumption Analysis
- 7.3. Market Analysis, Insights and Forecast - by Import Market Analysis (Value & Volume)
- 7.4. Market Analysis, Insights and Forecast - by Export Market Analysis (Value & Volume)
- 7.5. Market Analysis, Insights and Forecast - by Price Trend Analysis
- 7.1. Market Analysis, Insights and Forecast - by Production Analysis
- 8. Asia Pacific Dry Chilies Industry Analysis, Insights and Forecast, 2020-2032
- 8.1. Market Analysis, Insights and Forecast - by Production Analysis
- 8.2. Market Analysis, Insights and Forecast - by Consumption Analysis
- 8.3. Market Analysis, Insights and Forecast - by Import Market Analysis (Value & Volume)
- 8.4. Market Analysis, Insights and Forecast - by Export Market Analysis (Value & Volume)
- 8.5. Market Analysis, Insights and Forecast - by Price Trend Analysis
- 8.1. Market Analysis, Insights and Forecast - by Production Analysis
- 9. South America Dry Chilies Industry Analysis, Insights and Forecast, 2020-2032
- 9.1. Market Analysis, Insights and Forecast - by Production Analysis
- 9.2. Market Analysis, Insights and Forecast - by Consumption Analysis
- 9.3. Market Analysis, Insights and Forecast - by Import Market Analysis (Value & Volume)
- 9.4. Market Analysis, Insights and Forecast - by Export Market Analysis (Value & Volume)
- 9.5. Market Analysis, Insights and Forecast - by Price Trend Analysis
- 9.1. Market Analysis, Insights and Forecast - by Production Analysis
- 10. Africa Dry Chilies Industry Analysis, Insights and Forecast, 2020-2032
- 10.1. Market Analysis, Insights and Forecast - by Production Analysis
- 10.2. Market Analysis, Insights and Forecast - by Consumption Analysis
- 10.3. Market Analysis, Insights and Forecast - by Import Market Analysis (Value & Volume)
- 10.4. Market Analysis, Insights and Forecast - by Export Market Analysis (Value & Volume)
- 10.5. Market Analysis, Insights and Forecast - by Price Trend Analysis
- 10.1. Market Analysis, Insights and Forecast - by Production Analysis
- 11. Competitive Analysis
- 11.1. Global Market Share Analysis 2025
- 11.2. Company Profiles
- 11.2.1 Syngenta India
- 11.2.1.1. Overview
- 11.2.1.2. Products
- 11.2.1.3. SWOT Analysis
- 11.2.1.4. Recent Developments
- 11.2.1.5. Financials (Based on Availability)
- 11.2.2 Sunrise Foods
- 11.2.2.1. Overview
- 11.2.2.2. Products
- 11.2.2.3. SWOT Analysis
- 11.2.2.4. Recent Developments
- 11.2.2.5. Financials (Based on Availability)
- 11.2.3 Laxmi Organic Industries
- 11.2.3.1. Overview
- 11.2.3.2. Products
- 11.2.3.3. SWOT Analysis
- 11.2.3.4. Recent Developments
- 11.2.3.5. Financials (Based on Availability)
- 11.2.4 AIC India
- 11.2.4.1. Overview
- 11.2.4.2. Products
- 11.2.4.3. SWOT Analysis
- 11.2.4.4. Recent Developments
- 11.2.4.5. Financials (Based on Availability)
- 11.2.5 Rico Company
- 11.2.5.1. Overview
- 11.2.5.2. Products
- 11.2.5.3. SWOT Analysis
- 11.2.5.4. Recent Developments
- 11.2.5.5. Financials (Based on Availability)
- 11.2.1 Syngenta India
List of Figures
- Figure 1: Global Dry Chilies Industry Revenue Breakdown (Million, %) by Region 2025 & 2033
- Figure 2: North America Dry Chilies Industry Revenue (Million), by Production Analysis 2025 & 2033
- Figure 3: North America Dry Chilies Industry Revenue Share (%), by Production Analysis 2025 & 2033
- Figure 4: North America Dry Chilies Industry Revenue (Million), by Consumption Analysis 2025 & 2033
- Figure 5: North America Dry Chilies Industry Revenue Share (%), by Consumption Analysis 2025 & 2033
- Figure 6: North America Dry Chilies Industry Revenue (Million), by Import Market Analysis (Value & Volume) 2025 & 2033
- Figure 7: North America Dry Chilies Industry Revenue Share (%), by Import Market Analysis (Value & Volume) 2025 & 2033
- Figure 8: North America Dry Chilies Industry Revenue (Million), by Export Market Analysis (Value & Volume) 2025 & 2033
- Figure 9: North America Dry Chilies Industry Revenue Share (%), by Export Market Analysis (Value & Volume) 2025 & 2033
- Figure 10: North America Dry Chilies Industry Revenue (Million), by Price Trend Analysis 2025 & 2033
- Figure 11: North America Dry Chilies Industry Revenue Share (%), by Price Trend Analysis 2025 & 2033
- Figure 12: North America Dry Chilies Industry Revenue (Million), by Country 2025 & 2033
- Figure 13: North America Dry Chilies Industry Revenue Share (%), by Country 2025 & 2033
- Figure 14: Europe Dry Chilies Industry Revenue (Million), by Production Analysis 2025 & 2033
- Figure 15: Europe Dry Chilies Industry Revenue Share (%), by Production Analysis 2025 & 2033
- Figure 16: Europe Dry Chilies Industry Revenue (Million), by Consumption Analysis 2025 & 2033
- Figure 17: Europe Dry Chilies Industry Revenue Share (%), by Consumption Analysis 2025 & 2033
- Figure 18: Europe Dry Chilies Industry Revenue (Million), by Import Market Analysis (Value & Volume) 2025 & 2033
- Figure 19: Europe Dry Chilies Industry Revenue Share (%), by Import Market Analysis (Value & Volume) 2025 & 2033
- Figure 20: Europe Dry Chilies Industry Revenue (Million), by Export Market Analysis (Value & Volume) 2025 & 2033
- Figure 21: Europe Dry Chilies Industry Revenue Share (%), by Export Market Analysis (Value & Volume) 2025 & 2033
- Figure 22: Europe Dry Chilies Industry Revenue (Million), by Price Trend Analysis 2025 & 2033
- Figure 23: Europe Dry Chilies Industry Revenue Share (%), by Price Trend Analysis 2025 & 2033
- Figure 24: Europe Dry Chilies Industry Revenue (Million), by Country 2025 & 2033
- Figure 25: Europe Dry Chilies Industry Revenue Share (%), by Country 2025 & 2033
- Figure 26: Asia Pacific Dry Chilies Industry Revenue (Million), by Production Analysis 2025 & 2033
- Figure 27: Asia Pacific Dry Chilies Industry Revenue Share (%), by Production Analysis 2025 & 2033
- Figure 28: Asia Pacific Dry Chilies Industry Revenue (Million), by Consumption Analysis 2025 & 2033
- Figure 29: Asia Pacific Dry Chilies Industry Revenue Share (%), by Consumption Analysis 2025 & 2033
- Figure 30: Asia Pacific Dry Chilies Industry Revenue (Million), by Import Market Analysis (Value & Volume) 2025 & 2033
- Figure 31: Asia Pacific Dry Chilies Industry Revenue Share (%), by Import Market Analysis (Value & Volume) 2025 & 2033
- Figure 32: Asia Pacific Dry Chilies Industry Revenue (Million), by Export Market Analysis (Value & Volume) 2025 & 2033
- Figure 33: Asia Pacific Dry Chilies Industry Revenue Share (%), by Export Market Analysis (Value & Volume) 2025 & 2033
- Figure 34: Asia Pacific Dry Chilies Industry Revenue (Million), by Price Trend Analysis 2025 & 2033
- Figure 35: Asia Pacific Dry Chilies Industry Revenue Share (%), by Price Trend Analysis 2025 & 2033
- Figure 36: Asia Pacific Dry Chilies Industry Revenue (Million), by Country 2025 & 2033
- Figure 37: Asia Pacific Dry Chilies Industry Revenue Share (%), by Country 2025 & 2033
- Figure 38: South America Dry Chilies Industry Revenue (Million), by Production Analysis 2025 & 2033
- Figure 39: South America Dry Chilies Industry Revenue Share (%), by Production Analysis 2025 & 2033
- Figure 40: South America Dry Chilies Industry Revenue (Million), by Consumption Analysis 2025 & 2033
- Figure 41: South America Dry Chilies Industry Revenue Share (%), by Consumption Analysis 2025 & 2033
- Figure 42: South America Dry Chilies Industry Revenue (Million), by Import Market Analysis (Value & Volume) 2025 & 2033
- Figure 43: South America Dry Chilies Industry Revenue Share (%), by Import Market Analysis (Value & Volume) 2025 & 2033
- Figure 44: South America Dry Chilies Industry Revenue (Million), by Export Market Analysis (Value & Volume) 2025 & 2033
- Figure 45: South America Dry Chilies Industry Revenue Share (%), by Export Market Analysis (Value & Volume) 2025 & 2033
- Figure 46: South America Dry Chilies Industry Revenue (Million), by Price Trend Analysis 2025 & 2033
- Figure 47: South America Dry Chilies Industry Revenue Share (%), by Price Trend Analysis 2025 & 2033
- Figure 48: South America Dry Chilies Industry Revenue (Million), by Country 2025 & 2033
- Figure 49: South America Dry Chilies Industry Revenue Share (%), by Country 2025 & 2033
- Figure 50: Africa Dry Chilies Industry Revenue (Million), by Production Analysis 2025 & 2033
- Figure 51: Africa Dry Chilies Industry Revenue Share (%), by Production Analysis 2025 & 2033
- Figure 52: Africa Dry Chilies Industry Revenue (Million), by Consumption Analysis 2025 & 2033
- Figure 53: Africa Dry Chilies Industry Revenue Share (%), by Consumption Analysis 2025 & 2033
- Figure 54: Africa Dry Chilies Industry Revenue (Million), by Import Market Analysis (Value & Volume) 2025 & 2033
- Figure 55: Africa Dry Chilies Industry Revenue Share (%), by Import Market Analysis (Value & Volume) 2025 & 2033
- Figure 56: Africa Dry Chilies Industry Revenue (Million), by Export Market Analysis (Value & Volume) 2025 & 2033
- Figure 57: Africa Dry Chilies Industry Revenue Share (%), by Export Market Analysis (Value & Volume) 2025 & 2033
- Figure 58: Africa Dry Chilies Industry Revenue (Million), by Price Trend Analysis 2025 & 2033
- Figure 59: Africa Dry Chilies Industry Revenue Share (%), by Price Trend Analysis 2025 & 2033
- Figure 60: Africa Dry Chilies Industry Revenue (Million), by Country 2025 & 2033
- Figure 61: Africa Dry Chilies Industry Revenue Share (%), by Country 2025 & 2033
List of Tables
- Table 1: Global Dry Chilies Industry Revenue Million Forecast, by Production Analysis 2020 & 2033
- Table 2: Global Dry Chilies Industry Revenue Million Forecast, by Consumption Analysis 2020 & 2033
- Table 3: Global Dry Chilies Industry Revenue Million Forecast, by Import Market Analysis (Value & Volume) 2020 & 2033
- Table 4: Global Dry Chilies Industry Revenue Million Forecast, by Export Market Analysis (Value & Volume) 2020 & 2033
- Table 5: Global Dry Chilies Industry Revenue Million Forecast, by Price Trend Analysis 2020 & 2033
- Table 6: Global Dry Chilies Industry Revenue Million Forecast, by Region 2020 & 2033
- Table 7: Global Dry Chilies Industry Revenue Million Forecast, by Production Analysis 2020 & 2033
- Table 8: Global Dry Chilies Industry Revenue Million Forecast, by Consumption Analysis 2020 & 2033
- Table 9: Global Dry Chilies Industry Revenue Million Forecast, by Import Market Analysis (Value & Volume) 2020 & 2033
- Table 10: Global Dry Chilies Industry Revenue Million Forecast, by Export Market Analysis (Value & Volume) 2020 & 2033
- Table 11: Global Dry Chilies Industry Revenue Million Forecast, by Price Trend Analysis 2020 & 2033
- Table 12: Global Dry Chilies Industry Revenue Million Forecast, by Country 2020 & 2033
- Table 13: United States Dry Chilies Industry Revenue (Million) Forecast, by Application 2020 & 2033
- Table 14: Canada Dry Chilies Industry Revenue (Million) Forecast, by Application 2020 & 2033
- Table 15: Mexico Dry Chilies Industry Revenue (Million) Forecast, by Application 2020 & 2033
- Table 16: Global Dry Chilies Industry Revenue Million Forecast, by Production Analysis 2020 & 2033
- Table 17: Global Dry Chilies Industry Revenue Million Forecast, by Consumption Analysis 2020 & 2033
- Table 18: Global Dry Chilies Industry Revenue Million Forecast, by Import Market Analysis (Value & Volume) 2020 & 2033
- Table 19: Global Dry Chilies Industry Revenue Million Forecast, by Export Market Analysis (Value & Volume) 2020 & 2033
- Table 20: Global Dry Chilies Industry Revenue Million Forecast, by Price Trend Analysis 2020 & 2033
- Table 21: Global Dry Chilies Industry Revenue Million Forecast, by Country 2020 & 2033
- Table 22: United Kingdom Dry Chilies Industry Revenue (Million) Forecast, by Application 2020 & 2033
- Table 23: Germany Dry Chilies Industry Revenue (Million) Forecast, by Application 2020 & 2033
- Table 24: France Dry Chilies Industry Revenue (Million) Forecast, by Application 2020 & 2033
- Table 25: Spain Dry Chilies Industry Revenue (Million) Forecast, by Application 2020 & 2033
- Table 26: Global Dry Chilies Industry Revenue Million Forecast, by Production Analysis 2020 & 2033
- Table 27: Global Dry Chilies Industry Revenue Million Forecast, by Consumption Analysis 2020 & 2033
- Table 28: Global Dry Chilies Industry Revenue Million Forecast, by Import Market Analysis (Value & Volume) 2020 & 2033
- Table 29: Global Dry Chilies Industry Revenue Million Forecast, by Export Market Analysis (Value & Volume) 2020 & 2033
- Table 30: Global Dry Chilies Industry Revenue Million Forecast, by Price Trend Analysis 2020 & 2033
- Table 31: Global Dry Chilies Industry Revenue Million Forecast, by Country 2020 & 2033
- Table 32: China Dry Chilies Industry Revenue (Million) Forecast, by Application 2020 & 2033
- Table 33: Australia Dry Chilies Industry Revenue (Million) Forecast, by Application 2020 & 2033
- Table 34: India Dry Chilies Industry Revenue (Million) Forecast, by Application 2020 & 2033
- Table 35: Global Dry Chilies Industry Revenue Million Forecast, by Production Analysis 2020 & 2033
- Table 36: Global Dry Chilies Industry Revenue Million Forecast, by Consumption Analysis 2020 & 2033
- Table 37: Global Dry Chilies Industry Revenue Million Forecast, by Import Market Analysis (Value & Volume) 2020 & 2033
- Table 38: Global Dry Chilies Industry Revenue Million Forecast, by Export Market Analysis (Value & Volume) 2020 & 2033
- Table 39: Global Dry Chilies Industry Revenue Million Forecast, by Price Trend Analysis 2020 & 2033
- Table 40: Global Dry Chilies Industry Revenue Million Forecast, by Country 2020 & 2033
- Table 41: Brazil Dry Chilies Industry Revenue (Million) Forecast, by Application 2020 & 2033
- Table 42: Argentina Dry Chilies Industry Revenue (Million) Forecast, by Application 2020 & 2033
- Table 43: Global Dry Chilies Industry Revenue Million Forecast, by Production Analysis 2020 & 2033
- Table 44: Global Dry Chilies Industry Revenue Million Forecast, by Consumption Analysis 2020 & 2033
- Table 45: Global Dry Chilies Industry Revenue Million Forecast, by Import Market Analysis (Value & Volume) 2020 & 2033
- Table 46: Global Dry Chilies Industry Revenue Million Forecast, by Export Market Analysis (Value & Volume) 2020 & 2033
- Table 47: Global Dry Chilies Industry Revenue Million Forecast, by Price Trend Analysis 2020 & 2033
- Table 48: Global Dry Chilies Industry Revenue Million Forecast, by Country 2020 & 2033
- Table 49: South Africa Dry Chilies Industry Revenue (Million) Forecast, by Application 2020 & 2033
- Table 50: Egypt Dry Chilies Industry Revenue (Million) Forecast, by Application 2020 & 2033
Frequently Asked Questions
1. What is the projected Compound Annual Growth Rate (CAGR) of the Dry Chilies Industry?
The projected CAGR is approximately 6.11%.
2. Which companies are prominent players in the Dry Chilies Industry?
Key companies in the market include Syngenta India, Sunrise Foods, Laxmi Organic Industries, AIC India, Rico Company.
3. What are the main segments of the Dry Chilies Industry?
The market segments include Production Analysis, Consumption Analysis, Import Market Analysis (Value & Volume), Export Market Analysis (Value & Volume), Price Trend Analysis.
4. Can you provide details about the market size?
The market size is estimated to be USD 1.61 Million as of 2022.
5. What are some drivers contributing to market growth?
Increasing Berry Consumption for Health Benefits; Increasing Adoption of High-Technology Farm Practices; Growing Usage of Berries in the Food and Beverage Industries.
6. What are the notable trends driving market growth?
High Demand for the Exotic and Spicy Oriental Dishes.
7. Are there any restraints impacting market growth?
High Production Cost Involved in Berry Production; Increasing Disease and Pest Infestations.
8. Can you provide examples of recent developments in the market?
November 2022: The Indonesian government increased domestic production of chilies rather than importing them from abroad, and to do this, it implemented strategic policies for chili development using hybrid seeds, complete and balanced fertilization, better irrigation infrastructure and farming roads, increasing the capacity of farmers' resources, and expanding the goals and market segments.
9. What pricing options are available for accessing the report?
Pricing options include single-user, multi-user, and enterprise licenses priced at USD 4750, USD 5250, and USD 8750 respectively.
10. Is the market size provided in terms of value or volume?
The market size is provided in terms of value, measured in Million.
11. Are there any specific market keywords associated with the report?
Yes, the market keyword associated with the report is "Dry Chilies Industry," which aids in identifying and referencing the specific market segment covered.
12. How do I determine which pricing option suits my needs best?
The pricing options vary based on user requirements and access needs. Individual users may opt for single-user licenses, while businesses requiring broader access may choose multi-user or enterprise licenses for cost-effective access to the report.
13. Are there any additional resources or data provided in the Dry Chilies Industry report?
While the report offers comprehensive insights, it's advisable to review the specific contents or supplementary materials provided to ascertain if additional resources or data are available.
14. How can I stay updated on further developments or reports in the Dry Chilies Industry?
To stay informed about further developments, trends, and reports in the Dry Chilies Industry, consider subscribing to industry newsletters, following relevant companies and organizations, or regularly checking reputable industry news sources and publications.
Methodology
Step 1 - Identification of Relevant Samples Size from Population Database


Step 2 - Approaches for Defining Global Market Size (Value, Volume* & Price*)

Note*: In applicable scenarios
Step 3 - Data Sources
Primary Research
- Web Analytics
- Survey Reports
- Research Institute
- Latest Research Reports
- Opinion Leaders
Secondary Research
- Annual Reports
- White Paper
- Latest Press Release
- Industry Association
- Paid Database
- Investor Presentations

Step 4 - Data Triangulation
Involves using different sources of information in order to increase the validity of a study
These sources are likely to be stakeholders in a program - participants, other researchers, program staff, other community members, and so on.
Then we put all data in single framework & apply various statistical tools to find out the dynamic on the market.
During the analysis stage, feedback from the stakeholder groups would be compared to determine areas of agreement as well as areas of divergence