

Key Insights
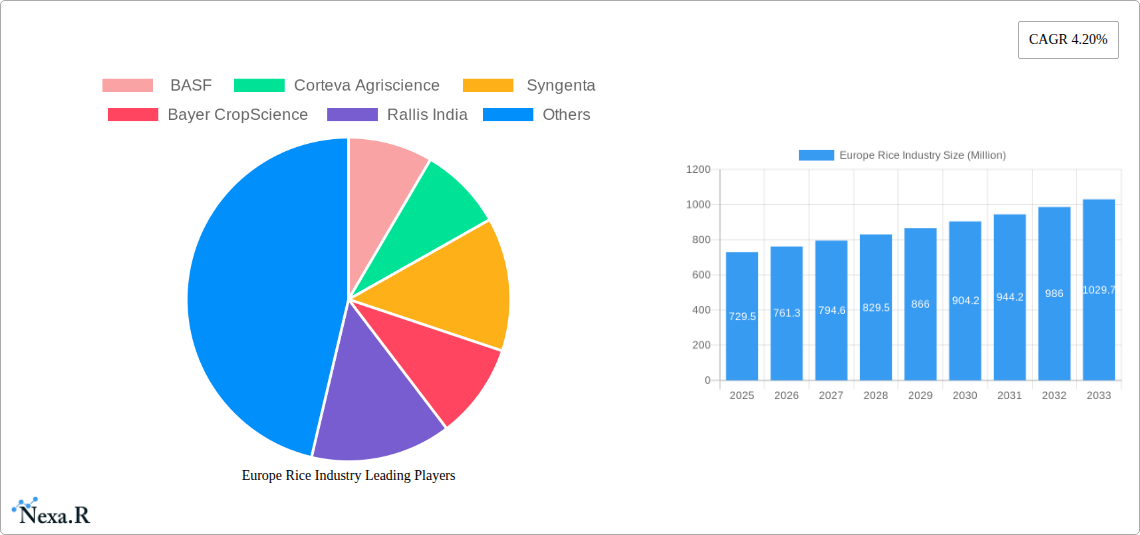
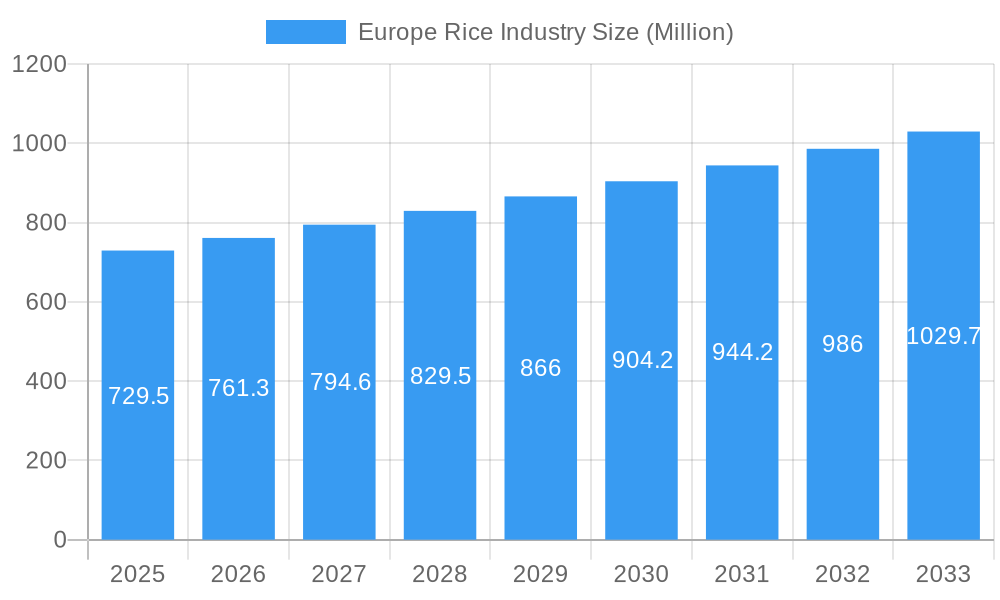
The European rice industry, valued at €729.5 million in 2025, is projected to experience steady growth, driven by increasing consumer demand for convenient and healthy food options, particularly in processed food and beverage applications. The market's Compound Annual Growth Rate (CAGR) of 4.2% from 2025 to 2033 indicates a consistent upward trajectory, fueled by factors such as rising disposable incomes, changing dietary habits, and the growing popularity of rice-based products across various demographics. Key segments like organic rice are witnessing significant expansion due to heightened health consciousness among consumers. While the conventional rice segment remains dominant, its growth is expected to be slightly slower compared to the organic counterpart. The food and beverage sector remains the primary application, with animal feed representing a smaller but still significant market segment. Major players like BASF, Corteva Agriscience, Syngenta, Bayer CropScience, and Rallis India are leveraging innovation in rice genetics and crop protection solutions to cater to evolving market needs and enhance yield. The presence of strong agricultural practices within the region also contributes positively to the industry’s overall performance.
Europe Rice Industry Market Size (In Million)
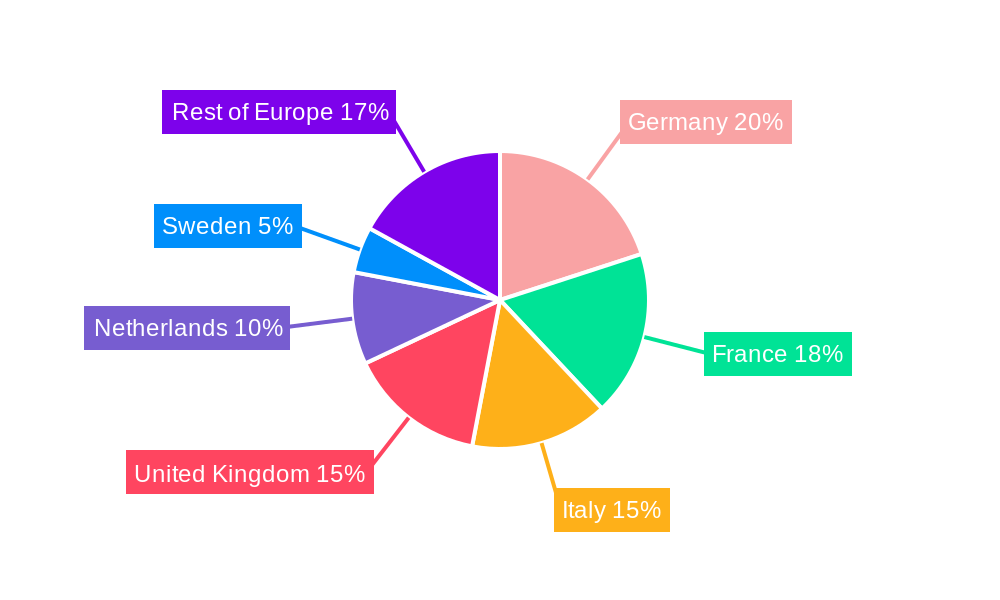
Growth within specific European nations will vary, with Germany, France, Italy, and the United Kingdom likely leading the market due to their larger populations and robust food processing industries. However, smaller nations like the Netherlands and Sweden, with significant focus on sustainable and organic agriculture, are poised for disproportionately higher growth rates within the organic rice segment. Challenges for the industry include potential price fluctuations in global rice markets, climate change impacting yields, and increasing competition from other grain alternatives. Nevertheless, the overall outlook remains positive, with the European rice industry expected to maintain a steady expansion over the forecast period, driven by both internal consumer demand and strategic market positioning by key industry players.
Europe Rice Industry Company Market Share
Europe Rice Industry Market Report: 2019-2033
This comprehensive report provides an in-depth analysis of the Europe rice industry, offering invaluable insights for industry professionals, investors, and stakeholders. Covering the period from 2019 to 2033, with a base year of 2025, this report meticulously examines market dynamics, growth trends, dominant segments, and key players shaping this dynamic sector. The report utilizes a combination of qualitative and quantitative data, projecting the market size in Million units.
Note: Where specific data is unavailable, estimations are provided.
Europe Rice Industry Market Dynamics & Structure
The European rice market is characterized by moderate concentration, with a few large players and numerous smaller regional producers. Technological innovation, primarily focused on improving yield, disease resistance, and processing efficiency, is a key driver. Stringent regulatory frameworks regarding food safety and environmental sustainability influence production practices. Competitive substitutes, such as pasta and other grains, exert pressure on market share. Consumer demographics, shifting towards healthier and more sustainably produced food, significantly impact demand. M&A activity in the sector has been moderate (xx deals in the past 5 years, representing xx Million units in market value), driven by the consolidation of supply chains and expansion into new markets.
- Market Concentration: Moderately concentrated, with top 5 players holding xx% market share (2024).
- Technological Innovation: Focus on improved crop yields, disease resistance, and processing efficiency. Key barriers include high R&D costs and regulatory approvals.
- Regulatory Framework: Strict food safety and environmental regulations impact production methods and costs.
- Competitive Substitutes: Pasta and other grains pose a significant competitive threat.
- End-User Demographics: Growing demand for healthier and sustainable rice varieties.
- M&A Trends: Moderate activity, driven by supply chain consolidation and market expansion.
Europe Rice Industry Growth Trends & Insights
The European rice market experienced steady growth during the historical period (2019-2024), with a CAGR of xx%. This growth is projected to continue during the forecast period (2025-2033), albeit at a slightly moderated pace, with a projected CAGR of xx%. Market penetration of organic and parboiled rice varieties is increasing, driven by rising consumer awareness of health and sustainability. Technological disruptions, particularly in precision agriculture and improved processing technologies, are enhancing efficiency and yield. Changing consumer preferences towards convenience and ready-to-eat rice products are reshaping the market landscape. The adoption rate of sustainable farming practices is gradually increasing, influenced by government policies and consumer demand.
Dominant Regions, Countries, or Segments in Europe Rice Industry
Italy and Spain are the leading countries in the European rice market, accounting for approximately xx% and xx% of total production respectively in 2024. Within the product type segment, conventional rice dominates the market, representing xx Million units (2024), followed by parboiled rice at xx Million units and organic rice at xx Million units. The food and beverage sector is the dominant application segment, accounting for xx% of total consumption in 2024, with animal feed comprising the remaining xx%. The growth in these segments is fueled by:
- Italy: Strong domestic demand, favorable climate, and established rice cultivation practices.
- Spain: Similar factors to Italy, plus significant exports to other European countries.
- Conventional Rice: Cost-effectiveness and wide availability.
- Food & Beverage: High consumer demand for rice-based foods.
- Animal Feed: Steady demand from the livestock industry.
Europe Rice Industry Product Landscape
The European rice market offers a diverse range of products, including conventional, parboiled, and organic rice. Innovations focus on improving nutritional content, enhancing taste and texture, and developing convenient ready-to-eat formats. Parboiled rice offers extended shelf life, while organic rice caters to the growing demand for sustainably produced food. Key performance indicators include yield per hectare, grain quality, and processing efficiency. Unique selling propositions often center on origin, sustainability certifications, and specific taste profiles. Technological advancements in rice milling and processing are improving efficiency and reducing waste.
Key Drivers, Barriers & Challenges in Europe Rice Industry
Key Drivers:
- Increasing consumer demand for healthy and convenient food options.
- Growing popularity of ethnic cuisines incorporating rice.
- Government support for sustainable agriculture practices.
Key Challenges:
- Climate change impacting rice yields and production stability. This is predicted to reduce yields by xx% by 2033.
- Fluctuations in global rice prices impacting profitability.
- Competition from other grain-based products.
- Supply chain disruptions leading to increased costs.
Emerging Opportunities in Europe Rice Industry
- Growing demand for functional foods enriched with rice.
- Expansion into niche markets such as gluten-free and vegan products.
- Development of innovative rice-based ingredients for food processing.
- Growing interest in sustainable and traceable rice production.
Growth Accelerators in the Europe Rice Industry
Technological advancements in seed genetics and farming techniques, coupled with strategic partnerships among producers, processors, and retailers, are set to accelerate market growth. Expanding into new markets and exploring innovative applications, such as rice-based bioplastics, are also poised to contribute to long-term growth.
Key Players Shaping the Europe Rice Industry Market
- BASF
- Corteva Agriscience
- Syngenta
- Bayer CropScience
- Rallis India
Notable Milestones in Europe Rice Industry Sector
- 2021: Introduction of a new high-yield rice variety by Syngenta.
- 2022: BASF launches a new herbicide effective against key rice weeds.
- 2023: Corteva announces a strategic partnership with a major European rice processor.
- 2024: Acquisition of a smaller rice producer by a leading Italian company.
In-Depth Europe Rice Industry Market Outlook
The future of the European rice market looks promising, driven by continued consumer demand, technological advancements, and a growing focus on sustainability. Strategic investments in research and development, coupled with targeted marketing efforts to highlight the health and nutritional benefits of rice, will be crucial for driving future growth. Expanding into emerging markets and developing innovative products are also vital strategies for capturing market share and achieving long-term success.
Europe Rice Industry Segmentation
- 1. Production Analysis
- 2. Consumption Analysis
- 3. Import Market Analysis (Value & Volume)
- 4. Export Market Analysis (Value & Volume)
- 5. Price Trend Analysis
Europe Rice Industry Segmentation By Geography
- 1. Belgium
- 2. United Kingdom
- 3. France
- 4. Italy
- 5. Germany
- 6. Spain
Europe Rice Industry Regional Market Share
Geographic Coverage of Europe Rice Industry
Europe Rice Industry REPORT HIGHLIGHTS
| Aspects | Details |
|---|---|
| Study Period | 2020-2034 |
| Base Year | 2025 |
| Estimated Year | 2026 |
| Forecast Period | 2026-2034 |
| Historical Period | 2020-2025 |
| Growth Rate | CAGR of 4.20% from 2020-2034 |
| Segmentation |
|
Table of Contents
- 1. Introduction
- 1.1. Research Scope
- 1.2. Market Segmentation
- 1.3. Research Methodology
- 1.4. Definitions and Assumptions
- 2. Executive Summary
- 2.1. Introduction
- 3. Market Dynamics
- 3.1. Introduction
- 3.2. Market Drivers
- 3.2.1. Rising Consumption of Cashew Nuts in the Country; Favorable Government Initiatives
- 3.3. Market Restrains
- 3.3.1. Hazardous Climatic Condition Hinders Cashew Production; Stringent Regulations Related to Food Quality Standards
- 3.4. Market Trends
- 3.4.1. Strong Demand in Northwestern Europe
- 4. Market Factor Analysis
- 4.1. Porters Five Forces
- 4.2. Supply/Value Chain
- 4.3. PESTEL analysis
- 4.4. Market Entropy
- 4.5. Patent/Trademark Analysis
- 5. Europe Rice Industry Analysis, Insights and Forecast, 2020-2032
- 5.1. Market Analysis, Insights and Forecast - by Production Analysis
- 5.2. Market Analysis, Insights and Forecast - by Consumption Analysis
- 5.3. Market Analysis, Insights and Forecast - by Import Market Analysis (Value & Volume)
- 5.4. Market Analysis, Insights and Forecast - by Export Market Analysis (Value & Volume)
- 5.5. Market Analysis, Insights and Forecast - by Price Trend Analysis
- 5.6. Market Analysis, Insights and Forecast - by Region
- 5.6.1. Belgium
- 5.6.2. United Kingdom
- 5.6.3. France
- 5.6.4. Italy
- 5.6.5. Germany
- 5.6.6. Spain
- 5.1. Market Analysis, Insights and Forecast - by Production Analysis
- 6. Belgium Europe Rice Industry Analysis, Insights and Forecast, 2020-2032
- 6.1. Market Analysis, Insights and Forecast - by Production Analysis
- 6.2. Market Analysis, Insights and Forecast - by Consumption Analysis
- 6.3. Market Analysis, Insights and Forecast - by Import Market Analysis (Value & Volume)
- 6.4. Market Analysis, Insights and Forecast - by Export Market Analysis (Value & Volume)
- 6.5. Market Analysis, Insights and Forecast - by Price Trend Analysis
- 6.1. Market Analysis, Insights and Forecast - by Production Analysis
- 7. United Kingdom Europe Rice Industry Analysis, Insights and Forecast, 2020-2032
- 7.1. Market Analysis, Insights and Forecast - by Production Analysis
- 7.2. Market Analysis, Insights and Forecast - by Consumption Analysis
- 7.3. Market Analysis, Insights and Forecast - by Import Market Analysis (Value & Volume)
- 7.4. Market Analysis, Insights and Forecast - by Export Market Analysis (Value & Volume)
- 7.5. Market Analysis, Insights and Forecast - by Price Trend Analysis
- 7.1. Market Analysis, Insights and Forecast - by Production Analysis
- 8. France Europe Rice Industry Analysis, Insights and Forecast, 2020-2032
- 8.1. Market Analysis, Insights and Forecast - by Production Analysis
- 8.2. Market Analysis, Insights and Forecast - by Consumption Analysis
- 8.3. Market Analysis, Insights and Forecast - by Import Market Analysis (Value & Volume)
- 8.4. Market Analysis, Insights and Forecast - by Export Market Analysis (Value & Volume)
- 8.5. Market Analysis, Insights and Forecast - by Price Trend Analysis
- 8.1. Market Analysis, Insights and Forecast - by Production Analysis
- 9. Italy Europe Rice Industry Analysis, Insights and Forecast, 2020-2032
- 9.1. Market Analysis, Insights and Forecast - by Production Analysis
- 9.2. Market Analysis, Insights and Forecast - by Consumption Analysis
- 9.3. Market Analysis, Insights and Forecast - by Import Market Analysis (Value & Volume)
- 9.4. Market Analysis, Insights and Forecast - by Export Market Analysis (Value & Volume)
- 9.5. Market Analysis, Insights and Forecast - by Price Trend Analysis
- 9.1. Market Analysis, Insights and Forecast - by Production Analysis
- 10. Germany Europe Rice Industry Analysis, Insights and Forecast, 2020-2032
- 10.1. Market Analysis, Insights and Forecast - by Production Analysis
- 10.2. Market Analysis, Insights and Forecast - by Consumption Analysis
- 10.3. Market Analysis, Insights and Forecast - by Import Market Analysis (Value & Volume)
- 10.4. Market Analysis, Insights and Forecast - by Export Market Analysis (Value & Volume)
- 10.5. Market Analysis, Insights and Forecast - by Price Trend Analysis
- 10.1. Market Analysis, Insights and Forecast - by Production Analysis
- 11. Spain Europe Rice Industry Analysis, Insights and Forecast, 2020-2032
- 11.1. Market Analysis, Insights and Forecast - by Production Analysis
- 11.2. Market Analysis, Insights and Forecast - by Consumption Analysis
- 11.3. Market Analysis, Insights and Forecast - by Import Market Analysis (Value & Volume)
- 11.4. Market Analysis, Insights and Forecast - by Export Market Analysis (Value & Volume)
- 11.5. Market Analysis, Insights and Forecast - by Price Trend Analysis
- 11.1. Market Analysis, Insights and Forecast - by Production Analysis
- 12. Competitive Analysis
- 12.1. Market Share Analysis 2025
- 12.2. Company Profiles
- 12.2.1 BASF
- 12.2.1.1. Overview
- 12.2.1.2. Products
- 12.2.1.3. SWOT Analysis
- 12.2.1.4. Recent Developments
- 12.2.1.5. Financials (Based on Availability)
- 12.2.2 Corteva Agriscience
- 12.2.2.1. Overview
- 12.2.2.2. Products
- 12.2.2.3. SWOT Analysis
- 12.2.2.4. Recent Developments
- 12.2.2.5. Financials (Based on Availability)
- 12.2.3 Syngenta
- 12.2.3.1. Overview
- 12.2.3.2. Products
- 12.2.3.3. SWOT Analysis
- 12.2.3.4. Recent Developments
- 12.2.3.5. Financials (Based on Availability)
- 12.2.4 Bayer CropScience
- 12.2.4.1. Overview
- 12.2.4.2. Products
- 12.2.4.3. SWOT Analysis
- 12.2.4.4. Recent Developments
- 12.2.4.5. Financials (Based on Availability)
- 12.2.5 Rallis India
- 12.2.5.1. Overview
- 12.2.5.2. Products
- 12.2.5.3. SWOT Analysis
- 12.2.5.4. Recent Developments
- 12.2.5.5. Financials (Based on Availability)
- 12.2.1 BASF
List of Figures
- Figure 1: Europe Rice Industry Revenue Breakdown (Million, %) by Product 2025 & 2033
- Figure 2: Europe Rice Industry Share (%) by Company 2025
List of Tables
- Table 1: Europe Rice Industry Revenue Million Forecast, by Production Analysis 2020 & 2033
- Table 2: Europe Rice Industry Volume Kiloton Forecast, by Production Analysis 2020 & 2033
- Table 3: Europe Rice Industry Revenue Million Forecast, by Consumption Analysis 2020 & 2033
- Table 4: Europe Rice Industry Volume Kiloton Forecast, by Consumption Analysis 2020 & 2033
- Table 5: Europe Rice Industry Revenue Million Forecast, by Import Market Analysis (Value & Volume) 2020 & 2033
- Table 6: Europe Rice Industry Volume Kiloton Forecast, by Import Market Analysis (Value & Volume) 2020 & 2033
- Table 7: Europe Rice Industry Revenue Million Forecast, by Export Market Analysis (Value & Volume) 2020 & 2033
- Table 8: Europe Rice Industry Volume Kiloton Forecast, by Export Market Analysis (Value & Volume) 2020 & 2033
- Table 9: Europe Rice Industry Revenue Million Forecast, by Price Trend Analysis 2020 & 2033
- Table 10: Europe Rice Industry Volume Kiloton Forecast, by Price Trend Analysis 2020 & 2033
- Table 11: Europe Rice Industry Revenue Million Forecast, by Region 2020 & 2033
- Table 12: Europe Rice Industry Volume Kiloton Forecast, by Region 2020 & 2033
- Table 13: Europe Rice Industry Revenue Million Forecast, by Production Analysis 2020 & 2033
- Table 14: Europe Rice Industry Volume Kiloton Forecast, by Production Analysis 2020 & 2033
- Table 15: Europe Rice Industry Revenue Million Forecast, by Consumption Analysis 2020 & 2033
- Table 16: Europe Rice Industry Volume Kiloton Forecast, by Consumption Analysis 2020 & 2033
- Table 17: Europe Rice Industry Revenue Million Forecast, by Import Market Analysis (Value & Volume) 2020 & 2033
- Table 18: Europe Rice Industry Volume Kiloton Forecast, by Import Market Analysis (Value & Volume) 2020 & 2033
- Table 19: Europe Rice Industry Revenue Million Forecast, by Export Market Analysis (Value & Volume) 2020 & 2033
- Table 20: Europe Rice Industry Volume Kiloton Forecast, by Export Market Analysis (Value & Volume) 2020 & 2033
- Table 21: Europe Rice Industry Revenue Million Forecast, by Price Trend Analysis 2020 & 2033
- Table 22: Europe Rice Industry Volume Kiloton Forecast, by Price Trend Analysis 2020 & 2033
- Table 23: Europe Rice Industry Revenue Million Forecast, by Country 2020 & 2033
- Table 24: Europe Rice Industry Volume Kiloton Forecast, by Country 2020 & 2033
- Table 25: Europe Rice Industry Revenue Million Forecast, by Production Analysis 2020 & 2033
- Table 26: Europe Rice Industry Volume Kiloton Forecast, by Production Analysis 2020 & 2033
- Table 27: Europe Rice Industry Revenue Million Forecast, by Consumption Analysis 2020 & 2033
- Table 28: Europe Rice Industry Volume Kiloton Forecast, by Consumption Analysis 2020 & 2033
- Table 29: Europe Rice Industry Revenue Million Forecast, by Import Market Analysis (Value & Volume) 2020 & 2033
- Table 30: Europe Rice Industry Volume Kiloton Forecast, by Import Market Analysis (Value & Volume) 2020 & 2033
- Table 31: Europe Rice Industry Revenue Million Forecast, by Export Market Analysis (Value & Volume) 2020 & 2033
- Table 32: Europe Rice Industry Volume Kiloton Forecast, by Export Market Analysis (Value & Volume) 2020 & 2033
- Table 33: Europe Rice Industry Revenue Million Forecast, by Price Trend Analysis 2020 & 2033
- Table 34: Europe Rice Industry Volume Kiloton Forecast, by Price Trend Analysis 2020 & 2033
- Table 35: Europe Rice Industry Revenue Million Forecast, by Country 2020 & 2033
- Table 36: Europe Rice Industry Volume Kiloton Forecast, by Country 2020 & 2033
- Table 37: Europe Rice Industry Revenue Million Forecast, by Production Analysis 2020 & 2033
- Table 38: Europe Rice Industry Volume Kiloton Forecast, by Production Analysis 2020 & 2033
- Table 39: Europe Rice Industry Revenue Million Forecast, by Consumption Analysis 2020 & 2033
- Table 40: Europe Rice Industry Volume Kiloton Forecast, by Consumption Analysis 2020 & 2033
- Table 41: Europe Rice Industry Revenue Million Forecast, by Import Market Analysis (Value & Volume) 2020 & 2033
- Table 42: Europe Rice Industry Volume Kiloton Forecast, by Import Market Analysis (Value & Volume) 2020 & 2033
- Table 43: Europe Rice Industry Revenue Million Forecast, by Export Market Analysis (Value & Volume) 2020 & 2033
- Table 44: Europe Rice Industry Volume Kiloton Forecast, by Export Market Analysis (Value & Volume) 2020 & 2033
- Table 45: Europe Rice Industry Revenue Million Forecast, by Price Trend Analysis 2020 & 2033
- Table 46: Europe Rice Industry Volume Kiloton Forecast, by Price Trend Analysis 2020 & 2033
- Table 47: Europe Rice Industry Revenue Million Forecast, by Country 2020 & 2033
- Table 48: Europe Rice Industry Volume Kiloton Forecast, by Country 2020 & 2033
- Table 49: Europe Rice Industry Revenue Million Forecast, by Production Analysis 2020 & 2033
- Table 50: Europe Rice Industry Volume Kiloton Forecast, by Production Analysis 2020 & 2033
- Table 51: Europe Rice Industry Revenue Million Forecast, by Consumption Analysis 2020 & 2033
- Table 52: Europe Rice Industry Volume Kiloton Forecast, by Consumption Analysis 2020 & 2033
- Table 53: Europe Rice Industry Revenue Million Forecast, by Import Market Analysis (Value & Volume) 2020 & 2033
- Table 54: Europe Rice Industry Volume Kiloton Forecast, by Import Market Analysis (Value & Volume) 2020 & 2033
- Table 55: Europe Rice Industry Revenue Million Forecast, by Export Market Analysis (Value & Volume) 2020 & 2033
- Table 56: Europe Rice Industry Volume Kiloton Forecast, by Export Market Analysis (Value & Volume) 2020 & 2033
- Table 57: Europe Rice Industry Revenue Million Forecast, by Price Trend Analysis 2020 & 2033
- Table 58: Europe Rice Industry Volume Kiloton Forecast, by Price Trend Analysis 2020 & 2033
- Table 59: Europe Rice Industry Revenue Million Forecast, by Country 2020 & 2033
- Table 60: Europe Rice Industry Volume Kiloton Forecast, by Country 2020 & 2033
- Table 61: Europe Rice Industry Revenue Million Forecast, by Production Analysis 2020 & 2033
- Table 62: Europe Rice Industry Volume Kiloton Forecast, by Production Analysis 2020 & 2033
- Table 63: Europe Rice Industry Revenue Million Forecast, by Consumption Analysis 2020 & 2033
- Table 64: Europe Rice Industry Volume Kiloton Forecast, by Consumption Analysis 2020 & 2033
- Table 65: Europe Rice Industry Revenue Million Forecast, by Import Market Analysis (Value & Volume) 2020 & 2033
- Table 66: Europe Rice Industry Volume Kiloton Forecast, by Import Market Analysis (Value & Volume) 2020 & 2033
- Table 67: Europe Rice Industry Revenue Million Forecast, by Export Market Analysis (Value & Volume) 2020 & 2033
- Table 68: Europe Rice Industry Volume Kiloton Forecast, by Export Market Analysis (Value & Volume) 2020 & 2033
- Table 69: Europe Rice Industry Revenue Million Forecast, by Price Trend Analysis 2020 & 2033
- Table 70: Europe Rice Industry Volume Kiloton Forecast, by Price Trend Analysis 2020 & 2033
- Table 71: Europe Rice Industry Revenue Million Forecast, by Country 2020 & 2033
- Table 72: Europe Rice Industry Volume Kiloton Forecast, by Country 2020 & 2033
- Table 73: Europe Rice Industry Revenue Million Forecast, by Production Analysis 2020 & 2033
- Table 74: Europe Rice Industry Volume Kiloton Forecast, by Production Analysis 2020 & 2033
- Table 75: Europe Rice Industry Revenue Million Forecast, by Consumption Analysis 2020 & 2033
- Table 76: Europe Rice Industry Volume Kiloton Forecast, by Consumption Analysis 2020 & 2033
- Table 77: Europe Rice Industry Revenue Million Forecast, by Import Market Analysis (Value & Volume) 2020 & 2033
- Table 78: Europe Rice Industry Volume Kiloton Forecast, by Import Market Analysis (Value & Volume) 2020 & 2033
- Table 79: Europe Rice Industry Revenue Million Forecast, by Export Market Analysis (Value & Volume) 2020 & 2033
- Table 80: Europe Rice Industry Volume Kiloton Forecast, by Export Market Analysis (Value & Volume) 2020 & 2033
- Table 81: Europe Rice Industry Revenue Million Forecast, by Price Trend Analysis 2020 & 2033
- Table 82: Europe Rice Industry Volume Kiloton Forecast, by Price Trend Analysis 2020 & 2033
- Table 83: Europe Rice Industry Revenue Million Forecast, by Country 2020 & 2033
- Table 84: Europe Rice Industry Volume Kiloton Forecast, by Country 2020 & 2033
Frequently Asked Questions
1. What is the projected Compound Annual Growth Rate (CAGR) of the Europe Rice Industry?
The projected CAGR is approximately 4.20%.
2. Which companies are prominent players in the Europe Rice Industry?
Key companies in the market include BASF , Corteva Agriscience , Syngenta, Bayer CropScience , Rallis India.
3. What are the main segments of the Europe Rice Industry?
The market segments include Production Analysis, Consumption Analysis, Import Market Analysis (Value & Volume), Export Market Analysis (Value & Volume), Price Trend Analysis.
4. Can you provide details about the market size?
The market size is estimated to be USD 729.50 Million as of 2022.
5. What are some drivers contributing to market growth?
Rising Consumption of Cashew Nuts in the Country; Favorable Government Initiatives.
6. What are the notable trends driving market growth?
Strong Demand in Northwestern Europe.
7. Are there any restraints impacting market growth?
Hazardous Climatic Condition Hinders Cashew Production; Stringent Regulations Related to Food Quality Standards.
8. Can you provide examples of recent developments in the market?
N/A
9. What pricing options are available for accessing the report?
Pricing options include single-user, multi-user, and enterprise licenses priced at USD 4750, USD 5250, and USD 8750 respectively.
10. Is the market size provided in terms of value or volume?
The market size is provided in terms of value, measured in Million and volume, measured in Kiloton.
11. Are there any specific market keywords associated with the report?
Yes, the market keyword associated with the report is "Europe Rice Industry," which aids in identifying and referencing the specific market segment covered.
12. How do I determine which pricing option suits my needs best?
The pricing options vary based on user requirements and access needs. Individual users may opt for single-user licenses, while businesses requiring broader access may choose multi-user or enterprise licenses for cost-effective access to the report.
13. Are there any additional resources or data provided in the Europe Rice Industry report?
While the report offers comprehensive insights, it's advisable to review the specific contents or supplementary materials provided to ascertain if additional resources or data are available.
14. How can I stay updated on further developments or reports in the Europe Rice Industry?
To stay informed about further developments, trends, and reports in the Europe Rice Industry, consider subscribing to industry newsletters, following relevant companies and organizations, or regularly checking reputable industry news sources and publications.
Methodology
Step 1 - Identification of Relevant Samples Size from Population Database


Step 2 - Approaches for Defining Global Market Size (Value, Volume* & Price*)

Note*: In applicable scenarios
Step 3 - Data Sources
Primary Research
- Web Analytics
- Survey Reports
- Research Institute
- Latest Research Reports
- Opinion Leaders
Secondary Research
- Annual Reports
- White Paper
- Latest Press Release
- Industry Association
- Paid Database
- Investor Presentations

Step 4 - Data Triangulation
Involves using different sources of information in order to increase the validity of a study
These sources are likely to be stakeholders in a program - participants, other researchers, program staff, other community members, and so on.
Then we put all data in single framework & apply various statistical tools to find out the dynamic on the market.
During the analysis stage, feedback from the stakeholder groups would be compared to determine areas of agreement as well as areas of divergence