

Key Insights
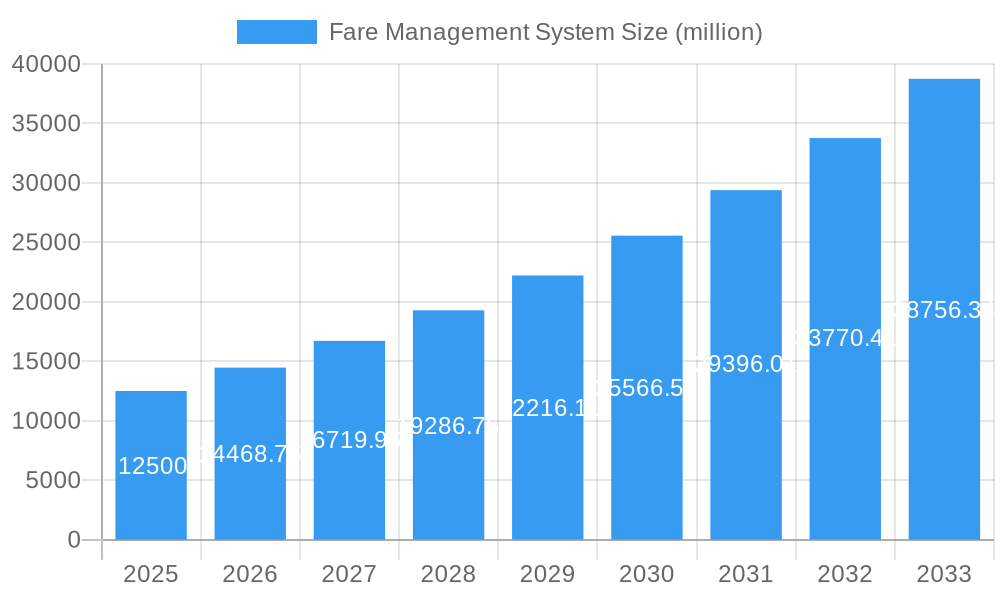
The global Fare Management System market is poised for substantial growth, projected to reach an estimated $12,500 million by 2025, with a remarkable Compound Annual Growth Rate (CAGR) of 15.5% over the forecast period of 2025-2033. This expansion is primarily fueled by the increasing demand for efficient and integrated public transportation systems, driven by urbanization and a growing emphasis on sustainable mobility solutions. Transport authorities worldwide are investing heavily in modern fare collection and management systems to streamline operations, reduce administrative overhead, and enhance the passenger experience. The shift towards cashless transactions and the proliferation of mobile ticketing solutions are further accelerating market adoption. Emerging economies, particularly in Asia Pacific, are witnessing rapid infrastructure development, creating a fertile ground for the deployment of advanced fare management technologies. The rising adoption of cloud-based solutions, offering scalability and flexibility, is also a significant driver, enabling transit agencies to adapt to evolving passenger needs and technological advancements with greater agility.
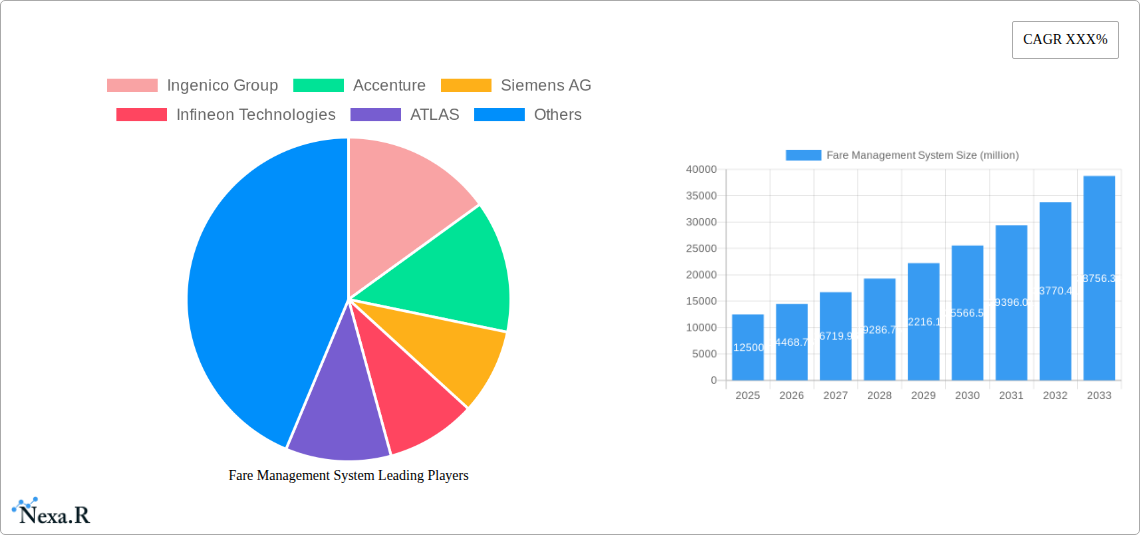
Fare Management System Market Size (In Billion)
Despite this robust growth trajectory, certain challenges exist. High initial implementation costs for sophisticated fare management systems can be a restraining factor for smaller transit operators or those in developing regions. Furthermore, ensuring interoperability between different systems and maintaining data security and privacy are critical concerns that need to be addressed to foster widespread adoption. The market is segmented by application into Transport Authorities, Travelers, and Others, with Transport Authorities being the dominant segment due to their direct involvement in system procurement and implementation. The Type segment is characterized by Cloud-based and On-premise solutions, with Cloud-based systems gaining significant traction due to their cost-effectiveness and ease of deployment. Key players in this dynamic market include Ingenico Group, Accenture, Siemens AG, Infineon Technologies, ATLAS, and others, all actively innovating to capture market share through advanced technological offerings and strategic partnerships.
Fare Management System Company Market Share
Fare Management System Market Dynamics & Structure
The global Fare Management System market exhibits a moderately concentrated structure, with key players like Ingenico Group, Accenture, Siemens AG, Infineon Technologies, ATLAS, AzRy, TransData.sk, Indra, TiXi, MJM Innovations, MC Payment, and Electronic Funds Source vying for significant market share. Technological innovation is a primary driver, with ongoing advancements in contactless payments, AI-powered route optimization, and integrated ticketing solutions shaping the competitive landscape. Regulatory frameworks, particularly those focused on data privacy and interoperability, play a crucial role in market development, influencing the adoption of standardized fare collection and processing mechanisms.
Competitive product substitutes, such as manual ticketing, cash-based transactions, and rudimentary transit card systems, are gradually being phased out by more sophisticated digital fare management solutions. End-user demographics are shifting towards tech-savvy travelers and urban commuters who demand seamless and integrated mobility experiences. Mergers and acquisitions (M&A) trends are evident as larger companies seek to consolidate market presence and acquire innovative technologies. The total M&A deal volume in the parent market for the historical period (2019-2024) is estimated at $5,200 million. We anticipate a CAGR of 12.8% for the overall market, reaching an estimated $XX,XXX million by 2033.
- Market Concentration: Moderately concentrated with key players investing heavily in R&D and strategic partnerships.
- Technological Innovation Drivers: AI, IoT, blockchain for enhanced security, and seamless integration of payment systems.
- Regulatory Frameworks: Data protection regulations (e.g., GDPR), interoperability standards, and government mandates for digital ticketing.
- Competitive Product Substitutes: Traditional ticketing methods, cash payments, and isolated payment solutions.
- End-User Demographics: Urban commuters, tech-savvy travelers, and smart city initiatives driving demand for integrated solutions.
- M&A Trends: Consolidation for market share, technology acquisition, and expansion into new geographical regions.
Fare Management System Growth Trends & Insights
The Fare Management System market is poised for substantial growth, driven by an increasing global focus on efficient public transportation and smart city initiatives. The market size is projected to expand significantly from its base year value of $XX,XXX million in 2025, demonstrating robust expansion throughout the forecast period of 2025–2033. Adoption rates for advanced fare management solutions are accelerating, fueled by the perceived benefits of reduced operational costs, improved passenger experience, and enhanced data analytics capabilities for transport authorities.
Technological disruptions, including the widespread implementation of contactless payment technologies, the integration of mobile ticketing, and the emergence of account-based ticketing systems, are fundamentally reshaping how fares are collected and managed. These innovations are not only streamlining the passenger journey but also providing transport operators with unprecedented insights into travel patterns and demand. Consumer behavior is demonstrably shifting towards a preference for convenience and digital-first solutions, making integrated fare management systems a necessity rather than a luxury.
The estimated CAGR for the forecast period is 12.8%. Market penetration is expected to rise from XX% in 2025 to XX% by 2033. The parent market for Fare Management Systems, encompassing broader mobility solutions, is expected to reach $XX,XXX million by 2033. The child market, specifically focusing on digital fare collection within public transit, is projected to reach $XX,XXX million by 2033, growing at an even faster CAGR of 14.2%. This segment's growth is directly linked to increased urbanization and the adoption of integrated public transport networks. The historical period (2019-2024) saw a market size of $XX,XXX million in 2019, growing at an approximate CAGR of 10.5%. The estimated year of 2025 reflects a projected market size of $XX,XXX million, setting the stage for the robust growth anticipated in the coming years.
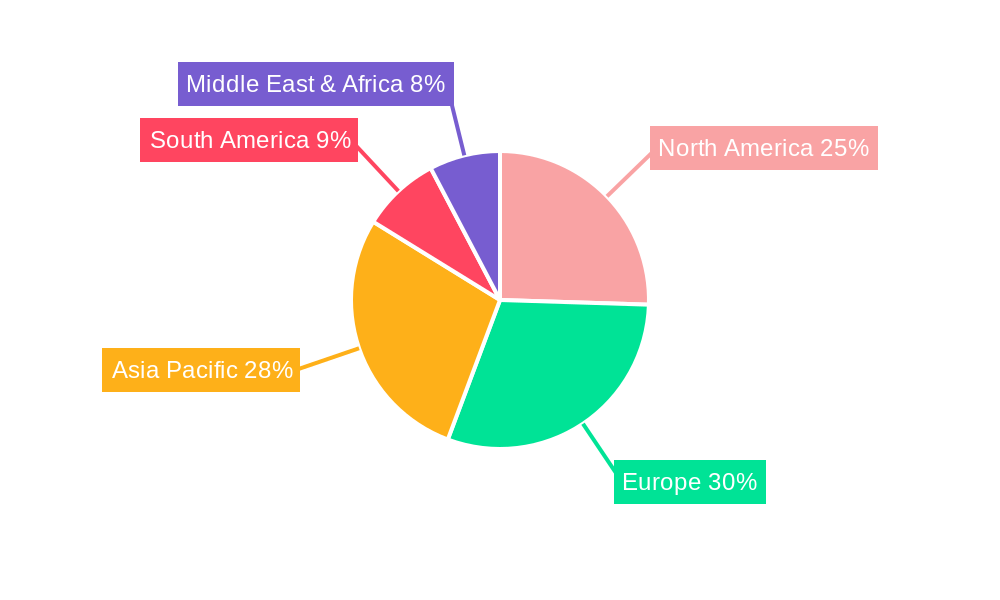
Dominant Regions, Countries, or Segments in Fare Management System
North America currently dominates the global Fare Management System market, driven by significant investments in smart city infrastructure, a high adoption rate of advanced technologies, and the presence of leading transport authorities and technology providers. Countries like the United States and Canada are at the forefront, actively deploying integrated ticketing systems, contactless payment solutions, and mobile-first fare collection mechanisms. The emphasis on improving urban mobility and reducing traffic congestion has led to substantial government and private sector investment in modernizing public transportation networks, making advanced fare management systems a critical component.
The Cloud-based segment within the Type category is experiencing remarkable growth and is projected to be a key driver of market expansion. This dominance is attributed to the scalability, flexibility, and cost-effectiveness offered by cloud solutions. Cloud-based systems enable real-time data synchronization, easier integration with other mobility services, and reduced upfront infrastructure costs for transport operators. The market share for cloud-based solutions is estimated to be XX% in 2025 and is projected to grow to XX% by 2033. Conversely, the On-premise segment, while still significant, is expected to see a gradual decline in its market share as organizations increasingly opt for the benefits of cloud deployment.
Within the Application segment, Transport Authorities are the largest and most influential segment. They are the primary procurers and implementers of fare management systems, driven by the need to optimize service delivery, manage revenue effectively, and provide enhanced passenger experiences. The market share held by Transport Authorities is approximately XX% in 2025. The Traveler segment, while not a direct buyer, significantly influences the demand for user-friendly and integrated fare solutions through their preferences and expectations. Other applications, including private transportation providers and micro-mobility services, are also contributing to market growth, albeit with a smaller market share. The overall market value for the parent region of North America is estimated to be $XX,XXX million in 2025, with a projected CAGR of 13.5% during the forecast period.
Fare Management System Product Landscape
The Fare Management System product landscape is characterized by a strong emphasis on innovation, delivering integrated solutions that enhance user experience and operational efficiency. Key product developments revolve around contactless payment technologies, such as EMV chip and PIN, near-field communication (NFC), and radio-frequency identification (RFID), enabling faster and more secure transactions. Advanced mobile ticketing applications allow passengers to purchase, store, and validate tickets directly from their smartphones. Account-based ticketing systems offer flexibility by linking fares to a user's account rather than a specific ticket medium. Performance metrics like transaction speed, system uptime, and data accuracy are critical differentiators. Unique selling propositions include real-time data analytics for route optimization and demand forecasting, seamless integration with multimodal transport options, and robust security features to protect user data and prevent fraud.
Key Drivers, Barriers & Challenges in Fare Management System
Key Drivers:
- Growing Urbanization: Increased demand for efficient and integrated public transportation systems.
- Technological Advancements: Proliferation of contactless payments, mobile ticketing, and AI-powered solutions.
- Government Initiatives: Smart city projects and mandates for digital public transport services.
- Enhanced Passenger Experience: Demand for seamless, convenient, and cashless travel.
- Operational Efficiency: Need for transport authorities to reduce costs and improve revenue collection.
Key Barriers & Challenges:
- High Implementation Costs: Significant initial investment required for hardware, software, and integration.
- Legacy System Integration: Difficulty in integrating new systems with existing outdated infrastructure.
- Data Security and Privacy Concerns: Ensuring compliance with stringent regulations and protecting sensitive passenger data.
- Interoperability Issues: Lack of standardized protocols across different transit systems and platforms.
- Cybersecurity Threats: Vulnerability to hacking and data breaches.
- User Adoption and Training: Overcoming resistance to new technologies and ensuring adequate training for both operators and passengers. The impact of cybersecurity threats could lead to potential revenue loss of XX% for affected operators.
Emerging Opportunities in Fare Management System
Emerging opportunities in the Fare Management System sector are abundant, driven by the increasing integration of mobility as a service (MaaS) platforms. The development of open-loop payment systems, allowing travelers to use their existing credit or debit cards for fare payments across various transport modes, presents a significant growth avenue. Furthermore, the application of blockchain technology for enhanced transaction security and transparent revenue sharing among different mobility providers is an area of significant potential. The expansion of fare management solutions into emerging economies, where urbanization is rapid and public transportation infrastructure is developing, offers substantial untapped market potential. The integration of real-time personalized travel information and dynamic pricing models based on demand is also a promising area for innovation and revenue generation.
Growth Accelerators in the Fare Management System Industry
Several catalysts are accelerating long-term growth in the Fare Management System industry. Technological breakthroughs, particularly in AI and machine learning for predictive analytics and demand forecasting, are enabling more efficient service planning and resource allocation. Strategic partnerships between technology providers, transport operators, and city governments are crucial for developing comprehensive and interoperable mobility solutions. Market expansion strategies, including geographical diversification into developing regions and vertical integration into broader MaaS ecosystems, are vital for sustained growth. The increasing focus on sustainability and reducing carbon footprints in urban transportation further bolsters the demand for efficient and digitized fare management systems that can encourage the use of public transit.
Key Players Shaping the Fare Management System Market
- Ingenico Group
- Accenture
- Siemens AG
- Infineon Technologies
- ATLAS
- AzRy
- TransData.sk
- Indra
- TiXi
- MJM Innovations
- MC Payment
- Electronic Funds Source
Notable Milestones in Fare Management System Sector
- 2019: Widespread adoption of contactless EMV payments in public transit systems across Europe and North America.
- 2020: Increased demand for mobile ticketing solutions driven by convenience and hygiene concerns during the pandemic.
- 2021: Pilot programs for account-based ticketing systems gain traction in major metropolitan areas.
- 2022: Introduction of integrated fare systems for multimodal transport, linking buses, trains, and ferries.
- 2023: Growing interest in MaaS platforms and their integration with fare management technologies.
- 2024: Advancements in AI for real-time fare adjustments and personalized journey planning.
- 2025 (Estimated): Continued expansion of cloud-based fare management solutions and increased focus on data analytics for operational optimization.
In-Depth Fare Management System Market Outlook
The Fare Management System market is set for an exceptionally robust future, driven by the relentless march of digitalization and the critical need for efficient urban mobility solutions. Growth accelerators, including the pervasive adoption of contactless payment technologies, the widespread implementation of mobile ticketing, and the strategic integration of fare systems within comprehensive Mobility-as-a-Service (MaaS) platforms, are paving the way for unprecedented market expansion. The continuous innovation in AI and IoT technologies will further empower transport authorities with predictive analytics for optimizing routes and managing demand, leading to substantial operational efficiencies. Strategic partnerships and the expansion into emerging markets will be pivotal in capturing new opportunities and consolidating market leadership. The projected market value for the parent market is estimated to reach $XX,XXX million by 2033, with a CAGR of 12.8%. The child market for digital fare collection within public transit is anticipated to grow even faster, reaching $XX,XXX million by 2033 at a CAGR of 14.2%, underscoring the immense future potential and strategic opportunities within this dynamic sector.
Fare Management System Segmentation
-
1. Application
- 1.1. Transport Authorities
- 1.2. Traveler
- 1.3. Others
-
2. Type
- 2.1. Cloud-based
- 2.2. On-premise
Fare Management System Segmentation By Geography
-
1. North America
- 1.1. United States
- 1.2. Canada
- 1.3. Mexico
-
2. South America
- 2.1. Brazil
- 2.2. Argentina
- 2.3. Rest of South America
-
3. Europe
- 3.1. United Kingdom
- 3.2. Germany
- 3.3. France
- 3.4. Italy
- 3.5. Spain
- 3.6. Russia
- 3.7. Benelux
- 3.8. Nordics
- 3.9. Rest of Europe
-
4. Middle East & Africa
- 4.1. Turkey
- 4.2. Israel
- 4.3. GCC
- 4.4. North Africa
- 4.5. South Africa
- 4.6. Rest of Middle East & Africa
-
5. Asia Pacific
- 5.1. China
- 5.2. India
- 5.3. Japan
- 5.4. South Korea
- 5.5. ASEAN
- 5.6. Oceania
- 5.7. Rest of Asia Pacific
Fare Management System Regional Market Share
Geographic Coverage of Fare Management System
Fare Management System REPORT HIGHLIGHTS
| Aspects | Details |
|---|---|
| Study Period | 2020-2034 |
| Base Year | 2025 |
| Estimated Year | 2026 |
| Forecast Period | 2026-2034 |
| Historical Period | 2020-2025 |
| Growth Rate | CAGR of 13.2% from 2020-2034 |
| Segmentation |
|
Table of Contents
- 1. Introduction
- 1.1. Research Scope
- 1.2. Market Segmentation
- 1.3. Research Methodology
- 1.4. Definitions and Assumptions
- 2. Executive Summary
- 2.1. Introduction
- 3. Market Dynamics
- 3.1. Introduction
- 3.2. Market Drivers
- 3.3. Market Restrains
- 3.4. Market Trends
- 4. Market Factor Analysis
- 4.1. Porters Five Forces
- 4.2. Supply/Value Chain
- 4.3. PESTEL analysis
- 4.4. Market Entropy
- 4.5. Patent/Trademark Analysis
- 5. Global Fare Management System Analysis, Insights and Forecast, 2020-2032
- 5.1. Market Analysis, Insights and Forecast - by Application
- 5.1.1. Transport Authorities
- 5.1.2. Traveler
- 5.1.3. Others
- 5.2. Market Analysis, Insights and Forecast - by Type
- 5.2.1. Cloud-based
- 5.2.2. On-premise
- 5.3. Market Analysis, Insights and Forecast - by Region
- 5.3.1. North America
- 5.3.2. South America
- 5.3.3. Europe
- 5.3.4. Middle East & Africa
- 5.3.5. Asia Pacific
- 5.1. Market Analysis, Insights and Forecast - by Application
- 6. North America Fare Management System Analysis, Insights and Forecast, 2020-2032
- 6.1. Market Analysis, Insights and Forecast - by Application
- 6.1.1. Transport Authorities
- 6.1.2. Traveler
- 6.1.3. Others
- 6.2. Market Analysis, Insights and Forecast - by Type
- 6.2.1. Cloud-based
- 6.2.2. On-premise
- 6.1. Market Analysis, Insights and Forecast - by Application
- 7. South America Fare Management System Analysis, Insights and Forecast, 2020-2032
- 7.1. Market Analysis, Insights and Forecast - by Application
- 7.1.1. Transport Authorities
- 7.1.2. Traveler
- 7.1.3. Others
- 7.2. Market Analysis, Insights and Forecast - by Type
- 7.2.1. Cloud-based
- 7.2.2. On-premise
- 7.1. Market Analysis, Insights and Forecast - by Application
- 8. Europe Fare Management System Analysis, Insights and Forecast, 2020-2032
- 8.1. Market Analysis, Insights and Forecast - by Application
- 8.1.1. Transport Authorities
- 8.1.2. Traveler
- 8.1.3. Others
- 8.2. Market Analysis, Insights and Forecast - by Type
- 8.2.1. Cloud-based
- 8.2.2. On-premise
- 8.1. Market Analysis, Insights and Forecast - by Application
- 9. Middle East & Africa Fare Management System Analysis, Insights and Forecast, 2020-2032
- 9.1. Market Analysis, Insights and Forecast - by Application
- 9.1.1. Transport Authorities
- 9.1.2. Traveler
- 9.1.3. Others
- 9.2. Market Analysis, Insights and Forecast - by Type
- 9.2.1. Cloud-based
- 9.2.2. On-premise
- 9.1. Market Analysis, Insights and Forecast - by Application
- 10. Asia Pacific Fare Management System Analysis, Insights and Forecast, 2020-2032
- 10.1. Market Analysis, Insights and Forecast - by Application
- 10.1.1. Transport Authorities
- 10.1.2. Traveler
- 10.1.3. Others
- 10.2. Market Analysis, Insights and Forecast - by Type
- 10.2.1. Cloud-based
- 10.2.2. On-premise
- 10.1. Market Analysis, Insights and Forecast - by Application
- 11. Competitive Analysis
- 11.1. Global Market Share Analysis 2025
- 11.2. Company Profiles
- 11.2.1 Ingenico Group
- 11.2.1.1. Overview
- 11.2.1.2. Products
- 11.2.1.3. SWOT Analysis
- 11.2.1.4. Recent Developments
- 11.2.1.5. Financials (Based on Availability)
- 11.2.2 Accenture
- 11.2.2.1. Overview
- 11.2.2.2. Products
- 11.2.2.3. SWOT Analysis
- 11.2.2.4. Recent Developments
- 11.2.2.5. Financials (Based on Availability)
- 11.2.3 Siemens AG
- 11.2.3.1. Overview
- 11.2.3.2. Products
- 11.2.3.3. SWOT Analysis
- 11.2.3.4. Recent Developments
- 11.2.3.5. Financials (Based on Availability)
- 11.2.4 Infineon Technologies
- 11.2.4.1. Overview
- 11.2.4.2. Products
- 11.2.4.3. SWOT Analysis
- 11.2.4.4. Recent Developments
- 11.2.4.5. Financials (Based on Availability)
- 11.2.5 ATLAS
- 11.2.5.1. Overview
- 11.2.5.2. Products
- 11.2.5.3. SWOT Analysis
- 11.2.5.4. Recent Developments
- 11.2.5.5. Financials (Based on Availability)
- 11.2.6 AzRy
- 11.2.6.1. Overview
- 11.2.6.2. Products
- 11.2.6.3. SWOT Analysis
- 11.2.6.4. Recent Developments
- 11.2.6.5. Financials (Based on Availability)
- 11.2.7 TransData.sk
- 11.2.7.1. Overview
- 11.2.7.2. Products
- 11.2.7.3. SWOT Analysis
- 11.2.7.4. Recent Developments
- 11.2.7.5. Financials (Based on Availability)
- 11.2.8 Indra
- 11.2.8.1. Overview
- 11.2.8.2. Products
- 11.2.8.3. SWOT Analysis
- 11.2.8.4. Recent Developments
- 11.2.8.5. Financials (Based on Availability)
- 11.2.9 TiXi
- 11.2.9.1. Overview
- 11.2.9.2. Products
- 11.2.9.3. SWOT Analysis
- 11.2.9.4. Recent Developments
- 11.2.9.5. Financials (Based on Availability)
- 11.2.10 MJM Innovations
- 11.2.10.1. Overview
- 11.2.10.2. Products
- 11.2.10.3. SWOT Analysis
- 11.2.10.4. Recent Developments
- 11.2.10.5. Financials (Based on Availability)
- 11.2.11 MC Payment
- 11.2.11.1. Overview
- 11.2.11.2. Products
- 11.2.11.3. SWOT Analysis
- 11.2.11.4. Recent Developments
- 11.2.11.5. Financials (Based on Availability)
- 11.2.12 Electronic Funds Source
- 11.2.12.1. Overview
- 11.2.12.2. Products
- 11.2.12.3. SWOT Analysis
- 11.2.12.4. Recent Developments
- 11.2.12.5. Financials (Based on Availability)
- 11.2.1 Ingenico Group
List of Figures
- Figure 1: Global Fare Management System Revenue Breakdown (undefined, %) by Region 2025 & 2033
- Figure 2: North America Fare Management System Revenue (undefined), by Application 2025 & 2033
- Figure 3: North America Fare Management System Revenue Share (%), by Application 2025 & 2033
- Figure 4: North America Fare Management System Revenue (undefined), by Type 2025 & 2033
- Figure 5: North America Fare Management System Revenue Share (%), by Type 2025 & 2033
- Figure 6: North America Fare Management System Revenue (undefined), by Country 2025 & 2033
- Figure 7: North America Fare Management System Revenue Share (%), by Country 2025 & 2033
- Figure 8: South America Fare Management System Revenue (undefined), by Application 2025 & 2033
- Figure 9: South America Fare Management System Revenue Share (%), by Application 2025 & 2033
- Figure 10: South America Fare Management System Revenue (undefined), by Type 2025 & 2033
- Figure 11: South America Fare Management System Revenue Share (%), by Type 2025 & 2033
- Figure 12: South America Fare Management System Revenue (undefined), by Country 2025 & 2033
- Figure 13: South America Fare Management System Revenue Share (%), by Country 2025 & 2033
- Figure 14: Europe Fare Management System Revenue (undefined), by Application 2025 & 2033
- Figure 15: Europe Fare Management System Revenue Share (%), by Application 2025 & 2033
- Figure 16: Europe Fare Management System Revenue (undefined), by Type 2025 & 2033
- Figure 17: Europe Fare Management System Revenue Share (%), by Type 2025 & 2033
- Figure 18: Europe Fare Management System Revenue (undefined), by Country 2025 & 2033
- Figure 19: Europe Fare Management System Revenue Share (%), by Country 2025 & 2033
- Figure 20: Middle East & Africa Fare Management System Revenue (undefined), by Application 2025 & 2033
- Figure 21: Middle East & Africa Fare Management System Revenue Share (%), by Application 2025 & 2033
- Figure 22: Middle East & Africa Fare Management System Revenue (undefined), by Type 2025 & 2033
- Figure 23: Middle East & Africa Fare Management System Revenue Share (%), by Type 2025 & 2033
- Figure 24: Middle East & Africa Fare Management System Revenue (undefined), by Country 2025 & 2033
- Figure 25: Middle East & Africa Fare Management System Revenue Share (%), by Country 2025 & 2033
- Figure 26: Asia Pacific Fare Management System Revenue (undefined), by Application 2025 & 2033
- Figure 27: Asia Pacific Fare Management System Revenue Share (%), by Application 2025 & 2033
- Figure 28: Asia Pacific Fare Management System Revenue (undefined), by Type 2025 & 2033
- Figure 29: Asia Pacific Fare Management System Revenue Share (%), by Type 2025 & 2033
- Figure 30: Asia Pacific Fare Management System Revenue (undefined), by Country 2025 & 2033
- Figure 31: Asia Pacific Fare Management System Revenue Share (%), by Country 2025 & 2033
List of Tables
- Table 1: Global Fare Management System Revenue undefined Forecast, by Application 2020 & 2033
- Table 2: Global Fare Management System Revenue undefined Forecast, by Type 2020 & 2033
- Table 3: Global Fare Management System Revenue undefined Forecast, by Region 2020 & 2033
- Table 4: Global Fare Management System Revenue undefined Forecast, by Application 2020 & 2033
- Table 5: Global Fare Management System Revenue undefined Forecast, by Type 2020 & 2033
- Table 6: Global Fare Management System Revenue undefined Forecast, by Country 2020 & 2033
- Table 7: United States Fare Management System Revenue (undefined) Forecast, by Application 2020 & 2033
- Table 8: Canada Fare Management System Revenue (undefined) Forecast, by Application 2020 & 2033
- Table 9: Mexico Fare Management System Revenue (undefined) Forecast, by Application 2020 & 2033
- Table 10: Global Fare Management System Revenue undefined Forecast, by Application 2020 & 2033
- Table 11: Global Fare Management System Revenue undefined Forecast, by Type 2020 & 2033
- Table 12: Global Fare Management System Revenue undefined Forecast, by Country 2020 & 2033
- Table 13: Brazil Fare Management System Revenue (undefined) Forecast, by Application 2020 & 2033
- Table 14: Argentina Fare Management System Revenue (undefined) Forecast, by Application 2020 & 2033
- Table 15: Rest of South America Fare Management System Revenue (undefined) Forecast, by Application 2020 & 2033
- Table 16: Global Fare Management System Revenue undefined Forecast, by Application 2020 & 2033
- Table 17: Global Fare Management System Revenue undefined Forecast, by Type 2020 & 2033
- Table 18: Global Fare Management System Revenue undefined Forecast, by Country 2020 & 2033
- Table 19: United Kingdom Fare Management System Revenue (undefined) Forecast, by Application 2020 & 2033
- Table 20: Germany Fare Management System Revenue (undefined) Forecast, by Application 2020 & 2033
- Table 21: France Fare Management System Revenue (undefined) Forecast, by Application 2020 & 2033
- Table 22: Italy Fare Management System Revenue (undefined) Forecast, by Application 2020 & 2033
- Table 23: Spain Fare Management System Revenue (undefined) Forecast, by Application 2020 & 2033
- Table 24: Russia Fare Management System Revenue (undefined) Forecast, by Application 2020 & 2033
- Table 25: Benelux Fare Management System Revenue (undefined) Forecast, by Application 2020 & 2033
- Table 26: Nordics Fare Management System Revenue (undefined) Forecast, by Application 2020 & 2033
- Table 27: Rest of Europe Fare Management System Revenue (undefined) Forecast, by Application 2020 & 2033
- Table 28: Global Fare Management System Revenue undefined Forecast, by Application 2020 & 2033
- Table 29: Global Fare Management System Revenue undefined Forecast, by Type 2020 & 2033
- Table 30: Global Fare Management System Revenue undefined Forecast, by Country 2020 & 2033
- Table 31: Turkey Fare Management System Revenue (undefined) Forecast, by Application 2020 & 2033
- Table 32: Israel Fare Management System Revenue (undefined) Forecast, by Application 2020 & 2033
- Table 33: GCC Fare Management System Revenue (undefined) Forecast, by Application 2020 & 2033
- Table 34: North Africa Fare Management System Revenue (undefined) Forecast, by Application 2020 & 2033
- Table 35: South Africa Fare Management System Revenue (undefined) Forecast, by Application 2020 & 2033
- Table 36: Rest of Middle East & Africa Fare Management System Revenue (undefined) Forecast, by Application 2020 & 2033
- Table 37: Global Fare Management System Revenue undefined Forecast, by Application 2020 & 2033
- Table 38: Global Fare Management System Revenue undefined Forecast, by Type 2020 & 2033
- Table 39: Global Fare Management System Revenue undefined Forecast, by Country 2020 & 2033
- Table 40: China Fare Management System Revenue (undefined) Forecast, by Application 2020 & 2033
- Table 41: India Fare Management System Revenue (undefined) Forecast, by Application 2020 & 2033
- Table 42: Japan Fare Management System Revenue (undefined) Forecast, by Application 2020 & 2033
- Table 43: South Korea Fare Management System Revenue (undefined) Forecast, by Application 2020 & 2033
- Table 44: ASEAN Fare Management System Revenue (undefined) Forecast, by Application 2020 & 2033
- Table 45: Oceania Fare Management System Revenue (undefined) Forecast, by Application 2020 & 2033
- Table 46: Rest of Asia Pacific Fare Management System Revenue (undefined) Forecast, by Application 2020 & 2033
Frequently Asked Questions
1. What is the projected Compound Annual Growth Rate (CAGR) of the Fare Management System?
The projected CAGR is approximately 13.2%.
2. Which companies are prominent players in the Fare Management System?
Key companies in the market include Ingenico Group, Accenture, Siemens AG, Infineon Technologies, ATLAS, AzRy, TransData.sk, Indra, TiXi, MJM Innovations, MC Payment, Electronic Funds Source.
3. What are the main segments of the Fare Management System?
The market segments include Application, Type.
4. Can you provide details about the market size?
The market size is estimated to be USD XXX N/A as of 2022.
5. What are some drivers contributing to market growth?
N/A
6. What are the notable trends driving market growth?
N/A
7. Are there any restraints impacting market growth?
N/A
8. Can you provide examples of recent developments in the market?
N/A
9. What pricing options are available for accessing the report?
Pricing options include single-user, multi-user, and enterprise licenses priced at USD 3950.00, USD 5925.00, and USD 7900.00 respectively.
10. Is the market size provided in terms of value or volume?
The market size is provided in terms of value, measured in N/A.
11. Are there any specific market keywords associated with the report?
Yes, the market keyword associated with the report is "Fare Management System," which aids in identifying and referencing the specific market segment covered.
12. How do I determine which pricing option suits my needs best?
The pricing options vary based on user requirements and access needs. Individual users may opt for single-user licenses, while businesses requiring broader access may choose multi-user or enterprise licenses for cost-effective access to the report.
13. Are there any additional resources or data provided in the Fare Management System report?
While the report offers comprehensive insights, it's advisable to review the specific contents or supplementary materials provided to ascertain if additional resources or data are available.
14. How can I stay updated on further developments or reports in the Fare Management System?
To stay informed about further developments, trends, and reports in the Fare Management System, consider subscribing to industry newsletters, following relevant companies and organizations, or regularly checking reputable industry news sources and publications.
Methodology
Step 1 - Identification of Relevant Samples Size from Population Database


Step 2 - Approaches for Defining Global Market Size (Value, Volume* & Price*)

Note*: In applicable scenarios
Step 3 - Data Sources
Primary Research
- Web Analytics
- Survey Reports
- Research Institute
- Latest Research Reports
- Opinion Leaders
Secondary Research
- Annual Reports
- White Paper
- Latest Press Release
- Industry Association
- Paid Database
- Investor Presentations

Step 4 - Data Triangulation
Involves using different sources of information in order to increase the validity of a study
These sources are likely to be stakeholders in a program - participants, other researchers, program staff, other community members, and so on.
Then we put all data in single framework & apply various statistical tools to find out the dynamic on the market.
During the analysis stage, feedback from the stakeholder groups would be compared to determine areas of agreement as well as areas of divergence