

Key Insights
The global Feedback Analytics Software market is poised for remarkable expansion, projected to reach an impressive $16.73 billion by 2025. This growth is fueled by an exceptional compound annual growth rate (CAGR) of 16.9%, indicating a dynamic and rapidly evolving landscape. Businesses across all sectors are increasingly recognizing the critical importance of understanding customer sentiment to drive product development, enhance customer experience, and foster loyalty. The proliferation of digital channels and the sheer volume of customer interactions necessitate sophisticated tools for extracting actionable insights from diverse feedback sources, including surveys, reviews, social media, and support tickets. This surge in demand is being driven by the imperative for organizations to become more customer-centric in their strategies.
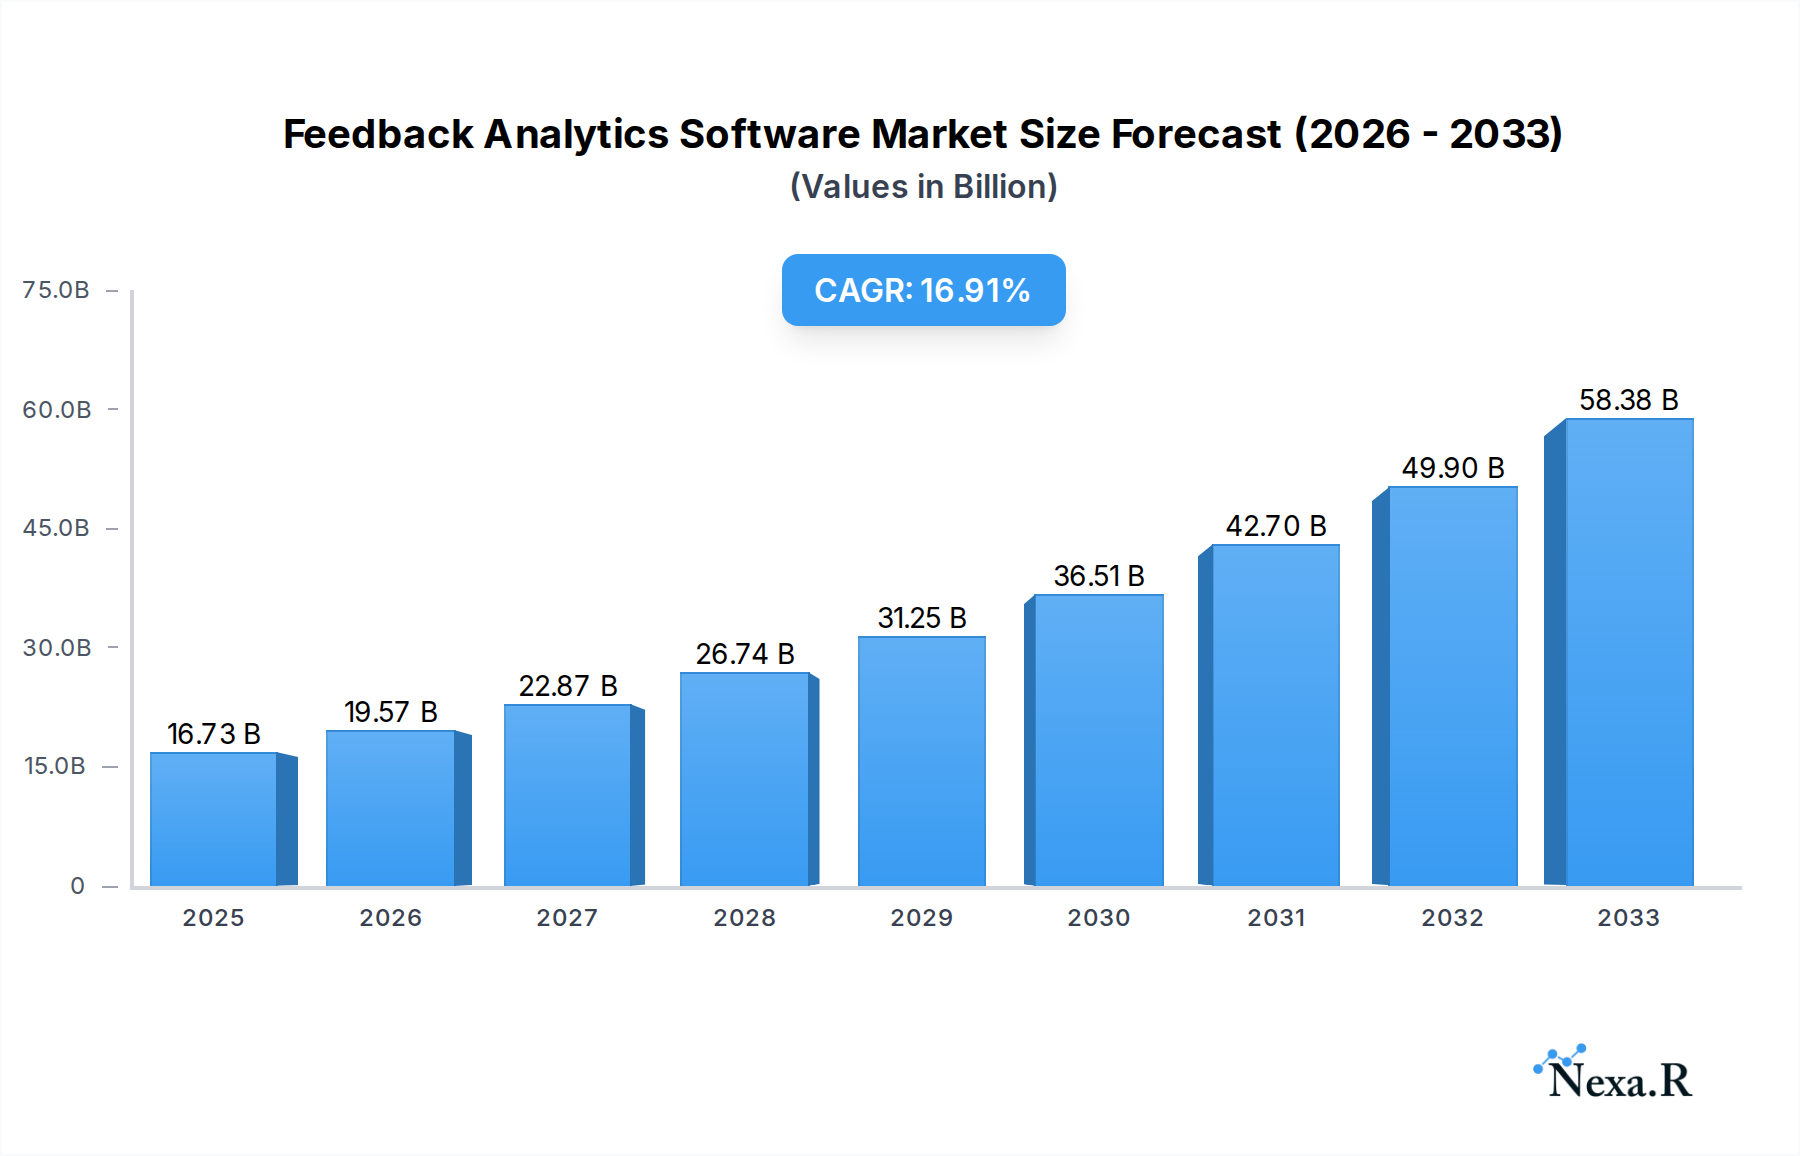
Feedback Analytics Software Market Size (In Billion)
The market is broadly segmented into solutions catering to Large Enterprises and Small and Medium-sized Enterprises (SMEs), with cloud-based offerings demonstrating a significant advantage in scalability and accessibility. While on-premises solutions still hold a niche, the trend strongly favors cloud deployments due to their cost-effectiveness and ease of integration. The competitive landscape is robust, featuring established players like Qualtrics, Birdeye, and Medallia, alongside innovative emerging companies such as Chattermill and Kapiche. These companies are continuously developing advanced features, including AI-powered sentiment analysis, predictive analytics, and natural language processing (NLP), to address the nuanced needs of businesses striving to gain a competitive edge through superior customer understanding.

Feedback Analytics Software Company Market Share
Report Description: Global Feedback Analytics Software Market Insights & Forecast 2019-2033
This comprehensive report provides an in-depth analysis of the global Feedback Analytics Software market, offering critical insights into its dynamics, growth trends, and future outlook. Covering the period from 2019 to 2033, with a base and estimated year of 2025, this report is an essential resource for industry professionals seeking to understand market evolution, competitive landscape, and emerging opportunities. The analysis delves into market concentration, technological innovation, regulatory frameworks, competitive product substitutes, end-user demographics, and M&A trends, providing actionable intelligence for strategic decision-making. The global market for feedback analytics software is projected to reach $18.50 billion by 2025, experiencing a robust Compound Annual Growth Rate (CAGR) of 15.75% during the forecast period of 2025-2033.
Feedback Analytics Software Market Dynamics & Structure
The global Feedback Analytics Software market is characterized by a dynamic and evolving landscape driven by increasing demand for customer-centric strategies and advanced data analysis capabilities. Market concentration is moderate, with several key players vying for dominance while also fostering a competitive environment that encourages innovation. Technological innovation is a primary driver, fueled by advancements in Natural Language Processing (NLP), Artificial Intelligence (AI), and Machine Learning (ML), enabling more sophisticated sentiment analysis, trend identification, and predictive insights from unstructured feedback data. Regulatory frameworks, particularly those related to data privacy and customer consent (e.g., GDPR, CCPA), are shaping market development by mandating secure data handling and transparent feedback collection processes.
- Market Concentration: Moderate, with a mix of large established vendors and agile startups.
- Technological Innovation Drivers: NLP, AI, ML for advanced sentiment, topic, and intent analysis.
- Regulatory Frameworks: Data privacy laws (GDPR, CCPA) influencing data security and consent management.
- Competitive Product Substitutes: Traditional survey tools, CRM systems with basic feedback modules, and in-house data analysis teams.
- End-User Demographics: Primarily businesses across various sectors, with a growing adoption among SMEs.
- M&A Trends: Increasing consolidation as larger players acquire innovative smaller companies to expand their feature sets and market reach. The M&A deal volume is projected to increase by 25% in the next two years.
Feedback Analytics Software Growth Trends & Insights
The global Feedback Analytics Software market is experiencing substantial growth, driven by the imperative for businesses to deeply understand and act upon customer feedback to enhance experiences and foster loyalty. The market size evolution is dramatic, with projections indicating a significant leap from $9.20 billion in 2023 to an estimated $18.50 billion by 2025, and further growth to $39.80 billion by 2033. Adoption rates are rapidly accelerating across industries, as organizations recognize feedback analytics not just as a tool for complaint resolution but as a strategic asset for product development, service improvement, and market differentiation. Technological disruptions, particularly the integration of AI and ML into feedback platforms, are transforming raw feedback data into actionable intelligence, enabling real-time insights and predictive analytics. Consumer behavior shifts towards demanding personalized experiences and immediate issue resolution are further fueling the demand for sophisticated feedback management solutions. The CAGR of 15.75% underscores the robust expansion and high potential of this sector.
The increasing complexity of customer journeys and the proliferation of feedback channels – from social media and reviews to direct surveys and support interactions – necessitate advanced analytical capabilities. Businesses are moving beyond simple sentiment analysis to uncover nuanced insights into customer intent, pain points, and desires. This deeper understanding allows for proactive problem-solving, optimized marketing campaigns, and the development of products and services that truly resonate with target audiences. The rise of the Experience Economy, where customer experience is a key differentiator, directly translates into higher investment in feedback analytics. Cloud-based solutions continue to dominate, offering scalability, flexibility, and cost-effectiveness, making them accessible to a broader range of businesses, including SMEs. On-premises solutions, while still present, are becoming less prevalent due to higher maintenance costs and slower adoption of updates. The parent market, encompassing broader customer experience management (CXM) solutions, is valued at $75.30 billion in 2025, with feedback analytics representing a substantial and rapidly growing segment within it. The child market, focusing on niche applications like employee feedback analytics, is also showing promising growth, expected to reach $3.20 billion by 2025. Market penetration of dedicated feedback analytics tools is projected to reach 65% of businesses by 2028.
Dominant Regions, Countries, or Segments in Feedback Analytics Software
North America currently leads the global Feedback Analytics Software market, driven by its early adoption of advanced technologies, a strong presence of major enterprise clients, and a robust ecosystem of software vendors. The United States, in particular, accounts for a significant portion of the market share due to its large economy, high concentration of businesses across all sectors, and a deeply ingrained culture of customer-centricity. Economic policies that support technological innovation and digital transformation, coupled with extensive digital infrastructure, further bolster its dominance. The country's mature market for cloud-based services and AI-powered solutions makes it a fertile ground for feedback analytics adoption.
- Application: Large Enterprises represent the largest segment in terms of market share and revenue, valued at $10.20 billion in 2025.
- Drivers: Need for sophisticated, scalable solutions to manage vast amounts of customer data, integration with existing CRM and ERP systems, and a focus on competitive advantage through superior customer experience.
- Dominance Factors: High spending capacity, complex feedback requirements, and a strategic imperative to leverage customer insights for business growth.
- Type: Cloud Based dominates the market, holding an estimated 82% market share in 2025.
- Drivers: Scalability, cost-effectiveness, ease of deployment, automatic updates, and accessibility from anywhere.
- Dominance Factors: Alignment with modern IT infrastructure preferences and the ability to serve a diverse range of business sizes and geographical locations.
Europe, with its mature economies and increasing emphasis on data privacy regulations like GDPR, is another significant region showing strong growth. Asia Pacific is emerging as a high-growth region, fueled by rapid digital transformation, a burgeoning middle class, and increasing awareness of the importance of customer feedback, particularly in countries like China, India, and Southeast Asian nations. The Middle East and Africa are also showing promising growth potential as businesses in these regions increasingly invest in digital tools to enhance customer engagement. Within the application segment, SMEs are demonstrating the fastest growth rate, projected at a CAGR of 17.10%, as more affordable and user-friendly feedback analytics solutions become available, empowering smaller businesses to compete on customer experience.
Feedback Analytics Software Product Landscape
The product landscape of feedback analytics software is characterized by continuous innovation, with platforms increasingly offering advanced AI and ML capabilities for deeper insights. Solutions now go beyond basic sentiment analysis to encompass sophisticated topic modeling, intent recognition, and predictive analytics, enabling businesses to anticipate customer needs and potential issues. Unique selling propositions often lie in the breadth of data sources that can be integrated – from surveys and social media to call center transcripts and app reviews – and the depth of customizable reporting and visualization tools. Technological advancements are focusing on real-time processing, automated action triggering, and seamless integration with other business systems, making feedback analytics a proactive and integral part of operational workflows.
Key Drivers, Barriers & Challenges in Feedback Analytics Software
Key Drivers:
- Increasing Customer-Centricity: Businesses across all sectors are prioritizing customer experience as a key differentiator.
- Advancements in AI & ML: Sophisticated algorithms enhance the accuracy and depth of feedback analysis.
- Proliferation of Data Sources: The growing volume and variety of customer feedback channels necessitate advanced analytical tools.
- Need for Real-Time Insights: Businesses require immediate understanding of customer sentiment to respond swiftly.
- Growth of Cloud Computing: Enables scalable, accessible, and cost-effective feedback analytics solutions.
Key Barriers & Challenges:
- Data Silos and Integration Issues: Difficulty in consolidating feedback from disparate systems can hinder comprehensive analysis, impacting 15% of potential insights.
- Lack of Skilled Personnel: Shortage of data scientists and analysts capable of fully leveraging advanced feedback analytics tools.
- Privacy and Security Concerns: Ensuring compliance with data protection regulations and safeguarding sensitive customer information remains a significant hurdle.
- Cost of Implementation: Initial investment and ongoing subscription fees can be a barrier for some SMEs, with setup costs averaging $5,000 for basic implementations.
- Overcoming Resistance to Change: Integrating new feedback analytics processes into existing organizational workflows can face internal resistance.
- Market Saturation and Differentiation: Intense competition requires vendors to continuously innovate to stand out.
Emerging Opportunities in Feedback Analytics Software
Emerging opportunities in the Feedback Analytics Software market lie in the expansion of AI-driven predictive analytics to anticipate customer churn and identify upselling opportunities with 20% greater accuracy. There's a significant untapped market in niche industries like healthcare, education, and non-profits, which are beginning to recognize the value of structured feedback. The integration of feedback analytics with emerging technologies like the metaverse and virtual reality offers novel ways to capture and analyze user experiences. Furthermore, the growing demand for personalized customer journeys is creating opportunities for feedback platforms that can dynamically adapt content and interactions based on real-time sentiment analysis.
Growth Accelerators in the Feedback Analytics Software Industry
Several catalysts are accelerating growth in the Feedback Analytics Software industry. The relentless drive towards digital transformation across all business functions is a primary accelerator, as companies seek to leverage data for competitive advantage. Strategic partnerships between feedback analytics providers and complementary technology firms (e.g., CRM, marketing automation) are expanding reach and offering more integrated solutions. Market expansion strategies, particularly into emerging economies, are opening up new customer bases. Furthermore, the continuous refinement and accessibility of AI and ML technologies are making sophisticated analytical capabilities available to a wider market, lowering the barrier to entry and driving broader adoption.
Key Players Shaping the Feedback Analytics Software Market
- Qualtrics
- Birdeye
- Wootric
- Medallia
- Clarabridge
- Warwick Analytics Services
- Stratifyd
- Confirmit
- Keatext
- Thematic Analysis
- Prodsight
- Cauliflower
- Chattermill
- Adoreboard
- Feedis
- Feelingstream
- Hoick
- Idiomatic
- Kapiche
- Mopinion
- Resonate Solutions
- Review Trackers
- AskSenti
- unitQ
Notable Milestones in Feedback Analytics Software Sector
- 2019: Increased adoption of AI for sentiment analysis, moving beyond basic keyword matching.
- 2020: Rise of remote work accelerated the demand for cloud-based feedback solutions.
- 2021: Major investment rounds in AI-driven customer feedback platforms, signaling strong investor confidence.
- 2022: Integration of feedback analytics with conversational AI and chatbots for real-time customer interaction analysis.
- 2023: Enhanced focus on actionable insights and automated response mechanisms within feedback platforms.
- 2024: Growing emphasis on privacy-preserving analytics and ethical AI in feedback processing.
In-Depth Feedback Analytics Software Market Outlook
The future outlook for the Feedback Analytics Software market is exceptionally bright, poised for sustained and significant growth. Accelerators such as the deepening integration of AI for predictive insights, the expansion into underserved markets, and the continuous evolution of customer expectations will drive this expansion. Strategic partnerships and the development of more specialized, industry-specific solutions will further fuel adoption. The market is expected to become increasingly consolidated, with leading players offering comprehensive CX platforms that deeply embed feedback analytics. Businesses that effectively leverage these advanced tools will gain a substantial competitive edge in understanding and delighting their customers.
Feedback Analytics Software Segmentation
-
1. Application
- 1.1. Large Enterprises
- 1.2. SMEs
-
2. Type
- 2.1. Cloud Based
- 2.2. On Premises
Feedback Analytics Software Segmentation By Geography
-
1. North America
- 1.1. United States
- 1.2. Canada
- 1.3. Mexico
-
2. South America
- 2.1. Brazil
- 2.2. Argentina
- 2.3. Rest of South America
-
3. Europe
- 3.1. United Kingdom
- 3.2. Germany
- 3.3. France
- 3.4. Italy
- 3.5. Spain
- 3.6. Russia
- 3.7. Benelux
- 3.8. Nordics
- 3.9. Rest of Europe
-
4. Middle East & Africa
- 4.1. Turkey
- 4.2. Israel
- 4.3. GCC
- 4.4. North Africa
- 4.5. South Africa
- 4.6. Rest of Middle East & Africa
-
5. Asia Pacific
- 5.1. China
- 5.2. India
- 5.3. Japan
- 5.4. South Korea
- 5.5. ASEAN
- 5.6. Oceania
- 5.7. Rest of Asia Pacific
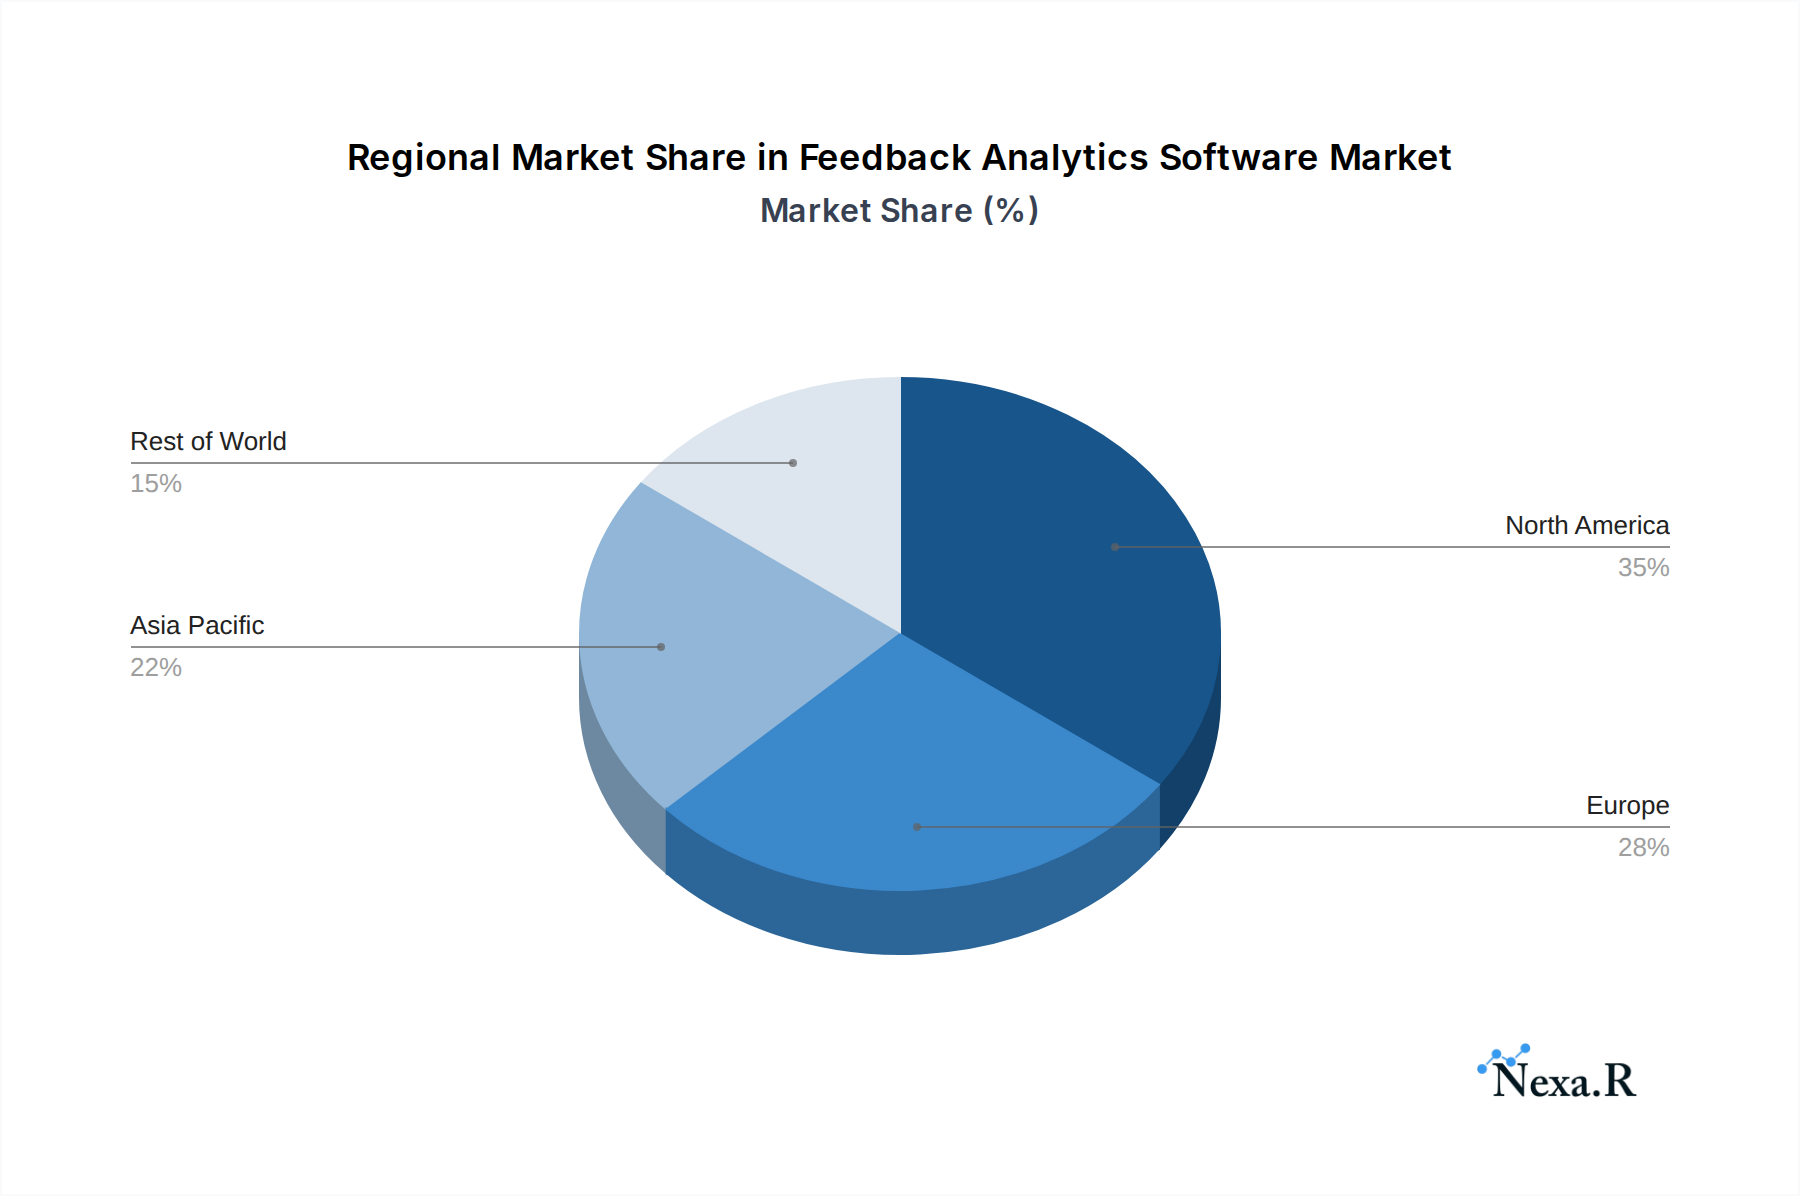
Feedback Analytics Software Regional Market Share
Geographic Coverage of Feedback Analytics Software
Feedback Analytics Software REPORT HIGHLIGHTS
| Aspects | Details |
|---|---|
| Study Period | 2020-2034 |
| Base Year | 2025 |
| Estimated Year | 2026 |
| Forecast Period | 2026-2034 |
| Historical Period | 2020-2025 |
| Growth Rate | CAGR of 16.9% from 2020-2034 |
| Segmentation |
|
Table of Contents
- 1. Introduction
- 1.1. Research Scope
- 1.2. Market Segmentation
- 1.3. Research Methodology
- 1.4. Definitions and Assumptions
- 2. Executive Summary
- 2.1. Introduction
- 3. Market Dynamics
- 3.1. Introduction
- 3.2. Market Drivers
- 3.3. Market Restrains
- 3.4. Market Trends
- 4. Market Factor Analysis
- 4.1. Porters Five Forces
- 4.2. Supply/Value Chain
- 4.3. PESTEL analysis
- 4.4. Market Entropy
- 4.5. Patent/Trademark Analysis
- 5. Global Feedback Analytics Software Analysis, Insights and Forecast, 2020-2032
- 5.1. Market Analysis, Insights and Forecast - by Application
- 5.1.1. Large Enterprises
- 5.1.2. SMEs
- 5.2. Market Analysis, Insights and Forecast - by Type
- 5.2.1. Cloud Based
- 5.2.2. On Premises
- 5.3. Market Analysis, Insights and Forecast - by Region
- 5.3.1. North America
- 5.3.2. South America
- 5.3.3. Europe
- 5.3.4. Middle East & Africa
- 5.3.5. Asia Pacific
- 5.1. Market Analysis, Insights and Forecast - by Application
- 6. North America Feedback Analytics Software Analysis, Insights and Forecast, 2020-2032
- 6.1. Market Analysis, Insights and Forecast - by Application
- 6.1.1. Large Enterprises
- 6.1.2. SMEs
- 6.2. Market Analysis, Insights and Forecast - by Type
- 6.2.1. Cloud Based
- 6.2.2. On Premises
- 6.1. Market Analysis, Insights and Forecast - by Application
- 7. South America Feedback Analytics Software Analysis, Insights and Forecast, 2020-2032
- 7.1. Market Analysis, Insights and Forecast - by Application
- 7.1.1. Large Enterprises
- 7.1.2. SMEs
- 7.2. Market Analysis, Insights and Forecast - by Type
- 7.2.1. Cloud Based
- 7.2.2. On Premises
- 7.1. Market Analysis, Insights and Forecast - by Application
- 8. Europe Feedback Analytics Software Analysis, Insights and Forecast, 2020-2032
- 8.1. Market Analysis, Insights and Forecast - by Application
- 8.1.1. Large Enterprises
- 8.1.2. SMEs
- 8.2. Market Analysis, Insights and Forecast - by Type
- 8.2.1. Cloud Based
- 8.2.2. On Premises
- 8.1. Market Analysis, Insights and Forecast - by Application
- 9. Middle East & Africa Feedback Analytics Software Analysis, Insights and Forecast, 2020-2032
- 9.1. Market Analysis, Insights and Forecast - by Application
- 9.1.1. Large Enterprises
- 9.1.2. SMEs
- 9.2. Market Analysis, Insights and Forecast - by Type
- 9.2.1. Cloud Based
- 9.2.2. On Premises
- 9.1. Market Analysis, Insights and Forecast - by Application
- 10. Asia Pacific Feedback Analytics Software Analysis, Insights and Forecast, 2020-2032
- 10.1. Market Analysis, Insights and Forecast - by Application
- 10.1.1. Large Enterprises
- 10.1.2. SMEs
- 10.2. Market Analysis, Insights and Forecast - by Type
- 10.2.1. Cloud Based
- 10.2.2. On Premises
- 10.1. Market Analysis, Insights and Forecast - by Application
- 11. Competitive Analysis
- 11.1. Global Market Share Analysis 2025
- 11.2. Company Profiles
- 11.2.1 Qualtrics
- 11.2.1.1. Overview
- 11.2.1.2. Products
- 11.2.1.3. SWOT Analysis
- 11.2.1.4. Recent Developments
- 11.2.1.5. Financials (Based on Availability)
- 11.2.2 Birdeye
- 11.2.2.1. Overview
- 11.2.2.2. Products
- 11.2.2.3. SWOT Analysis
- 11.2.2.4. Recent Developments
- 11.2.2.5. Financials (Based on Availability)
- 11.2.3 Wootric
- 11.2.3.1. Overview
- 11.2.3.2. Products
- 11.2.3.3. SWOT Analysis
- 11.2.3.4. Recent Developments
- 11.2.3.5. Financials (Based on Availability)
- 11.2.4 Medallia
- 11.2.4.1. Overview
- 11.2.4.2. Products
- 11.2.4.3. SWOT Analysis
- 11.2.4.4. Recent Developments
- 11.2.4.5. Financials (Based on Availability)
- 11.2.5 Clarabridge
- 11.2.5.1. Overview
- 11.2.5.2. Products
- 11.2.5.3. SWOT Analysis
- 11.2.5.4. Recent Developments
- 11.2.5.5. Financials (Based on Availability)
- 11.2.6 Warwick Analytics Services
- 11.2.6.1. Overview
- 11.2.6.2. Products
- 11.2.6.3. SWOT Analysis
- 11.2.6.4. Recent Developments
- 11.2.6.5. Financials (Based on Availability)
- 11.2.7 Stratifyd
- 11.2.7.1. Overview
- 11.2.7.2. Products
- 11.2.7.3. SWOT Analysis
- 11.2.7.4. Recent Developments
- 11.2.7.5. Financials (Based on Availability)
- 11.2.8 Confirmit
- 11.2.8.1. Overview
- 11.2.8.2. Products
- 11.2.8.3. SWOT Analysis
- 11.2.8.4. Recent Developments
- 11.2.8.5. Financials (Based on Availability)
- 11.2.9 Keatext
- 11.2.9.1. Overview
- 11.2.9.2. Products
- 11.2.9.3. SWOT Analysis
- 11.2.9.4. Recent Developments
- 11.2.9.5. Financials (Based on Availability)
- 11.2.10 Thematic Analysis
- 11.2.10.1. Overview
- 11.2.10.2. Products
- 11.2.10.3. SWOT Analysis
- 11.2.10.4. Recent Developments
- 11.2.10.5. Financials (Based on Availability)
- 11.2.11 Prodsight
- 11.2.11.1. Overview
- 11.2.11.2. Products
- 11.2.11.3. SWOT Analysis
- 11.2.11.4. Recent Developments
- 11.2.11.5. Financials (Based on Availability)
- 11.2.12 Cauliflower
- 11.2.12.1. Overview
- 11.2.12.2. Products
- 11.2.12.3. SWOT Analysis
- 11.2.12.4. Recent Developments
- 11.2.12.5. Financials (Based on Availability)
- 11.2.13 Chattermill
- 11.2.13.1. Overview
- 11.2.13.2. Products
- 11.2.13.3. SWOT Analysis
- 11.2.13.4. Recent Developments
- 11.2.13.5. Financials (Based on Availability)
- 11.2.14 Adoreboard
- 11.2.14.1. Overview
- 11.2.14.2. Products
- 11.2.14.3. SWOT Analysis
- 11.2.14.4. Recent Developments
- 11.2.14.5. Financials (Based on Availability)
- 11.2.15 Feedis
- 11.2.15.1. Overview
- 11.2.15.2. Products
- 11.2.15.3. SWOT Analysis
- 11.2.15.4. Recent Developments
- 11.2.15.5. Financials (Based on Availability)
- 11.2.16 Feelingstream
- 11.2.16.1. Overview
- 11.2.16.2. Products
- 11.2.16.3. SWOT Analysis
- 11.2.16.4. Recent Developments
- 11.2.16.5. Financials (Based on Availability)
- 11.2.17 Hoick
- 11.2.17.1. Overview
- 11.2.17.2. Products
- 11.2.17.3. SWOT Analysis
- 11.2.17.4. Recent Developments
- 11.2.17.5. Financials (Based on Availability)
- 11.2.18 Idiomatic
- 11.2.18.1. Overview
- 11.2.18.2. Products
- 11.2.18.3. SWOT Analysis
- 11.2.18.4. Recent Developments
- 11.2.18.5. Financials (Based on Availability)
- 11.2.19 Kapiche
- 11.2.19.1. Overview
- 11.2.19.2. Products
- 11.2.19.3. SWOT Analysis
- 11.2.19.4. Recent Developments
- 11.2.19.5. Financials (Based on Availability)
- 11.2.20 Mopinion
- 11.2.20.1. Overview
- 11.2.20.2. Products
- 11.2.20.3. SWOT Analysis
- 11.2.20.4. Recent Developments
- 11.2.20.5. Financials (Based on Availability)
- 11.2.21 Resonate Solutions
- 11.2.21.1. Overview
- 11.2.21.2. Products
- 11.2.21.3. SWOT Analysis
- 11.2.21.4. Recent Developments
- 11.2.21.5. Financials (Based on Availability)
- 11.2.22 Review Trackers
- 11.2.22.1. Overview
- 11.2.22.2. Products
- 11.2.22.3. SWOT Analysis
- 11.2.22.4. Recent Developments
- 11.2.22.5. Financials (Based on Availability)
- 11.2.23 AskSenti
- 11.2.23.1. Overview
- 11.2.23.2. Products
- 11.2.23.3. SWOT Analysis
- 11.2.23.4. Recent Developments
- 11.2.23.5. Financials (Based on Availability)
- 11.2.24 unitQ
- 11.2.24.1. Overview
- 11.2.24.2. Products
- 11.2.24.3. SWOT Analysis
- 11.2.24.4. Recent Developments
- 11.2.24.5. Financials (Based on Availability)
- 11.2.1 Qualtrics
List of Figures
- Figure 1: Global Feedback Analytics Software Revenue Breakdown (billion, %) by Region 2025 & 2033
- Figure 2: North America Feedback Analytics Software Revenue (billion), by Application 2025 & 2033
- Figure 3: North America Feedback Analytics Software Revenue Share (%), by Application 2025 & 2033
- Figure 4: North America Feedback Analytics Software Revenue (billion), by Type 2025 & 2033
- Figure 5: North America Feedback Analytics Software Revenue Share (%), by Type 2025 & 2033
- Figure 6: North America Feedback Analytics Software Revenue (billion), by Country 2025 & 2033
- Figure 7: North America Feedback Analytics Software Revenue Share (%), by Country 2025 & 2033
- Figure 8: South America Feedback Analytics Software Revenue (billion), by Application 2025 & 2033
- Figure 9: South America Feedback Analytics Software Revenue Share (%), by Application 2025 & 2033
- Figure 10: South America Feedback Analytics Software Revenue (billion), by Type 2025 & 2033
- Figure 11: South America Feedback Analytics Software Revenue Share (%), by Type 2025 & 2033
- Figure 12: South America Feedback Analytics Software Revenue (billion), by Country 2025 & 2033
- Figure 13: South America Feedback Analytics Software Revenue Share (%), by Country 2025 & 2033
- Figure 14: Europe Feedback Analytics Software Revenue (billion), by Application 2025 & 2033
- Figure 15: Europe Feedback Analytics Software Revenue Share (%), by Application 2025 & 2033
- Figure 16: Europe Feedback Analytics Software Revenue (billion), by Type 2025 & 2033
- Figure 17: Europe Feedback Analytics Software Revenue Share (%), by Type 2025 & 2033
- Figure 18: Europe Feedback Analytics Software Revenue (billion), by Country 2025 & 2033
- Figure 19: Europe Feedback Analytics Software Revenue Share (%), by Country 2025 & 2033
- Figure 20: Middle East & Africa Feedback Analytics Software Revenue (billion), by Application 2025 & 2033
- Figure 21: Middle East & Africa Feedback Analytics Software Revenue Share (%), by Application 2025 & 2033
- Figure 22: Middle East & Africa Feedback Analytics Software Revenue (billion), by Type 2025 & 2033
- Figure 23: Middle East & Africa Feedback Analytics Software Revenue Share (%), by Type 2025 & 2033
- Figure 24: Middle East & Africa Feedback Analytics Software Revenue (billion), by Country 2025 & 2033
- Figure 25: Middle East & Africa Feedback Analytics Software Revenue Share (%), by Country 2025 & 2033
- Figure 26: Asia Pacific Feedback Analytics Software Revenue (billion), by Application 2025 & 2033
- Figure 27: Asia Pacific Feedback Analytics Software Revenue Share (%), by Application 2025 & 2033
- Figure 28: Asia Pacific Feedback Analytics Software Revenue (billion), by Type 2025 & 2033
- Figure 29: Asia Pacific Feedback Analytics Software Revenue Share (%), by Type 2025 & 2033
- Figure 30: Asia Pacific Feedback Analytics Software Revenue (billion), by Country 2025 & 2033
- Figure 31: Asia Pacific Feedback Analytics Software Revenue Share (%), by Country 2025 & 2033
List of Tables
- Table 1: Global Feedback Analytics Software Revenue billion Forecast, by Application 2020 & 2033
- Table 2: Global Feedback Analytics Software Revenue billion Forecast, by Type 2020 & 2033
- Table 3: Global Feedback Analytics Software Revenue billion Forecast, by Region 2020 & 2033
- Table 4: Global Feedback Analytics Software Revenue billion Forecast, by Application 2020 & 2033
- Table 5: Global Feedback Analytics Software Revenue billion Forecast, by Type 2020 & 2033
- Table 6: Global Feedback Analytics Software Revenue billion Forecast, by Country 2020 & 2033
- Table 7: United States Feedback Analytics Software Revenue (billion) Forecast, by Application 2020 & 2033
- Table 8: Canada Feedback Analytics Software Revenue (billion) Forecast, by Application 2020 & 2033
- Table 9: Mexico Feedback Analytics Software Revenue (billion) Forecast, by Application 2020 & 2033
- Table 10: Global Feedback Analytics Software Revenue billion Forecast, by Application 2020 & 2033
- Table 11: Global Feedback Analytics Software Revenue billion Forecast, by Type 2020 & 2033
- Table 12: Global Feedback Analytics Software Revenue billion Forecast, by Country 2020 & 2033
- Table 13: Brazil Feedback Analytics Software Revenue (billion) Forecast, by Application 2020 & 2033
- Table 14: Argentina Feedback Analytics Software Revenue (billion) Forecast, by Application 2020 & 2033
- Table 15: Rest of South America Feedback Analytics Software Revenue (billion) Forecast, by Application 2020 & 2033
- Table 16: Global Feedback Analytics Software Revenue billion Forecast, by Application 2020 & 2033
- Table 17: Global Feedback Analytics Software Revenue billion Forecast, by Type 2020 & 2033
- Table 18: Global Feedback Analytics Software Revenue billion Forecast, by Country 2020 & 2033
- Table 19: United Kingdom Feedback Analytics Software Revenue (billion) Forecast, by Application 2020 & 2033
- Table 20: Germany Feedback Analytics Software Revenue (billion) Forecast, by Application 2020 & 2033
- Table 21: France Feedback Analytics Software Revenue (billion) Forecast, by Application 2020 & 2033
- Table 22: Italy Feedback Analytics Software Revenue (billion) Forecast, by Application 2020 & 2033
- Table 23: Spain Feedback Analytics Software Revenue (billion) Forecast, by Application 2020 & 2033
- Table 24: Russia Feedback Analytics Software Revenue (billion) Forecast, by Application 2020 & 2033
- Table 25: Benelux Feedback Analytics Software Revenue (billion) Forecast, by Application 2020 & 2033
- Table 26: Nordics Feedback Analytics Software Revenue (billion) Forecast, by Application 2020 & 2033
- Table 27: Rest of Europe Feedback Analytics Software Revenue (billion) Forecast, by Application 2020 & 2033
- Table 28: Global Feedback Analytics Software Revenue billion Forecast, by Application 2020 & 2033
- Table 29: Global Feedback Analytics Software Revenue billion Forecast, by Type 2020 & 2033
- Table 30: Global Feedback Analytics Software Revenue billion Forecast, by Country 2020 & 2033
- Table 31: Turkey Feedback Analytics Software Revenue (billion) Forecast, by Application 2020 & 2033
- Table 32: Israel Feedback Analytics Software Revenue (billion) Forecast, by Application 2020 & 2033
- Table 33: GCC Feedback Analytics Software Revenue (billion) Forecast, by Application 2020 & 2033
- Table 34: North Africa Feedback Analytics Software Revenue (billion) Forecast, by Application 2020 & 2033
- Table 35: South Africa Feedback Analytics Software Revenue (billion) Forecast, by Application 2020 & 2033
- Table 36: Rest of Middle East & Africa Feedback Analytics Software Revenue (billion) Forecast, by Application 2020 & 2033
- Table 37: Global Feedback Analytics Software Revenue billion Forecast, by Application 2020 & 2033
- Table 38: Global Feedback Analytics Software Revenue billion Forecast, by Type 2020 & 2033
- Table 39: Global Feedback Analytics Software Revenue billion Forecast, by Country 2020 & 2033
- Table 40: China Feedback Analytics Software Revenue (billion) Forecast, by Application 2020 & 2033
- Table 41: India Feedback Analytics Software Revenue (billion) Forecast, by Application 2020 & 2033
- Table 42: Japan Feedback Analytics Software Revenue (billion) Forecast, by Application 2020 & 2033
- Table 43: South Korea Feedback Analytics Software Revenue (billion) Forecast, by Application 2020 & 2033
- Table 44: ASEAN Feedback Analytics Software Revenue (billion) Forecast, by Application 2020 & 2033
- Table 45: Oceania Feedback Analytics Software Revenue (billion) Forecast, by Application 2020 & 2033
- Table 46: Rest of Asia Pacific Feedback Analytics Software Revenue (billion) Forecast, by Application 2020 & 2033
Frequently Asked Questions
1. What is the projected Compound Annual Growth Rate (CAGR) of the Feedback Analytics Software?
The projected CAGR is approximately 16.9%.
2. Which companies are prominent players in the Feedback Analytics Software?
Key companies in the market include Qualtrics, Birdeye, Wootric, Medallia, Clarabridge, Warwick Analytics Services, Stratifyd, Confirmit, Keatext, Thematic Analysis, Prodsight, Cauliflower, Chattermill, Adoreboard, Feedis, Feelingstream, Hoick, Idiomatic, Kapiche, Mopinion, Resonate Solutions, Review Trackers, AskSenti, unitQ.
3. What are the main segments of the Feedback Analytics Software?
The market segments include Application, Type.
4. Can you provide details about the market size?
The market size is estimated to be USD 16.73 billion as of 2022.
5. What are some drivers contributing to market growth?
N/A
6. What are the notable trends driving market growth?
N/A
7. Are there any restraints impacting market growth?
N/A
8. Can you provide examples of recent developments in the market?
N/A
9. What pricing options are available for accessing the report?
Pricing options include single-user, multi-user, and enterprise licenses priced at USD 2900.00, USD 4350.00, and USD 5800.00 respectively.
10. Is the market size provided in terms of value or volume?
The market size is provided in terms of value, measured in billion.
11. Are there any specific market keywords associated with the report?
Yes, the market keyword associated with the report is "Feedback Analytics Software," which aids in identifying and referencing the specific market segment covered.
12. How do I determine which pricing option suits my needs best?
The pricing options vary based on user requirements and access needs. Individual users may opt for single-user licenses, while businesses requiring broader access may choose multi-user or enterprise licenses for cost-effective access to the report.
13. Are there any additional resources or data provided in the Feedback Analytics Software report?
While the report offers comprehensive insights, it's advisable to review the specific contents or supplementary materials provided to ascertain if additional resources or data are available.
14. How can I stay updated on further developments or reports in the Feedback Analytics Software?
To stay informed about further developments, trends, and reports in the Feedback Analytics Software, consider subscribing to industry newsletters, following relevant companies and organizations, or regularly checking reputable industry news sources and publications.
Methodology
Step 1 - Identification of Relevant Samples Size from Population Database


Step 2 - Approaches for Defining Global Market Size (Value, Volume* & Price*)

Note*: In applicable scenarios
Step 3 - Data Sources
Primary Research
- Web Analytics
- Survey Reports
- Research Institute
- Latest Research Reports
- Opinion Leaders
Secondary Research
- Annual Reports
- White Paper
- Latest Press Release
- Industry Association
- Paid Database
- Investor Presentations

Step 4 - Data Triangulation
Involves using different sources of information in order to increase the validity of a study
These sources are likely to be stakeholders in a program - participants, other researchers, program staff, other community members, and so on.
Then we put all data in single framework & apply various statistical tools to find out the dynamic on the market.
During the analysis stage, feedback from the stakeholder groups would be compared to determine areas of agreement as well as areas of divergence