

Key Insights
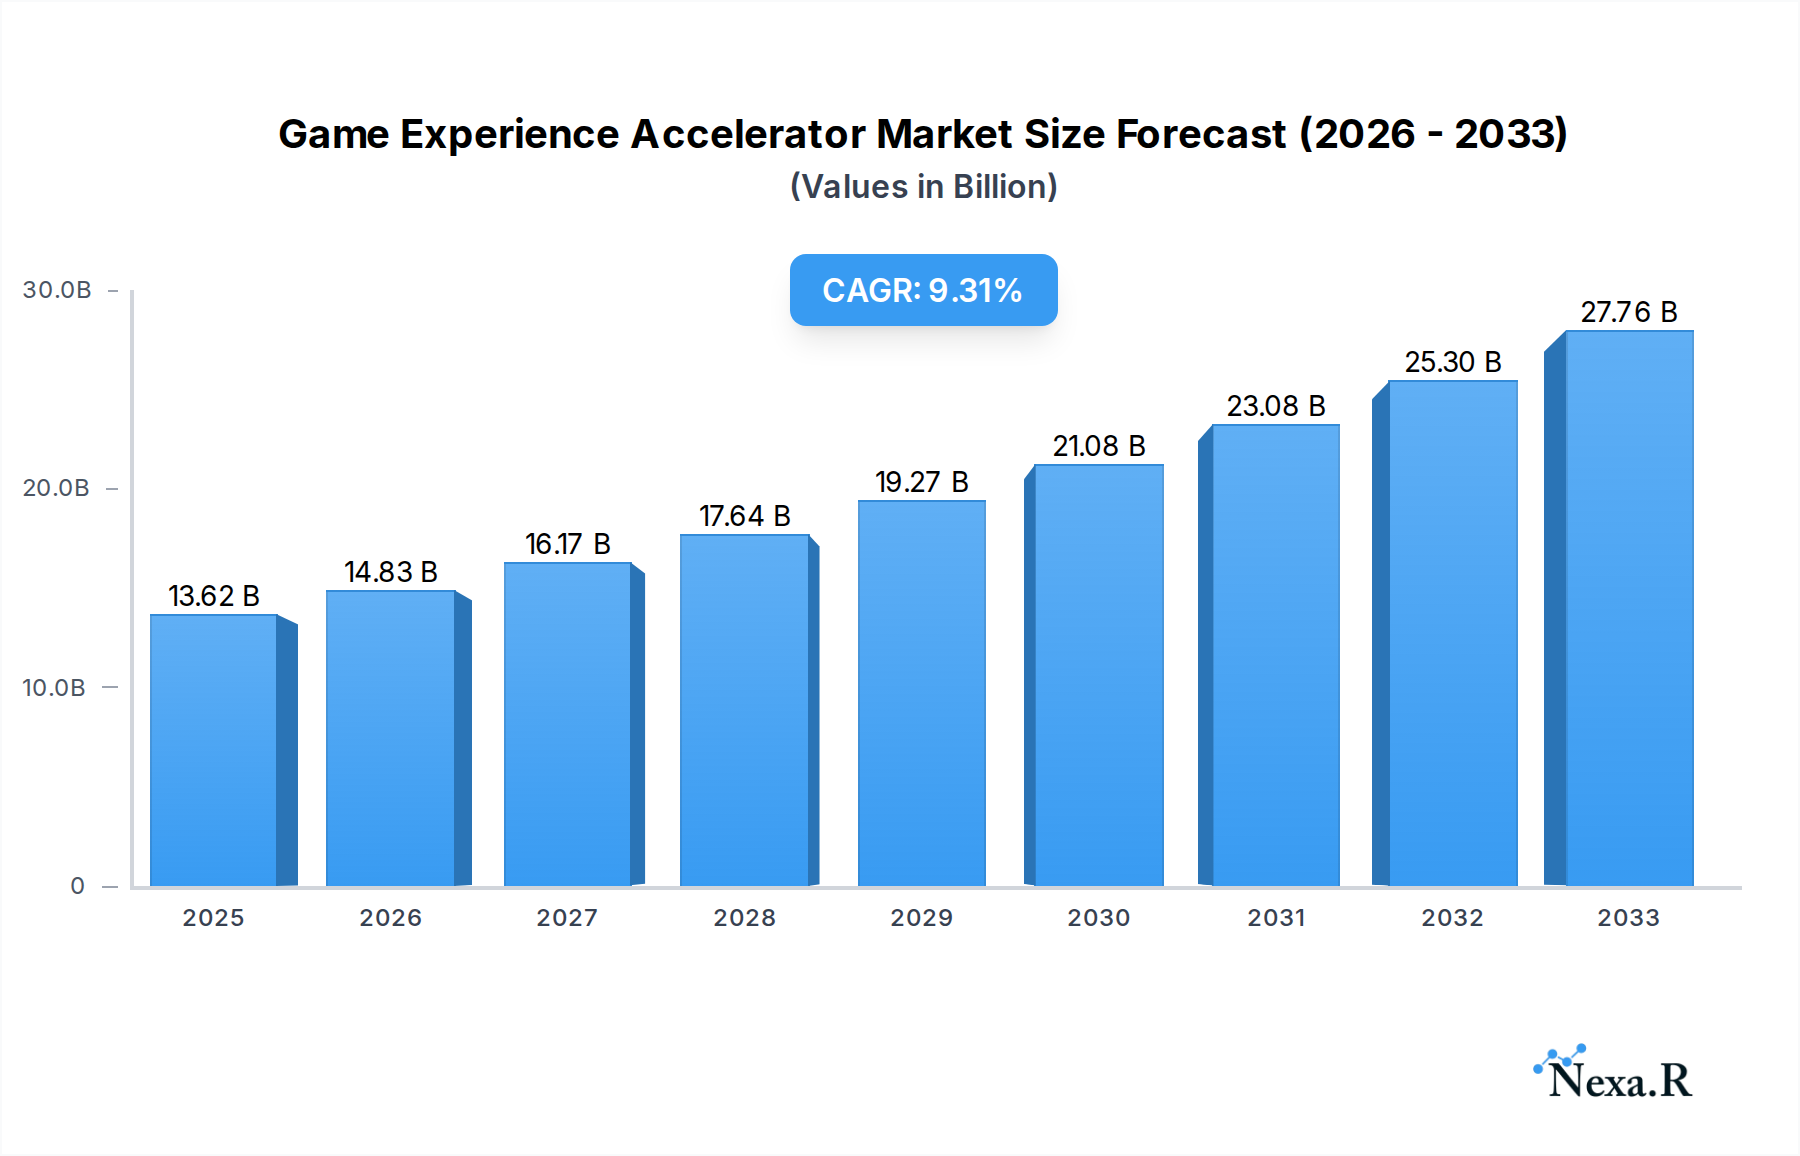
The global Game Experience Accelerator market is poised for substantial expansion, projected to reach an estimated $13.62 billion in 2025. This robust growth is fueled by the ever-increasing demand for seamless and high-performance online gaming experiences across diverse platforms. A significant CAGR of 9.12% is anticipated from 2025 to 2033, underscoring the market's dynamic trajectory. Key drivers for this surge include the proliferation of cloud gaming services, the rising popularity of competitive esports, and the continuous evolution of hardware and software technologies that demand optimized network performance. The market is segmented by application into Private Computer, Mobile Phone, and Game Console, each presenting unique opportunities for service providers. The Android and iOS operating systems are expected to dominate the software segment, reflecting their widespread adoption in mobile gaming.

Game Experience Accelerator Market Size (In Billion)
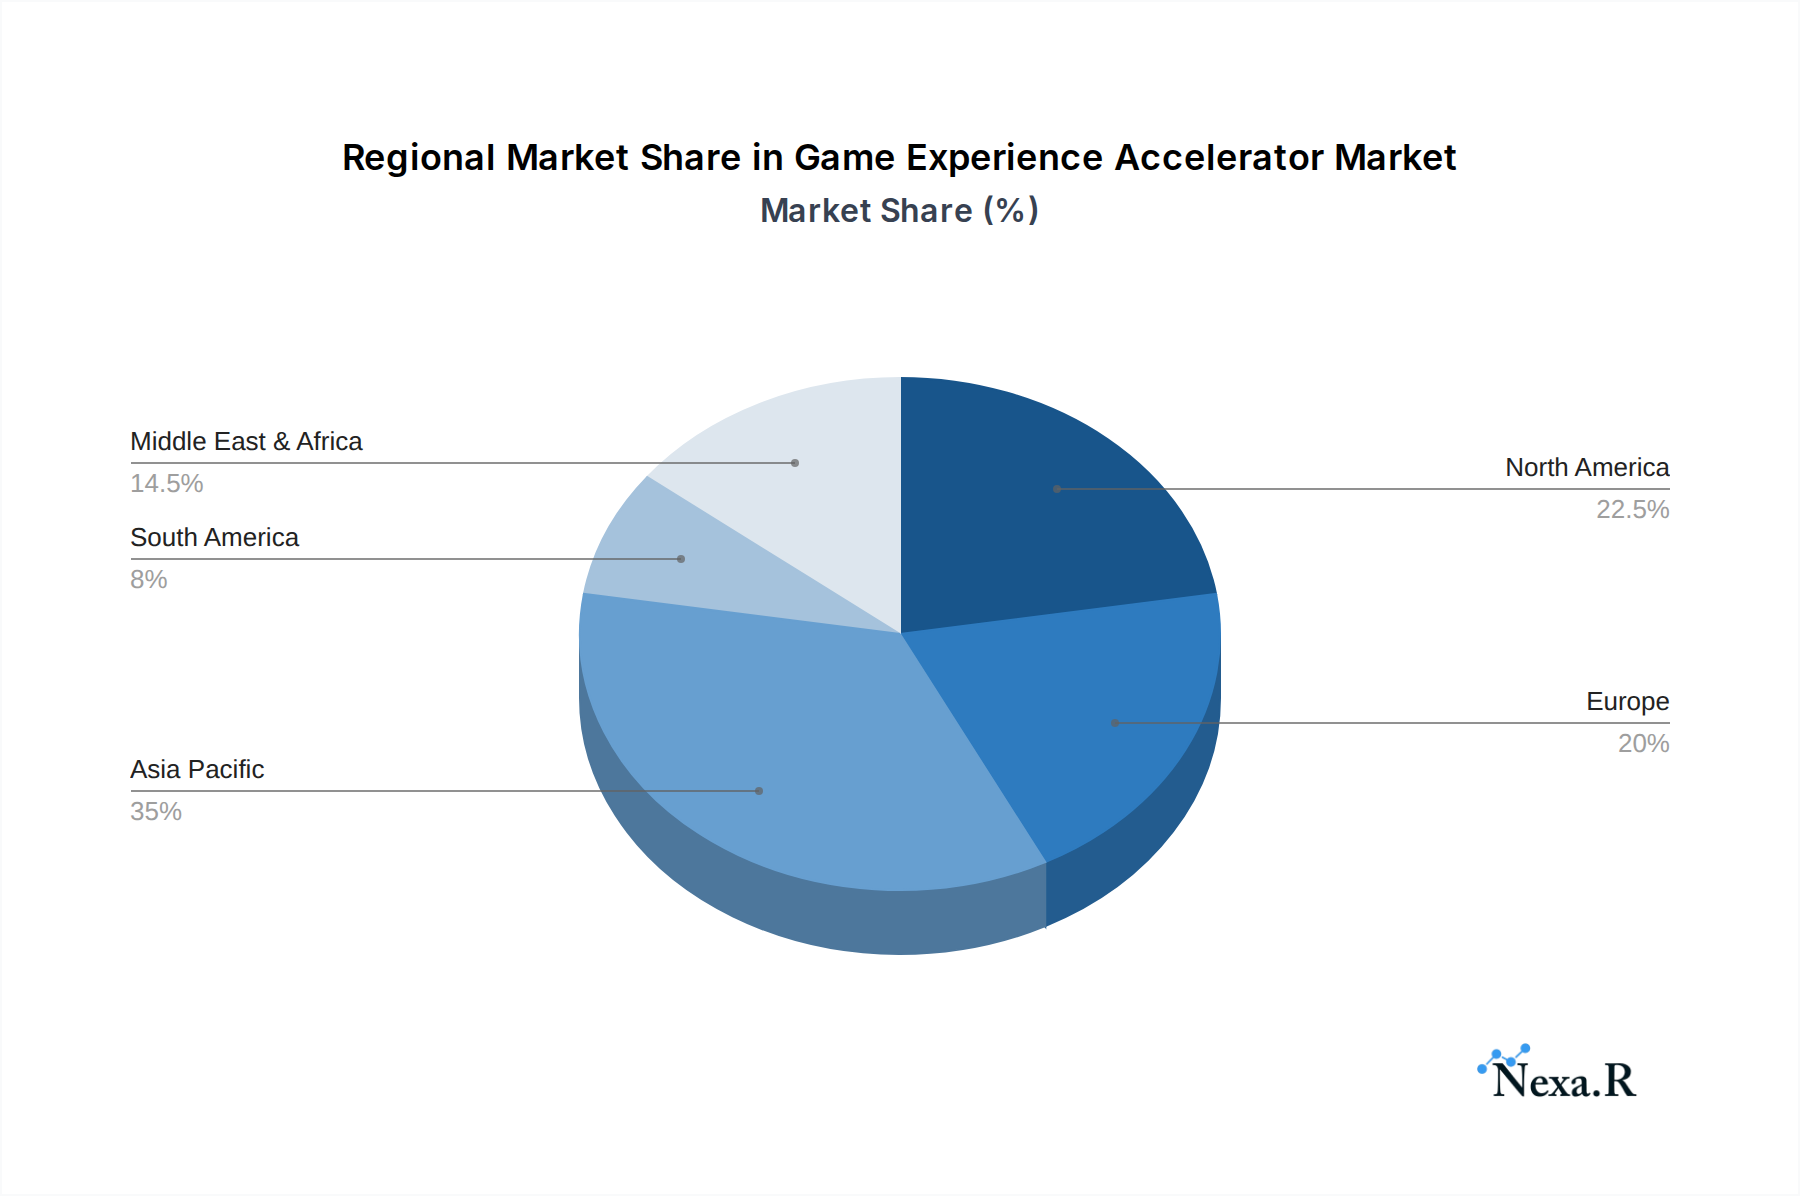
The market is also influenced by emerging trends such as the integration of AI and machine learning for predictive network optimization and the growing adoption of 5G technology, which promises ultra-low latency for mobile gaming. However, challenges such as high initial investment costs for advanced accelerator technologies and concerns over data privacy and security could temper rapid adoption in certain segments. The competitive landscape features prominent players like Xunyou Network Technology and NetEase, actively innovating to capture market share. Geographically, the Asia Pacific region, particularly China, is anticipated to be a major growth engine due to its massive gaming community and rapid technological adoption. North America and Europe also represent significant markets, driven by established gaming ecosystems and high disposable incomes.
Game Experience Accelerator Company Market Share
Game Experience Accelerator Report: Unleash Peak Performance for Gaming's Future
This comprehensive report, "Game Experience Accelerator Market Dynamics & Structure 2019–2033," delves into the rapidly evolving landscape of technologies designed to enhance gaming performance and immersion. We provide an in-depth analysis for industry professionals, investors, and stakeholders seeking to understand and capitalize on this burgeoning gaming tech market. Our study encompasses a broad spectrum, from private computer gaming acceleration to mobile gaming optimization and game console performance boosters. With a base year of 2025 and a forecast period extending to 2033, this report offers critical insights into market size, growth trends, regional dominance, and key players shaping the game accelerator industry.
Game Experience Accelerator Market Dynamics & Structure
The game experience accelerator market is characterized by dynamic shifts driven by rapid technological innovation and evolving consumer demand for seamless, high-fidelity gaming. Market concentration is moderate, with a growing number of specialized firms emerging alongside established technology giants. Key drivers include the increasing prevalence of high-end gaming PCs, the ubiquitous adoption of mobile gaming on Android and iOS devices, and the continued demand for enhanced performance on gaming consoles. Regulatory frameworks, particularly concerning data privacy and cross-border access, present a developing, albeit currently minor, constraint. Competitive product substitutes, such as improved hardware components and optimized game engines, offer alternative pathways to performance enhancement but often lack the specialized, real-time optimization capabilities of dedicated accelerators. End-user demographics are broad, encompassing casual mobile gamers, dedicated PC enthusiasts, and esports professionals, each with distinct needs and willingness to invest. Merger and acquisition (M&A) trends indicate a consolidation phase, with larger technology firms acquiring smaller, innovative players to integrate advanced acceleration technologies into their existing ecosystems.
- Market Concentration: Moderate, with increasing specialization and M&A activity.
- Technological Innovation Drivers: Demand for lower latency, higher frame rates, and smoother gameplay across all platforms.
- Regulatory Frameworks: Evolving, with a focus on data privacy and cross-border service delivery.
- Competitive Product Substitutes: Hardware upgrades, software optimization tools, and in-game settings.
- End-User Demographics: Diverse, from casual mobile users to professional esports athletes.
- M&A Trends: Strategic acquisitions by major tech players seeking to bolster their gaming offerings.
Game Experience Accelerator Growth Trends & Insights
The game experience accelerator market is poised for significant expansion, projected to reach an estimated $XX billion by 2025, with robust growth anticipated throughout the forecast period. This surge is fueled by an insatiable global appetite for enhanced online gaming performance, driven by the increasing complexity of modern game titles and the rising popularity of competitive esports. Adoption rates for game experience accelerators are accelerating, particularly among dedicated gamers seeking a competitive edge and a more immersive experience. Mobile gaming optimization, in particular, is witnessing exponential growth, as consumers demand flawless performance on their smartphones, irrespective of network conditions or device specifications. Technological disruptions, including advancements in cloud gaming infrastructure, AI-driven performance tuning, and next-generation networking protocols, are continuously pushing the boundaries of what is possible, leading to a dynamic interplay of innovation and adoption.
Consumer behavior shifts are profoundly impacting the market. Gamers are increasingly prioritizing low latency and high frame rates, viewing these as essential components of a satisfactory gaming session. This heightened awareness of performance metrics translates into a greater willingness to invest in solutions that promise tangible improvements. The proliferation of high-speed internet access, including 5G deployment, is a critical enabler, allowing for more effective delivery of real-time acceleration services. Furthermore, the growth of the esports market, with its massive viewership and professional player base, creates a powerful demand for solutions that minimize lag and maximize responsiveness. The integration of these accelerators into broader gaming ecosystems, from operating systems to hardware manufacturers, is also contributing to widespread adoption. The private computer gaming segment continues to be a strong performer, with enthusiasts investing heavily in hardware and software to achieve peak performance. Similarly, the game console market is experiencing an uplift as players seek to maximize their enjoyment of the latest AAA titles. The projected Compound Annual Growth Rate (CAGR) for this market is estimated at XX% between 2025 and 2033, reflecting its high-growth trajectory. Market penetration is expected to rise from XX% in 2025 to an estimated XX% by 2033, indicating a substantial increase in the number of gamers actively utilizing acceleration technologies.
Dominant Regions, Countries, or Segments in Game Experience Accelerator
The game experience accelerator market is witnessing significant dominance from regions and specific segments driven by a confluence of economic strength, technological adoption, and a vibrant gaming culture. Asia-Pacific, particularly China and South Korea, has emerged as a leading force in this market. This dominance is underpinned by several key factors, including the sheer scale of the gaming population, substantial government investment in digital infrastructure and technology, and a highly competitive gaming ecosystem that fosters innovation. The robust presence of companies like NetEase and Xunyou Network Technology further solidifies this region's leadership.
Within the broader market, the mobile phone segment is currently the most dominant driver of growth, accounting for an estimated XX% of the market share in 2025. This is directly attributable to the widespread accessibility of smartphones across all income demographics and the unparalleled convenience they offer for gaming. The Android operating system leads this charge, with its open ecosystem allowing for a proliferation of gaming apps and acceleration solutions. However, the iOS platform also commands a significant share, driven by its user base’s propensity for premium gaming experiences and consistent hardware performance.
While mobile gaming leads in volume, the private computer segment remains a critical and high-value segment, driven by hardcore gamers and esports professionals who demand the absolute best performance. These users are willing to invest heavily in specialized hardware and software solutions, including those offered by companies like NNLink and Junyun Technology, to achieve minimal latency and maximum frame rates. The game console segment also contributes significantly, with players seeking to enhance their experience on platforms like PlayStation and Xbox, especially for graphically demanding titles.
- Dominant Region: Asia-Pacific (especially China and South Korea) due to massive gaming population and technological advancement.
- Leading Segment (by volume): Mobile Phone, driven by accessibility and convenience.
- Dominant Type (Mobile): Android, owing to its open ecosystem and widespread adoption.
- High-Value Segment: Private Computer, catering to enthusiasts and professionals seeking peak performance.
- Key Drivers in Dominant Regions:
- Economic policies supporting technology and digital industries.
- Extensive high-speed internet infrastructure (including 5G).
- Large and engaged gaming communities and esports scenes.
- Presence of leading game development and technology companies.
- Market Share within Segments (2025 Estimates):
- Mobile Phone: XX%
- Private Computer: XX%
- Game Console: XX%
- Other: XX%
Game Experience Accelerator Product Landscape
The game experience accelerator product landscape is characterized by a diverse range of solutions designed to enhance gaming performance across various platforms. Innovations are primarily focused on reducing latency, optimizing network traffic, and improving processing efficiency. These products often leverage advanced algorithms, AI, and machine learning to dynamically adjust system resources in real-time, ensuring a smoother and more responsive gaming experience. Unique selling propositions include ultra-low latency connections, intelligent bandwidth management, and personalized performance tuning for individual games and hardware configurations. Technological advancements in packet prioritization and data compression are at the forefront, enabling faster data transfer and reduced lag.
Key Drivers, Barriers & Challenges in Game Experience Accelerator
The game experience accelerator industry is propelled by several key drivers, predominantly the escalating demand for enhanced gaming performance, including lower latency and higher frame rates, fueled by the massive growth in the global gaming market, particularly esports. The proliferation of high-speed internet infrastructure, such as 5G, is a critical enabler, allowing for more effective real-time optimization. Furthermore, advancements in AI and machine learning are driving innovation in intelligent performance tuning.
However, the industry faces significant barriers and challenges. Supply chain issues for critical hardware components, though easing, can still impact the availability of devices that integrate these acceleration technologies. Regulatory hurdles related to data privacy and cross-border service provision can create complexity for global market expansion. Competitive pressures from alternative solutions like hardware upgrades and in-game optimization settings also pose a challenge, requiring accelerators to demonstrate clear, quantifiable benefits. The technical complexity of integrating acceleration solutions seamlessly across diverse hardware and software ecosystems can also be a barrier to widespread adoption.
Emerging Opportunities in Game Experience Accelerator
Emerging opportunities in the game experience accelerator market lie in several key areas, including the expansion into emerging markets with rapidly growing gaming populations and increasing disposable income. The integration of AI-powered predictive analytics for proactive performance optimization, rather than reactive adjustments, presents a significant opportunity. Furthermore, the development of specialized acceleration solutions for augmented reality (AR) and virtual reality (VR) gaming, where low latency is paramount, represents a substantial untapped market. Evolving consumer preferences towards cloud gaming also opens avenues for optimizing streaming performance and reducing perceived lag.
Growth Accelerators in the Game Experience Accelerator Industry
Catalysts driving long-term growth in the game experience accelerator industry include groundbreaking advancements in network technologies, such as the widespread adoption of Wi-Fi 7 and further development of 6G capabilities, which will unlock unprecedented levels of speed and responsiveness. Strategic partnerships between accelerator providers, game developers, and hardware manufacturers are crucial for seamless integration and co-marketing efforts. The increasing professionalization of the esports industry, with its substantial prize pools and growing viewership, acts as a significant growth accelerator, demanding the highest levels of performance. Market expansion into new geographical regions with burgeoning gaming markets also presents considerable growth potential.
Key Players Shaping the Game Experience Accelerator Market
- Xunyou Network Technology
- NetEase
- NNLink
- Junyun Technology
- GuangZhou NingJingHai Technology
- Qingfeng (Beijing) Technology
- AK Game
- FuNiu
Notable Milestones in Game Experience Accelerator Sector
- 2019-2021: Increased focus on mobile game optimization due to the surge in mobile gaming popularity and the introduction of more demanding mobile titles.
- 2020: Emergence of AI-driven network optimization solutions for real-time latency reduction.
- 2021-2022: Significant investment in research and development for cloud gaming acceleration technologies.
- 2022: Key acquisitions of smaller acceleration tech firms by larger tech conglomerates seeking to bolster their gaming portfolios.
- 2023: Growing adoption of hardware-level acceleration solutions for PC gaming.
- 2024: Initial discussions and development for Wi-Fi 7 integration in gaming devices and acceleration software.
In-Depth Game Experience Accelerator Market Outlook
The outlook for the game experience accelerator market is exceptionally positive, driven by continued technological innovation and an ever-growing global gaming community. Future market potential is immense, particularly as advancements in cloud gaming, VR/AR, and edge computing become more prevalent, demanding sophisticated real-time performance solutions. Strategic opportunities lie in focusing on cross-platform compatibility, developing specialized solutions for niche gaming genres, and forging deeper integrations with game engines and operating systems. The convergence of hardware and software optimization will be key to unlocking the next era of immersive and lag-free gaming experiences.
Game Experience Accelerator Segmentation
-
1. Application
- 1.1. Private Computer
- 1.2. Mobile Phone
- 1.3. Game Console
-
2. Type
- 2.1. Android
- 2.2. iOS
- 2.3. Windows
- 2.4. Other
Game Experience Accelerator Segmentation By Geography
-
1. North America
- 1.1. United States
- 1.2. Canada
- 1.3. Mexico
-
2. South America
- 2.1. Brazil
- 2.2. Argentina
- 2.3. Rest of South America
-
3. Europe
- 3.1. United Kingdom
- 3.2. Germany
- 3.3. France
- 3.4. Italy
- 3.5. Spain
- 3.6. Russia
- 3.7. Benelux
- 3.8. Nordics
- 3.9. Rest of Europe
-
4. Middle East & Africa
- 4.1. Turkey
- 4.2. Israel
- 4.3. GCC
- 4.4. North Africa
- 4.5. South Africa
- 4.6. Rest of Middle East & Africa
-
5. Asia Pacific
- 5.1. China
- 5.2. India
- 5.3. Japan
- 5.4. South Korea
- 5.5. ASEAN
- 5.6. Oceania
- 5.7. Rest of Asia Pacific
Game Experience Accelerator Regional Market Share
Geographic Coverage of Game Experience Accelerator
Game Experience Accelerator REPORT HIGHLIGHTS
| Aspects | Details |
|---|---|
| Study Period | 2020-2034 |
| Base Year | 2025 |
| Estimated Year | 2026 |
| Forecast Period | 2026-2034 |
| Historical Period | 2020-2025 |
| Growth Rate | CAGR of 14.4% from 2020-2034 |
| Segmentation |
|
Table of Contents
- 1. Introduction
- 1.1. Research Scope
- 1.2. Market Segmentation
- 1.3. Research Objective
- 1.4. Definitions and Assumptions
- 2. Executive Summary
- 2.1. Market Snapshot
- 3. Market Dynamics
- 3.1. Market Drivers
- 3.2. Market Restrains
- 3.3. Market Trends
- 3.4. Market Opportunities
- 4. Market Factor Analysis
- 4.1. Porters Five Forces
- 4.1.1. Bargaining Power of Suppliers
- 4.1.2. Bargaining Power of Buyers
- 4.1.3. Threat of New Entrants
- 4.1.4. Threat of Substitutes
- 4.1.5. Competitive Rivalry
- 4.2. PESTEL analysis
- 4.3. BCG Analysis
- 4.3.1. Stars (High Growth, High Market Share)
- 4.3.2. Cash Cows (Low Growth, High Market Share)
- 4.3.3. Question Mark (High Growth, Low Market Share)
- 4.3.4. Dogs (Low Growth, Low Market Share)
- 4.4. Ansoff Matrix Analysis
- 4.5. Supply Chain Analysis
- 4.6. Regulatory Landscape
- 4.7. Current Market Potential and Opportunity Assessment (TAM–SAM–SOM Framework)
- 4.8. NRP Analyst Note
- 4.1. Porters Five Forces
- 5. Market Analysis, Insights and Forecast 2021-2033
- 5.1. Market Analysis, Insights and Forecast - by Application
- 5.1.1. Private Computer
- 5.1.2. Mobile Phone
- 5.1.3. Game Console
- 5.2. Market Analysis, Insights and Forecast - by Type
- 5.2.1. Android
- 5.2.2. iOS
- 5.2.3. Windows
- 5.2.4. Other
- 5.3. Market Analysis, Insights and Forecast - by Region
- 5.3.1. North America
- 5.3.2. South America
- 5.3.3. Europe
- 5.3.4. Middle East & Africa
- 5.3.5. Asia Pacific
- 5.1. Market Analysis, Insights and Forecast - by Application
- 6. Global Game Experience Accelerator Analysis, Insights and Forecast, 2021-2033
- 6.1. Market Analysis, Insights and Forecast - by Application
- 6.1.1. Private Computer
- 6.1.2. Mobile Phone
- 6.1.3. Game Console
- 6.2. Market Analysis, Insights and Forecast - by Type
- 6.2.1. Android
- 6.2.2. iOS
- 6.2.3. Windows
- 6.2.4. Other
- 6.1. Market Analysis, Insights and Forecast - by Application
- 7. North America Game Experience Accelerator Analysis, Insights and Forecast, 2020-2032
- 7.1. Market Analysis, Insights and Forecast - by Application
- 7.1.1. Private Computer
- 7.1.2. Mobile Phone
- 7.1.3. Game Console
- 7.2. Market Analysis, Insights and Forecast - by Type
- 7.2.1. Android
- 7.2.2. iOS
- 7.2.3. Windows
- 7.2.4. Other
- 7.1. Market Analysis, Insights and Forecast - by Application
- 8. South America Game Experience Accelerator Analysis, Insights and Forecast, 2020-2032
- 8.1. Market Analysis, Insights and Forecast - by Application
- 8.1.1. Private Computer
- 8.1.2. Mobile Phone
- 8.1.3. Game Console
- 8.2. Market Analysis, Insights and Forecast - by Type
- 8.2.1. Android
- 8.2.2. iOS
- 8.2.3. Windows
- 8.2.4. Other
- 8.1. Market Analysis, Insights and Forecast - by Application
- 9. Europe Game Experience Accelerator Analysis, Insights and Forecast, 2020-2032
- 9.1. Market Analysis, Insights and Forecast - by Application
- 9.1.1. Private Computer
- 9.1.2. Mobile Phone
- 9.1.3. Game Console
- 9.2. Market Analysis, Insights and Forecast - by Type
- 9.2.1. Android
- 9.2.2. iOS
- 9.2.3. Windows
- 9.2.4. Other
- 9.1. Market Analysis, Insights and Forecast - by Application
- 10. Middle East & Africa Game Experience Accelerator Analysis, Insights and Forecast, 2020-2032
- 10.1. Market Analysis, Insights and Forecast - by Application
- 10.1.1. Private Computer
- 10.1.2. Mobile Phone
- 10.1.3. Game Console
- 10.2. Market Analysis, Insights and Forecast - by Type
- 10.2.1. Android
- 10.2.2. iOS
- 10.2.3. Windows
- 10.2.4. Other
- 10.1. Market Analysis, Insights and Forecast - by Application
- 11. Asia Pacific Game Experience Accelerator Analysis, Insights and Forecast, 2020-2032
- 11.1. Market Analysis, Insights and Forecast - by Application
- 11.1.1. Private Computer
- 11.1.2. Mobile Phone
- 11.1.3. Game Console
- 11.2. Market Analysis, Insights and Forecast - by Type
- 11.2.1. Android
- 11.2.2. iOS
- 11.2.3. Windows
- 11.2.4. Other
- 11.1. Market Analysis, Insights and Forecast - by Application
- 12. Competitive Analysis
- 12.1. Company Profiles
- 12.1.1 Xunyou Network Technology
- 12.1.1.1. Company Overview
- 12.1.1.2. Products
- 12.1.1.3. Company Financials
- 12.1.1.4. SWOT Analysis
- 12.1.2 NetEase
- 12.1.2.1. Company Overview
- 12.1.2.2. Products
- 12.1.2.3. Company Financials
- 12.1.2.4. SWOT Analysis
- 12.1.3 NNLink
- 12.1.3.1. Company Overview
- 12.1.3.2. Products
- 12.1.3.3. Company Financials
- 12.1.3.4. SWOT Analysis
- 12.1.4 Junyun Technology
- 12.1.4.1. Company Overview
- 12.1.4.2. Products
- 12.1.4.3. Company Financials
- 12.1.4.4. SWOT Analysis
- 12.1.5 GuangZhou NingJingHai Technology
- 12.1.5.1. Company Overview
- 12.1.5.2. Products
- 12.1.5.3. Company Financials
- 12.1.5.4. SWOT Analysis
- 12.1.6 Qingfeng (Beijing) Technology
- 12.1.6.1. Company Overview
- 12.1.6.2. Products
- 12.1.6.3. Company Financials
- 12.1.6.4. SWOT Analysis
- 12.1.7 AK Game
- 12.1.7.1. Company Overview
- 12.1.7.2. Products
- 12.1.7.3. Company Financials
- 12.1.7.4. SWOT Analysis
- 12.1.8 FuNiu
- 12.1.8.1. Company Overview
- 12.1.8.2. Products
- 12.1.8.3. Company Financials
- 12.1.8.4. SWOT Analysis
- 12.1.1 Xunyou Network Technology
- 12.2. Market Entropy
- 12.2.1 Company's Key Areas Served
- 12.2.2 Recent Developments
- 12.3. Company Market Share Analysis 2025
- 12.3.1 Top 5 Companies Market Share Analysis
- 12.3.2 Top 3 Companies Market Share Analysis
- 12.4. List of Potential Customers
- 13. Research Methodology
List of Figures
- Figure 1: Global Game Experience Accelerator Revenue Breakdown (undefined, %) by Region 2025 & 2033
- Figure 2: North America Game Experience Accelerator Revenue (undefined), by Application 2025 & 2033
- Figure 3: North America Game Experience Accelerator Revenue Share (%), by Application 2025 & 2033
- Figure 4: North America Game Experience Accelerator Revenue (undefined), by Type 2025 & 2033
- Figure 5: North America Game Experience Accelerator Revenue Share (%), by Type 2025 & 2033
- Figure 6: North America Game Experience Accelerator Revenue (undefined), by Country 2025 & 2033
- Figure 7: North America Game Experience Accelerator Revenue Share (%), by Country 2025 & 2033
- Figure 8: South America Game Experience Accelerator Revenue (undefined), by Application 2025 & 2033
- Figure 9: South America Game Experience Accelerator Revenue Share (%), by Application 2025 & 2033
- Figure 10: South America Game Experience Accelerator Revenue (undefined), by Type 2025 & 2033
- Figure 11: South America Game Experience Accelerator Revenue Share (%), by Type 2025 & 2033
- Figure 12: South America Game Experience Accelerator Revenue (undefined), by Country 2025 & 2033
- Figure 13: South America Game Experience Accelerator Revenue Share (%), by Country 2025 & 2033
- Figure 14: Europe Game Experience Accelerator Revenue (undefined), by Application 2025 & 2033
- Figure 15: Europe Game Experience Accelerator Revenue Share (%), by Application 2025 & 2033
- Figure 16: Europe Game Experience Accelerator Revenue (undefined), by Type 2025 & 2033
- Figure 17: Europe Game Experience Accelerator Revenue Share (%), by Type 2025 & 2033
- Figure 18: Europe Game Experience Accelerator Revenue (undefined), by Country 2025 & 2033
- Figure 19: Europe Game Experience Accelerator Revenue Share (%), by Country 2025 & 2033
- Figure 20: Middle East & Africa Game Experience Accelerator Revenue (undefined), by Application 2025 & 2033
- Figure 21: Middle East & Africa Game Experience Accelerator Revenue Share (%), by Application 2025 & 2033
- Figure 22: Middle East & Africa Game Experience Accelerator Revenue (undefined), by Type 2025 & 2033
- Figure 23: Middle East & Africa Game Experience Accelerator Revenue Share (%), by Type 2025 & 2033
- Figure 24: Middle East & Africa Game Experience Accelerator Revenue (undefined), by Country 2025 & 2033
- Figure 25: Middle East & Africa Game Experience Accelerator Revenue Share (%), by Country 2025 & 2033
- Figure 26: Asia Pacific Game Experience Accelerator Revenue (undefined), by Application 2025 & 2033
- Figure 27: Asia Pacific Game Experience Accelerator Revenue Share (%), by Application 2025 & 2033
- Figure 28: Asia Pacific Game Experience Accelerator Revenue (undefined), by Type 2025 & 2033
- Figure 29: Asia Pacific Game Experience Accelerator Revenue Share (%), by Type 2025 & 2033
- Figure 30: Asia Pacific Game Experience Accelerator Revenue (undefined), by Country 2025 & 2033
- Figure 31: Asia Pacific Game Experience Accelerator Revenue Share (%), by Country 2025 & 2033
List of Tables
- Table 1: Global Game Experience Accelerator Revenue undefined Forecast, by Application 2020 & 2033
- Table 2: Global Game Experience Accelerator Revenue undefined Forecast, by Type 2020 & 2033
- Table 3: Global Game Experience Accelerator Revenue undefined Forecast, by Region 2020 & 2033
- Table 4: Global Game Experience Accelerator Revenue undefined Forecast, by Application 2020 & 2033
- Table 5: Global Game Experience Accelerator Revenue undefined Forecast, by Type 2020 & 2033
- Table 6: Global Game Experience Accelerator Revenue undefined Forecast, by Country 2020 & 2033
- Table 7: United States Game Experience Accelerator Revenue (undefined) Forecast, by Application 2020 & 2033
- Table 8: Canada Game Experience Accelerator Revenue (undefined) Forecast, by Application 2020 & 2033
- Table 9: Mexico Game Experience Accelerator Revenue (undefined) Forecast, by Application 2020 & 2033
- Table 10: Global Game Experience Accelerator Revenue undefined Forecast, by Application 2020 & 2033
- Table 11: Global Game Experience Accelerator Revenue undefined Forecast, by Type 2020 & 2033
- Table 12: Global Game Experience Accelerator Revenue undefined Forecast, by Country 2020 & 2033
- Table 13: Brazil Game Experience Accelerator Revenue (undefined) Forecast, by Application 2020 & 2033
- Table 14: Argentina Game Experience Accelerator Revenue (undefined) Forecast, by Application 2020 & 2033
- Table 15: Rest of South America Game Experience Accelerator Revenue (undefined) Forecast, by Application 2020 & 2033
- Table 16: Global Game Experience Accelerator Revenue undefined Forecast, by Application 2020 & 2033
- Table 17: Global Game Experience Accelerator Revenue undefined Forecast, by Type 2020 & 2033
- Table 18: Global Game Experience Accelerator Revenue undefined Forecast, by Country 2020 & 2033
- Table 19: United Kingdom Game Experience Accelerator Revenue (undefined) Forecast, by Application 2020 & 2033
- Table 20: Germany Game Experience Accelerator Revenue (undefined) Forecast, by Application 2020 & 2033
- Table 21: France Game Experience Accelerator Revenue (undefined) Forecast, by Application 2020 & 2033
- Table 22: Italy Game Experience Accelerator Revenue (undefined) Forecast, by Application 2020 & 2033
- Table 23: Spain Game Experience Accelerator Revenue (undefined) Forecast, by Application 2020 & 2033
- Table 24: Russia Game Experience Accelerator Revenue (undefined) Forecast, by Application 2020 & 2033
- Table 25: Benelux Game Experience Accelerator Revenue (undefined) Forecast, by Application 2020 & 2033
- Table 26: Nordics Game Experience Accelerator Revenue (undefined) Forecast, by Application 2020 & 2033
- Table 27: Rest of Europe Game Experience Accelerator Revenue (undefined) Forecast, by Application 2020 & 2033
- Table 28: Global Game Experience Accelerator Revenue undefined Forecast, by Application 2020 & 2033
- Table 29: Global Game Experience Accelerator Revenue undefined Forecast, by Type 2020 & 2033
- Table 30: Global Game Experience Accelerator Revenue undefined Forecast, by Country 2020 & 2033
- Table 31: Turkey Game Experience Accelerator Revenue (undefined) Forecast, by Application 2020 & 2033
- Table 32: Israel Game Experience Accelerator Revenue (undefined) Forecast, by Application 2020 & 2033
- Table 33: GCC Game Experience Accelerator Revenue (undefined) Forecast, by Application 2020 & 2033
- Table 34: North Africa Game Experience Accelerator Revenue (undefined) Forecast, by Application 2020 & 2033
- Table 35: South Africa Game Experience Accelerator Revenue (undefined) Forecast, by Application 2020 & 2033
- Table 36: Rest of Middle East & Africa Game Experience Accelerator Revenue (undefined) Forecast, by Application 2020 & 2033
- Table 37: Global Game Experience Accelerator Revenue undefined Forecast, by Application 2020 & 2033
- Table 38: Global Game Experience Accelerator Revenue undefined Forecast, by Type 2020 & 2033
- Table 39: Global Game Experience Accelerator Revenue undefined Forecast, by Country 2020 & 2033
- Table 40: China Game Experience Accelerator Revenue (undefined) Forecast, by Application 2020 & 2033
- Table 41: India Game Experience Accelerator Revenue (undefined) Forecast, by Application 2020 & 2033
- Table 42: Japan Game Experience Accelerator Revenue (undefined) Forecast, by Application 2020 & 2033
- Table 43: South Korea Game Experience Accelerator Revenue (undefined) Forecast, by Application 2020 & 2033
- Table 44: ASEAN Game Experience Accelerator Revenue (undefined) Forecast, by Application 2020 & 2033
- Table 45: Oceania Game Experience Accelerator Revenue (undefined) Forecast, by Application 2020 & 2033
- Table 46: Rest of Asia Pacific Game Experience Accelerator Revenue (undefined) Forecast, by Application 2020 & 2033
Frequently Asked Questions
1. What is the projected Compound Annual Growth Rate (CAGR) of the Game Experience Accelerator?
The projected CAGR is approximately 14.4%.
2. Which companies are prominent players in the Game Experience Accelerator?
Key companies in the market include Xunyou Network Technology, NetEase, NNLink, Junyun Technology, GuangZhou NingJingHai Technology, Qingfeng (Beijing) Technology, AK Game, FuNiu.
3. What are the main segments of the Game Experience Accelerator?
The market segments include Application, Type.
4. Can you provide details about the market size?
The market size is estimated to be USD XXX N/A as of 2022.
5. What are some drivers contributing to market growth?
N/A
6. What are the notable trends driving market growth?
N/A
7. Are there any restraints impacting market growth?
N/A
8. Can you provide examples of recent developments in the market?
N/A
9. What pricing options are available for accessing the report?
Pricing options include single-user, multi-user, and enterprise licenses priced at USD 2900.00, USD 4350.00, and USD 5800.00 respectively.
10. Is the market size provided in terms of value or volume?
The market size is provided in terms of value, measured in N/A.
11. Are there any specific market keywords associated with the report?
Yes, the market keyword associated with the report is "Game Experience Accelerator," which aids in identifying and referencing the specific market segment covered.
12. How do I determine which pricing option suits my needs best?
The pricing options vary based on user requirements and access needs. Individual users may opt for single-user licenses, while businesses requiring broader access may choose multi-user or enterprise licenses for cost-effective access to the report.
13. Are there any additional resources or data provided in the Game Experience Accelerator report?
While the report offers comprehensive insights, it's advisable to review the specific contents or supplementary materials provided to ascertain if additional resources or data are available.
14. How can I stay updated on further developments or reports in the Game Experience Accelerator?
To stay informed about further developments, trends, and reports in the Game Experience Accelerator, consider subscribing to industry newsletters, following relevant companies and organizations, or regularly checking reputable industry news sources and publications.
Methodology
Step 1 - Identification of Relevant Samples Size from Population Database


Step 2 - Approaches for Defining Global Market Size (Value, Volume* & Price*)

Note*: In applicable scenarios
Step 3 - Data Sources
Primary Research
- Web Analytics
- Survey Reports
- Research Institute
- Latest Research Reports
- Opinion Leaders
Secondary Research
- Annual Reports
- White Paper
- Latest Press Release
- Industry Association
- Paid Database
- Investor Presentations

Step 4 - Data Triangulation
Involves using different sources of information in order to increase the validity of a study
These sources are likely to be stakeholders in a program - participants, other researchers, program staff, other community members, and so on.
Then we put all data in single framework & apply various statistical tools to find out the dynamic on the market.
During the analysis stage, feedback from the stakeholder groups would be compared to determine areas of agreement as well as areas of divergence