

Key Insights
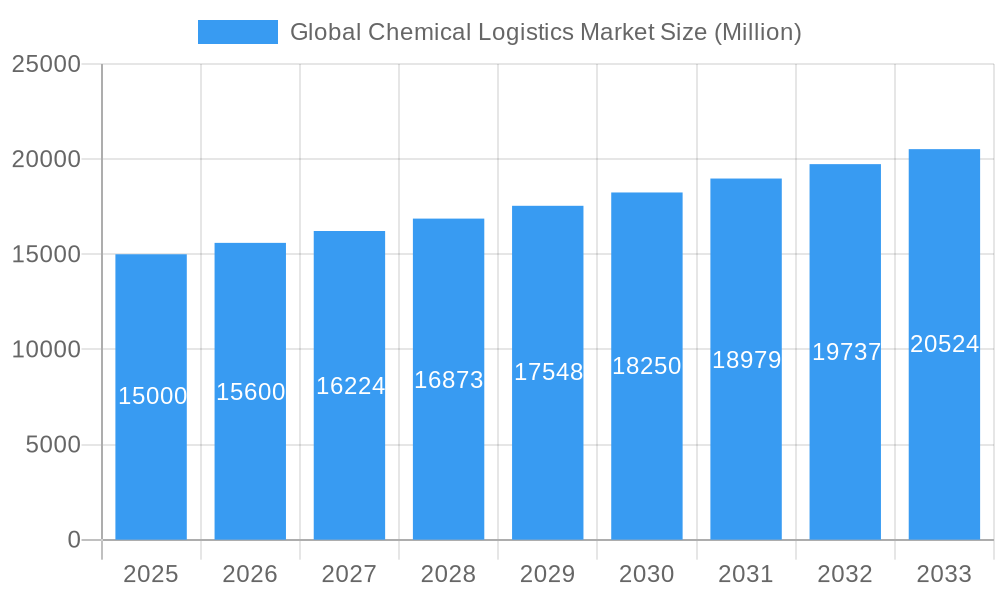
The global chemical logistics market is experiencing robust growth, driven by the expanding chemical industry and the increasing need for efficient and secure transportation and handling of hazardous materials. A compound annual growth rate (CAGR) exceeding 4.0% indicates a significant upward trajectory projected through 2033. Key market drivers include the rising demand for specialty chemicals, pharmaceuticals, and cosmetics, coupled with globalization and the expansion of e-commerce, necessitating sophisticated supply chain management. Growth is further fueled by advancements in technology, such as real-time tracking and predictive analytics, enhancing supply chain visibility and efficiency. The market is segmented by service (transportation, warehousing, distribution, inventory management, consulting, customs, green logistics, and others), mode of transportation (road, rail, air, water, pipeline), and end-user industry (pharmaceuticals, cosmetics, oil & gas, specialty chemicals, and others). While regulatory compliance and potential supply chain disruptions pose challenges, the overall market outlook remains positive.
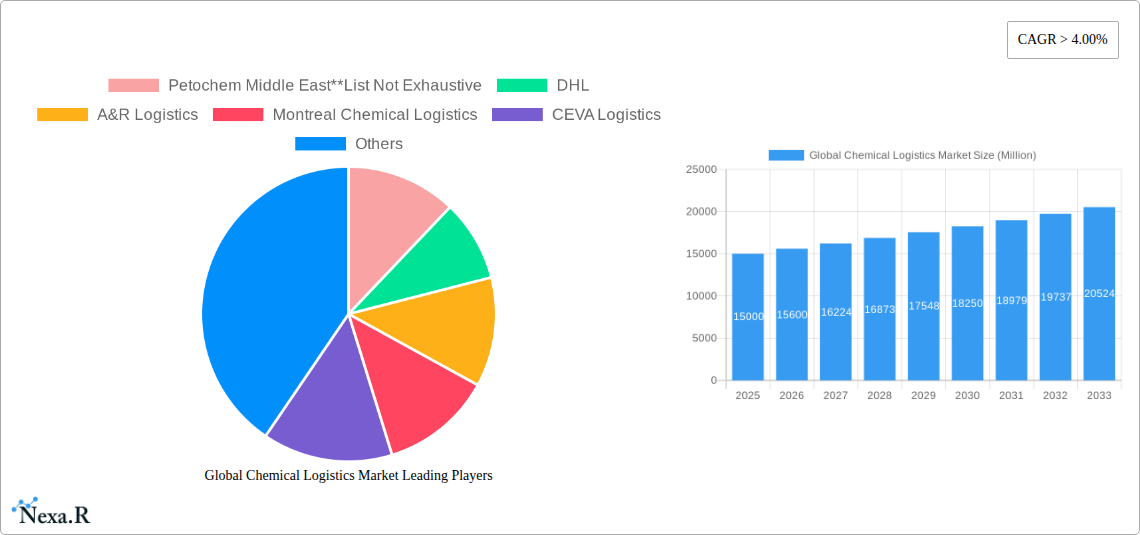
Global Chemical Logistics Market Market Size (In Billion)
The diverse range of services offered within chemical logistics highlights the market's complexity and sophistication. Roadways currently dominate the mode of transportation segment, but other modes are gaining traction based on specific chemical types and geographical considerations. North America and Europe currently hold significant market shares, but the Asia-Pacific region is projected to exhibit the fastest growth due to rapid industrialization and increasing manufacturing activities. Key players like DHL, CEVA Logistics, and others are competing through strategic partnerships, technological investments, and expansion into emerging markets. The market's future will depend on adapting to evolving environmental regulations (promoting green logistics), overcoming geopolitical uncertainties, and continuously improving the safety and efficiency of chemical handling and transportation across the globe. The integration of digital technologies, such as blockchain and AI, will further enhance transparency and security within chemical supply chains.
Global Chemical Logistics Market Company Market Share
Global Chemical Logistics Market Report: 2019-2033
This comprehensive report provides an in-depth analysis of the global chemical logistics market, encompassing market dynamics, growth trends, regional dominance, key players, and future outlook. With a study period spanning 2019-2033, a base year of 2025, and a forecast period of 2025-2033, this report is an essential resource for industry professionals, investors, and stakeholders seeking to understand and capitalize on the opportunities within this dynamic sector. The market is segmented by service (Transportation, Warehousing, Distribution & Inventory Management, Consulting & Management Services, Customs & Security, Green Logistics, Others), mode of transportation (Roadways, Railways, Airways, Waterways, Pipelines), and end-user (Pharmaceutical, Cosmetic, Oil & Gas, Specialty Chemicals, Other End Users).
Global Chemical Logistics Market Dynamics & Structure
The global chemical logistics market is characterized by a moderately concentrated landscape, with several large multinational players and a significant number of regional players. The market size in 2025 is estimated at $XXX million, with a projected CAGR of xx% during the forecast period. Technological innovation, particularly in areas like automation, data analytics, and sustainable logistics solutions, is a key driver. Stringent regulatory frameworks governing the transportation and handling of hazardous chemicals significantly influence market operations. The presence of competitive substitute transportation modes (e.g., using rail instead of road for certain chemicals) also impact market dynamics. End-user demographics, particularly the growth in specific industries like pharmaceuticals and specialty chemicals, directly impact demand. Furthermore, M&A activities have played a notable role in shaping the market structure. In the period 2019-2024, approximately xx M&A deals were recorded, representing a total value of $xx million.
- Market Concentration: Moderately concentrated, with top 5 players holding approximately xx% market share in 2025.
- Technological Innovation: Focus on automation (robotics, AI), data analytics for optimized routing and inventory management, and green logistics solutions (e.g., electric vehicles, alternative fuels)
- Regulatory Framework: Stringent regulations on hazardous material handling and transportation (e.g., GHS, ADR) impact operational costs and safety standards.
- Competitive Substitutes: Rail, waterway transport present alternatives for long-haul movements of bulk chemicals, impacting road transportation segment.
- End-User Demographics: Growth in pharmaceutical, specialty chemicals, and renewable energy sectors boosts demand for specialized chemical logistics services.
- M&A Trends: Consolidation through mergers and acquisitions among logistics providers to expand service portfolios and geographic reach.
Global Chemical Logistics Market Growth Trends & Insights
The global chemical logistics market has witnessed substantial growth during the historical period (2019-2024), driven by several factors. Increased globalization, expanding manufacturing bases in emerging economies, and the growing demand for specialized chemical products have contributed to market expansion. Technological advancements, such as the adoption of advanced tracking systems, real-time data analytics, and efficient route optimization software, are improving operational efficiency and reducing costs. The shift towards sustainable and environmentally friendly logistics practices is also influencing market growth. The adoption rate of green logistics solutions is expected to increase significantly in the forecast period, driven by regulatory pressure and growing environmental awareness among businesses. Consumer behavior shifts towards increased demand for specialized chemicals in various industries are impacting demand patterns. The market size is projected to reach $XXX million by 2033.
- Market Size Evolution: From $XXX million in 2019 to $XXX million in 2025, projected to reach $XXX million by 2033.
- CAGR: xx% during 2025-2033
- Market Penetration: xx% in 2025 for green logistics solutions, projected to reach xx% by 2033.
- Technological Disruptions: Increased use of IoT, blockchain, and AI for supply chain visibility and enhanced security.
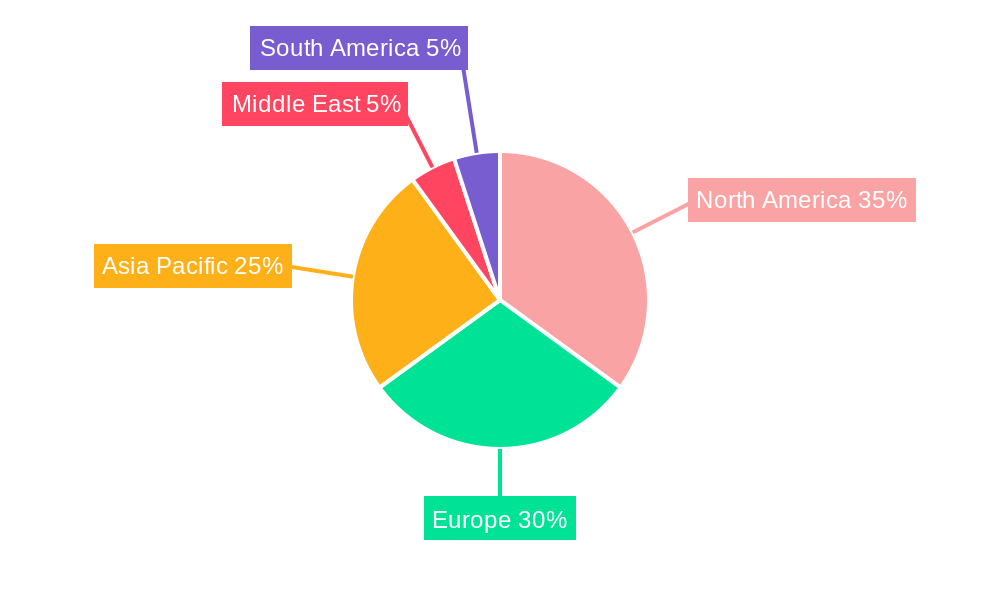
Dominant Regions, Countries, or Segments in Global Chemical Logistics Market
North America (particularly the United States) currently holds the largest market share in the global chemical logistics market, driven by strong industrial activity and well-established logistics infrastructure. Asia-Pacific is projected to experience the fastest growth during the forecast period, fueled by rapid industrialization and economic expansion in countries like China and India. Within the service segment, Transportation dominates, accounting for approximately xx% of the total market in 2025. Roadways remains the primary mode of transportation, holding around xx% of the market, followed by Railways and Waterways. The Pharmaceutical and Oil & Gas industries are the largest end-users.
- North America: High industrial activity and advanced infrastructure drive market leadership.
- Asia-Pacific: Rapid industrialization and economic growth fuel high growth potential.
- Europe: Established chemical industry and robust regulations influence market dynamics.
- Transportation Segment Dominance: Largest segment driven by high demand for chemical transportation services.
- Roadways Mode of Transportation: The primary mode due to extensive road networks and flexibility.
- Pharmaceutical and Oil & Gas Industries: Largest end-users due to substantial chemical handling needs.
Global Chemical Logistics Market Product Landscape
The chemical logistics market offers a wide range of services, ranging from basic transportation and warehousing to specialized handling of hazardous materials, customized supply chain solutions, and consulting services. Recent innovations focus on improving safety, efficiency, and sustainability. For example, there's increasing adoption of real-time tracking technologies, specialized containers for hazardous chemicals, and optimized route planning software. The unique selling propositions of many players are their specialized expertise in handling specific types of chemicals, ensuring regulatory compliance, and their focus on supply chain optimization.
Key Drivers, Barriers & Challenges in Global Chemical Logistics Market
Key Drivers: Growing global trade, expansion of chemical manufacturing in emerging economies, increasing demand for specialized chemical logistics services, technological advancements (e.g., IoT, AI), and government initiatives promoting efficient supply chains.
Challenges & Restraints: Fluctuations in fuel prices significantly impacting transportation costs, stringent regulatory requirements related to hazardous materials, supply chain disruptions (e.g., geopolitical events, port congestion), and intense competition among logistics providers leading to price wars. These challenges can cumulatively reduce profitability by approximately xx% annually for smaller players.
Emerging Opportunities in Global Chemical Logistics Market
Emerging opportunities lie in the growing adoption of green logistics solutions, focusing on reducing environmental impact through sustainable practices and technology. The increasing demand for specialized handling of high-value chemical products presents another opportunity. Further expansion into untapped markets (e.g., Africa, Latin America) holds significant potential. Innovations in supply chain management technology offer opportunities for enhanced efficiency and transparency.
Growth Accelerators in the Global Chemical Logistics Market Industry
Long-term growth will be propelled by technological advancements such as AI-powered optimization systems and the increasing adoption of blockchain for enhanced supply chain transparency and security. Strategic partnerships among logistics providers and chemical manufacturers will improve operational efficiency. Expanding into new geographic markets and diversification into related services (e.g., chemical waste management) will contribute to long-term growth.
Key Players Shaping the Global Chemical Logistics Market Market
- Petochem Middle East
- DHL
- A&R Logistics
- Montreal Chemical Logistics
- CEVA Logistics
- Al-Futtaim Logistics
- Agility Logistics
- BDP International
- C.H. Robinson
- Rhenus Logistics
Notable Milestones in Global Chemical Logistics Market Sector
- 2021-Q4: DHL launched a new carbon-neutral shipping option for chemical products.
- 2022-Q2: CEVA Logistics acquired a smaller regional chemical logistics firm, expanding its network.
- 2023-Q1: Several major players invested significantly in AI-powered route optimization systems.
In-Depth Global Chemical Logistics Market Market Outlook
The future of the global chemical logistics market is bright, driven by sustained growth in the chemical industry, technological advancements enhancing efficiency and sustainability, and increasing globalization. Strategic partnerships, expansion into emerging markets, and the development of innovative supply chain solutions will provide ample opportunities for growth and profitability. Companies focusing on resilience, flexibility, and green practices are best positioned to succeed in this evolving landscape.
Global Chemical Logistics Market Segmentation
-
1. Service
- 1.1. Transportation
- 1.2. Warehous
- 1.3. Consulting & Management Services
- 1.4. Customs & Security
- 1.5. Green Logistics
- 1.6. Others
-
2. Mode of Transportation
- 2.1. Roadways
- 2.2. Railways
- 2.3. Airways
- 2.4. Waterways
- 2.5. Pipelines
-
3. End User
- 3.1. Pharmaceutical Industry
- 3.2. Cosmetic Industry
- 3.3. Oil and Gas Industry
- 3.4. Specialty Chemicals Industry
- 3.5. Other End Users
Global Chemical Logistics Market Segmentation By Geography
-
1. North America
- 1.1. United States
- 1.2. Canada
- 1.3. Mexico
-
2. Europe
- 2.1. Germany
- 2.2. France
- 2.3. United Kingdom
- 2.4. Italy
- 2.5. Spain
- 2.6. Russia
- 2.7. Rest of Europe
-
3. Asia Pacific
- 3.1. China
- 3.2. Japan
- 3.3. India
- 3.4. Bangladesh
- 3.5. Turkey
- 3.6. South Korea
- 3.7. Australia
- 3.8. Indonesia
- 3.9. Rest of Asia Pacific
- 4. Middle East
-
5. Egypt
- 5.1. South Africa
- 5.2. Saudi Arabia
- 5.3. Rest of Middle East
-
6. South America
- 6.1. Brazil
- 6.2. Argentina
- 6.3. Rest of South America
Global Chemical Logistics Market Regional Market Share
Geographic Coverage of Global Chemical Logistics Market
Global Chemical Logistics Market REPORT HIGHLIGHTS
| Aspects | Details |
|---|---|
| Study Period | 2020-2034 |
| Base Year | 2025 |
| Estimated Year | 2026 |
| Forecast Period | 2026-2034 |
| Historical Period | 2020-2025 |
| Growth Rate | CAGR of 5.2% from 2020-2034 |
| Segmentation |
|
Table of Contents
- 1. Introduction
- 1.1. Research Scope
- 1.2. Market Segmentation
- 1.3. Research Objective
- 1.4. Definitions and Assumptions
- 2. Executive Summary
- 2.1. Market Snapshot
- 3. Market Dynamics
- 3.1. Market Drivers
- 3.2. Market Restrains
- 3.3. Market Trends
- 3.4. Market Opportunities
- 4. Market Factor Analysis
- 4.1. Porters Five Forces
- 4.1.1. Bargaining Power of Suppliers
- 4.1.2. Bargaining Power of Buyers
- 4.1.3. Threat of New Entrants
- 4.1.4. Threat of Substitutes
- 4.1.5. Competitive Rivalry
- 4.2. PESTEL analysis
- 4.3. BCG Analysis
- 4.3.1. Stars (High Growth, High Market Share)
- 4.3.2. Cash Cows (Low Growth, High Market Share)
- 4.3.3. Question Mark (High Growth, Low Market Share)
- 4.3.4. Dogs (Low Growth, Low Market Share)
- 4.4. Ansoff Matrix Analysis
- 4.5. Supply Chain Analysis
- 4.6. Regulatory Landscape
- 4.7. Current Market Potential and Opportunity Assessment (TAM–SAM–SOM Framework)
- 4.8. NRP Analyst Note
- 4.1. Porters Five Forces
- 5. Market Analysis, Insights and Forecast 2021-2033
- 5.1. Market Analysis, Insights and Forecast - by Service
- 5.1.1. Transportation
- 5.1.2. Warehous
- 5.1.3. Consulting & Management Services
- 5.1.4. Customs & Security
- 5.1.5. Green Logistics
- 5.1.6. Others
- 5.2. Market Analysis, Insights and Forecast - by Mode of Transportation
- 5.2.1. Roadways
- 5.2.2. Railways
- 5.2.3. Airways
- 5.2.4. Waterways
- 5.2.5. Pipelines
- 5.3. Market Analysis, Insights and Forecast - by End User
- 5.3.1. Pharmaceutical Industry
- 5.3.2. Cosmetic Industry
- 5.3.3. Oil and Gas Industry
- 5.3.4. Specialty Chemicals Industry
- 5.3.5. Other End Users
- 5.4. Market Analysis, Insights and Forecast - by Region
- 5.4.1. North America
- 5.4.2. Europe
- 5.4.3. Asia Pacific
- 5.4.4. Middle East
- 5.4.5. Egypt
- 5.4.6. South America
- 5.1. Market Analysis, Insights and Forecast - by Service
- 6. Global Chemical Logistics Market Analysis, Insights and Forecast, 2021-2033
- 6.1. Market Analysis, Insights and Forecast - by Service
- 6.1.1. Transportation
- 6.1.2. Warehous
- 6.1.3. Consulting & Management Services
- 6.1.4. Customs & Security
- 6.1.5. Green Logistics
- 6.1.6. Others
- 6.2. Market Analysis, Insights and Forecast - by Mode of Transportation
- 6.2.1. Roadways
- 6.2.2. Railways
- 6.2.3. Airways
- 6.2.4. Waterways
- 6.2.5. Pipelines
- 6.3. Market Analysis, Insights and Forecast - by End User
- 6.3.1. Pharmaceutical Industry
- 6.3.2. Cosmetic Industry
- 6.3.3. Oil and Gas Industry
- 6.3.4. Specialty Chemicals Industry
- 6.3.5. Other End Users
- 6.1. Market Analysis, Insights and Forecast - by Service
- 7. North America Global Chemical Logistics Market Analysis, Insights and Forecast, 2020-2032
- 7.1. Market Analysis, Insights and Forecast - by Service
- 7.1.1. Transportation
- 7.1.2. Warehous
- 7.1.3. Consulting & Management Services
- 7.1.4. Customs & Security
- 7.1.5. Green Logistics
- 7.1.6. Others
- 7.2. Market Analysis, Insights and Forecast - by Mode of Transportation
- 7.2.1. Roadways
- 7.2.2. Railways
- 7.2.3. Airways
- 7.2.4. Waterways
- 7.2.5. Pipelines
- 7.3. Market Analysis, Insights and Forecast - by End User
- 7.3.1. Pharmaceutical Industry
- 7.3.2. Cosmetic Industry
- 7.3.3. Oil and Gas Industry
- 7.3.4. Specialty Chemicals Industry
- 7.3.5. Other End Users
- 7.1. Market Analysis, Insights and Forecast - by Service
- 8. Europe Global Chemical Logistics Market Analysis, Insights and Forecast, 2020-2032
- 8.1. Market Analysis, Insights and Forecast - by Service
- 8.1.1. Transportation
- 8.1.2. Warehous
- 8.1.3. Consulting & Management Services
- 8.1.4. Customs & Security
- 8.1.5. Green Logistics
- 8.1.6. Others
- 8.2. Market Analysis, Insights and Forecast - by Mode of Transportation
- 8.2.1. Roadways
- 8.2.2. Railways
- 8.2.3. Airways
- 8.2.4. Waterways
- 8.2.5. Pipelines
- 8.3. Market Analysis, Insights and Forecast - by End User
- 8.3.1. Pharmaceutical Industry
- 8.3.2. Cosmetic Industry
- 8.3.3. Oil and Gas Industry
- 8.3.4. Specialty Chemicals Industry
- 8.3.5. Other End Users
- 8.1. Market Analysis, Insights and Forecast - by Service
- 9. Asia Pacific Global Chemical Logistics Market Analysis, Insights and Forecast, 2020-2032
- 9.1. Market Analysis, Insights and Forecast - by Service
- 9.1.1. Transportation
- 9.1.2. Warehous
- 9.1.3. Consulting & Management Services
- 9.1.4. Customs & Security
- 9.1.5. Green Logistics
- 9.1.6. Others
- 9.2. Market Analysis, Insights and Forecast - by Mode of Transportation
- 9.2.1. Roadways
- 9.2.2. Railways
- 9.2.3. Airways
- 9.2.4. Waterways
- 9.2.5. Pipelines
- 9.3. Market Analysis, Insights and Forecast - by End User
- 9.3.1. Pharmaceutical Industry
- 9.3.2. Cosmetic Industry
- 9.3.3. Oil and Gas Industry
- 9.3.4. Specialty Chemicals Industry
- 9.3.5. Other End Users
- 9.1. Market Analysis, Insights and Forecast - by Service
- 10. Middle East Global Chemical Logistics Market Analysis, Insights and Forecast, 2020-2032
- 10.1. Market Analysis, Insights and Forecast - by Service
- 10.1.1. Transportation
- 10.1.2. Warehous
- 10.1.3. Consulting & Management Services
- 10.1.4. Customs & Security
- 10.1.5. Green Logistics
- 10.1.6. Others
- 10.2. Market Analysis, Insights and Forecast - by Mode of Transportation
- 10.2.1. Roadways
- 10.2.2. Railways
- 10.2.3. Airways
- 10.2.4. Waterways
- 10.2.5. Pipelines
- 10.3. Market Analysis, Insights and Forecast - by End User
- 10.3.1. Pharmaceutical Industry
- 10.3.2. Cosmetic Industry
- 10.3.3. Oil and Gas Industry
- 10.3.4. Specialty Chemicals Industry
- 10.3.5. Other End Users
- 10.1. Market Analysis, Insights and Forecast - by Service
- 11. Egypt Global Chemical Logistics Market Analysis, Insights and Forecast, 2020-2032
- 11.1. Market Analysis, Insights and Forecast - by Service
- 11.1.1. Transportation
- 11.1.2. Warehous
- 11.1.3. Consulting & Management Services
- 11.1.4. Customs & Security
- 11.1.5. Green Logistics
- 11.1.6. Others
- 11.2. Market Analysis, Insights and Forecast - by Mode of Transportation
- 11.2.1. Roadways
- 11.2.2. Railways
- 11.2.3. Airways
- 11.2.4. Waterways
- 11.2.5. Pipelines
- 11.3. Market Analysis, Insights and Forecast - by End User
- 11.3.1. Pharmaceutical Industry
- 11.3.2. Cosmetic Industry
- 11.3.3. Oil and Gas Industry
- 11.3.4. Specialty Chemicals Industry
- 11.3.5. Other End Users
- 11.1. Market Analysis, Insights and Forecast - by Service
- 12. South America Global Chemical Logistics Market Analysis, Insights and Forecast, 2020-2032
- 12.1. Market Analysis, Insights and Forecast - by Service
- 12.1.1. Transportation
- 12.1.2. Warehous
- 12.1.3. Consulting & Management Services
- 12.1.4. Customs & Security
- 12.1.5. Green Logistics
- 12.1.6. Others
- 12.2. Market Analysis, Insights and Forecast - by Mode of Transportation
- 12.2.1. Roadways
- 12.2.2. Railways
- 12.2.3. Airways
- 12.2.4. Waterways
- 12.2.5. Pipelines
- 12.3. Market Analysis, Insights and Forecast - by End User
- 12.3.1. Pharmaceutical Industry
- 12.3.2. Cosmetic Industry
- 12.3.3. Oil and Gas Industry
- 12.3.4. Specialty Chemicals Industry
- 12.3.5. Other End Users
- 12.1. Market Analysis, Insights and Forecast - by Service
- 13. Competitive Analysis
- 13.1. Company Profiles
- 13.1.1 Petochem Middle East**List Not Exhaustive
- 13.1.1.1. Company Overview
- 13.1.1.2. Products
- 13.1.1.3. Company Financials
- 13.1.1.4. SWOT Analysis
- 13.1.2 DHL
- 13.1.2.1. Company Overview
- 13.1.2.2. Products
- 13.1.2.3. Company Financials
- 13.1.2.4. SWOT Analysis
- 13.1.3 A&R Logistics
- 13.1.3.1. Company Overview
- 13.1.3.2. Products
- 13.1.3.3. Company Financials
- 13.1.3.4. SWOT Analysis
- 13.1.4 Montreal Chemical Logistics
- 13.1.4.1. Company Overview
- 13.1.4.2. Products
- 13.1.4.3. Company Financials
- 13.1.4.4. SWOT Analysis
- 13.1.5 CEVA Logistics
- 13.1.5.1. Company Overview
- 13.1.5.2. Products
- 13.1.5.3. Company Financials
- 13.1.5.4. SWOT Analysis
- 13.1.6 Al-Futtaim Logistics
- 13.1.6.1. Company Overview
- 13.1.6.2. Products
- 13.1.6.3. Company Financials
- 13.1.6.4. SWOT Analysis
- 13.1.7 Agility Logistics
- 13.1.7.1. Company Overview
- 13.1.7.2. Products
- 13.1.7.3. Company Financials
- 13.1.7.4. SWOT Analysis
- 13.1.8 BDP International
- 13.1.8.1. Company Overview
- 13.1.8.2. Products
- 13.1.8.3. Company Financials
- 13.1.8.4. SWOT Analysis
- 13.1.9 C H Robinson
- 13.1.9.1. Company Overview
- 13.1.9.2. Products
- 13.1.9.3. Company Financials
- 13.1.9.4. SWOT Analysis
- 13.1.10 Rhenus Logistics
- 13.1.10.1. Company Overview
- 13.1.10.2. Products
- 13.1.10.3. Company Financials
- 13.1.10.4. SWOT Analysis
- 13.1.1 Petochem Middle East**List Not Exhaustive
- 13.2. Market Entropy
- 13.2.1 Company's Key Areas Served
- 13.2.2 Recent Developments
- 13.3. Company Market Share Analysis 2025
- 13.3.1 Top 5 Companies Market Share Analysis
- 13.3.2 Top 3 Companies Market Share Analysis
- 13.4. List of Potential Customers
- 14. Research Methodology
List of Figures
- Figure 1: Global Global Chemical Logistics Market Revenue Breakdown (billion, %) by Region 2025 & 2033
- Figure 2: North America Global Chemical Logistics Market Revenue (billion), by Service 2025 & 2033
- Figure 3: North America Global Chemical Logistics Market Revenue Share (%), by Service 2025 & 2033
- Figure 4: North America Global Chemical Logistics Market Revenue (billion), by Mode of Transportation 2025 & 2033
- Figure 5: North America Global Chemical Logistics Market Revenue Share (%), by Mode of Transportation 2025 & 2033
- Figure 6: North America Global Chemical Logistics Market Revenue (billion), by End User 2025 & 2033
- Figure 7: North America Global Chemical Logistics Market Revenue Share (%), by End User 2025 & 2033
- Figure 8: North America Global Chemical Logistics Market Revenue (billion), by Country 2025 & 2033
- Figure 9: North America Global Chemical Logistics Market Revenue Share (%), by Country 2025 & 2033
- Figure 10: Europe Global Chemical Logistics Market Revenue (billion), by Service 2025 & 2033
- Figure 11: Europe Global Chemical Logistics Market Revenue Share (%), by Service 2025 & 2033
- Figure 12: Europe Global Chemical Logistics Market Revenue (billion), by Mode of Transportation 2025 & 2033
- Figure 13: Europe Global Chemical Logistics Market Revenue Share (%), by Mode of Transportation 2025 & 2033
- Figure 14: Europe Global Chemical Logistics Market Revenue (billion), by End User 2025 & 2033
- Figure 15: Europe Global Chemical Logistics Market Revenue Share (%), by End User 2025 & 2033
- Figure 16: Europe Global Chemical Logistics Market Revenue (billion), by Country 2025 & 2033
- Figure 17: Europe Global Chemical Logistics Market Revenue Share (%), by Country 2025 & 2033
- Figure 18: Asia Pacific Global Chemical Logistics Market Revenue (billion), by Service 2025 & 2033
- Figure 19: Asia Pacific Global Chemical Logistics Market Revenue Share (%), by Service 2025 & 2033
- Figure 20: Asia Pacific Global Chemical Logistics Market Revenue (billion), by Mode of Transportation 2025 & 2033
- Figure 21: Asia Pacific Global Chemical Logistics Market Revenue Share (%), by Mode of Transportation 2025 & 2033
- Figure 22: Asia Pacific Global Chemical Logistics Market Revenue (billion), by End User 2025 & 2033
- Figure 23: Asia Pacific Global Chemical Logistics Market Revenue Share (%), by End User 2025 & 2033
- Figure 24: Asia Pacific Global Chemical Logistics Market Revenue (billion), by Country 2025 & 2033
- Figure 25: Asia Pacific Global Chemical Logistics Market Revenue Share (%), by Country 2025 & 2033
- Figure 26: Middle East Global Chemical Logistics Market Revenue (billion), by Service 2025 & 2033
- Figure 27: Middle East Global Chemical Logistics Market Revenue Share (%), by Service 2025 & 2033
- Figure 28: Middle East Global Chemical Logistics Market Revenue (billion), by Mode of Transportation 2025 & 2033
- Figure 29: Middle East Global Chemical Logistics Market Revenue Share (%), by Mode of Transportation 2025 & 2033
- Figure 30: Middle East Global Chemical Logistics Market Revenue (billion), by End User 2025 & 2033
- Figure 31: Middle East Global Chemical Logistics Market Revenue Share (%), by End User 2025 & 2033
- Figure 32: Middle East Global Chemical Logistics Market Revenue (billion), by Country 2025 & 2033
- Figure 33: Middle East Global Chemical Logistics Market Revenue Share (%), by Country 2025 & 2033
- Figure 34: Egypt Global Chemical Logistics Market Revenue (billion), by Service 2025 & 2033
- Figure 35: Egypt Global Chemical Logistics Market Revenue Share (%), by Service 2025 & 2033
- Figure 36: Egypt Global Chemical Logistics Market Revenue (billion), by Mode of Transportation 2025 & 2033
- Figure 37: Egypt Global Chemical Logistics Market Revenue Share (%), by Mode of Transportation 2025 & 2033
- Figure 38: Egypt Global Chemical Logistics Market Revenue (billion), by End User 2025 & 2033
- Figure 39: Egypt Global Chemical Logistics Market Revenue Share (%), by End User 2025 & 2033
- Figure 40: Egypt Global Chemical Logistics Market Revenue (billion), by Country 2025 & 2033
- Figure 41: Egypt Global Chemical Logistics Market Revenue Share (%), by Country 2025 & 2033
- Figure 42: South America Global Chemical Logistics Market Revenue (billion), by Service 2025 & 2033
- Figure 43: South America Global Chemical Logistics Market Revenue Share (%), by Service 2025 & 2033
- Figure 44: South America Global Chemical Logistics Market Revenue (billion), by Mode of Transportation 2025 & 2033
- Figure 45: South America Global Chemical Logistics Market Revenue Share (%), by Mode of Transportation 2025 & 2033
- Figure 46: South America Global Chemical Logistics Market Revenue (billion), by End User 2025 & 2033
- Figure 47: South America Global Chemical Logistics Market Revenue Share (%), by End User 2025 & 2033
- Figure 48: South America Global Chemical Logistics Market Revenue (billion), by Country 2025 & 2033
- Figure 49: South America Global Chemical Logistics Market Revenue Share (%), by Country 2025 & 2033
List of Tables
- Table 1: Global Chemical Logistics Market Revenue billion Forecast, by Service 2020 & 2033
- Table 2: Global Chemical Logistics Market Revenue billion Forecast, by Mode of Transportation 2020 & 2033
- Table 3: Global Chemical Logistics Market Revenue billion Forecast, by End User 2020 & 2033
- Table 4: Global Chemical Logistics Market Revenue billion Forecast, by Region 2020 & 2033
- Table 5: Global Chemical Logistics Market Revenue billion Forecast, by Service 2020 & 2033
- Table 6: Global Chemical Logistics Market Revenue billion Forecast, by Mode of Transportation 2020 & 2033
- Table 7: Global Chemical Logistics Market Revenue billion Forecast, by End User 2020 & 2033
- Table 8: Global Chemical Logistics Market Revenue billion Forecast, by Country 2020 & 2033
- Table 9: United States Global Chemical Logistics Market Revenue (billion) Forecast, by Application 2020 & 2033
- Table 10: Canada Global Chemical Logistics Market Revenue (billion) Forecast, by Application 2020 & 2033
- Table 11: Mexico Global Chemical Logistics Market Revenue (billion) Forecast, by Application 2020 & 2033
- Table 12: Global Chemical Logistics Market Revenue billion Forecast, by Service 2020 & 2033
- Table 13: Global Chemical Logistics Market Revenue billion Forecast, by Mode of Transportation 2020 & 2033
- Table 14: Global Chemical Logistics Market Revenue billion Forecast, by End User 2020 & 2033
- Table 15: Global Chemical Logistics Market Revenue billion Forecast, by Country 2020 & 2033
- Table 16: Germany Global Chemical Logistics Market Revenue (billion) Forecast, by Application 2020 & 2033
- Table 17: France Global Chemical Logistics Market Revenue (billion) Forecast, by Application 2020 & 2033
- Table 18: United Kingdom Global Chemical Logistics Market Revenue (billion) Forecast, by Application 2020 & 2033
- Table 19: Italy Global Chemical Logistics Market Revenue (billion) Forecast, by Application 2020 & 2033
- Table 20: Spain Global Chemical Logistics Market Revenue (billion) Forecast, by Application 2020 & 2033
- Table 21: Russia Global Chemical Logistics Market Revenue (billion) Forecast, by Application 2020 & 2033
- Table 22: Rest of Europe Global Chemical Logistics Market Revenue (billion) Forecast, by Application 2020 & 2033
- Table 23: Global Chemical Logistics Market Revenue billion Forecast, by Service 2020 & 2033
- Table 24: Global Chemical Logistics Market Revenue billion Forecast, by Mode of Transportation 2020 & 2033
- Table 25: Global Chemical Logistics Market Revenue billion Forecast, by End User 2020 & 2033
- Table 26: Global Chemical Logistics Market Revenue billion Forecast, by Country 2020 & 2033
- Table 27: China Global Chemical Logistics Market Revenue (billion) Forecast, by Application 2020 & 2033
- Table 28: Japan Global Chemical Logistics Market Revenue (billion) Forecast, by Application 2020 & 2033
- Table 29: India Global Chemical Logistics Market Revenue (billion) Forecast, by Application 2020 & 2033
- Table 30: Bangladesh Global Chemical Logistics Market Revenue (billion) Forecast, by Application 2020 & 2033
- Table 31: Turkey Global Chemical Logistics Market Revenue (billion) Forecast, by Application 2020 & 2033
- Table 32: South Korea Global Chemical Logistics Market Revenue (billion) Forecast, by Application 2020 & 2033
- Table 33: Australia Global Chemical Logistics Market Revenue (billion) Forecast, by Application 2020 & 2033
- Table 34: Indonesia Global Chemical Logistics Market Revenue (billion) Forecast, by Application 2020 & 2033
- Table 35: Rest of Asia Pacific Global Chemical Logistics Market Revenue (billion) Forecast, by Application 2020 & 2033
- Table 36: Global Chemical Logistics Market Revenue billion Forecast, by Service 2020 & 2033
- Table 37: Global Chemical Logistics Market Revenue billion Forecast, by Mode of Transportation 2020 & 2033
- Table 38: Global Chemical Logistics Market Revenue billion Forecast, by End User 2020 & 2033
- Table 39: Global Chemical Logistics Market Revenue billion Forecast, by Country 2020 & 2033
- Table 40: Global Chemical Logistics Market Revenue billion Forecast, by Service 2020 & 2033
- Table 41: Global Chemical Logistics Market Revenue billion Forecast, by Mode of Transportation 2020 & 2033
- Table 42: Global Chemical Logistics Market Revenue billion Forecast, by End User 2020 & 2033
- Table 43: Global Chemical Logistics Market Revenue billion Forecast, by Country 2020 & 2033
- Table 44: South Africa Global Chemical Logistics Market Revenue (billion) Forecast, by Application 2020 & 2033
- Table 45: Saudi Arabia Global Chemical Logistics Market Revenue (billion) Forecast, by Application 2020 & 2033
- Table 46: Rest of Middle East Global Chemical Logistics Market Revenue (billion) Forecast, by Application 2020 & 2033
- Table 47: Global Chemical Logistics Market Revenue billion Forecast, by Service 2020 & 2033
- Table 48: Global Chemical Logistics Market Revenue billion Forecast, by Mode of Transportation 2020 & 2033
- Table 49: Global Chemical Logistics Market Revenue billion Forecast, by End User 2020 & 2033
- Table 50: Global Chemical Logistics Market Revenue billion Forecast, by Country 2020 & 2033
- Table 51: Brazil Global Chemical Logistics Market Revenue (billion) Forecast, by Application 2020 & 2033
- Table 52: Argentina Global Chemical Logistics Market Revenue (billion) Forecast, by Application 2020 & 2033
- Table 53: Rest of South America Global Chemical Logistics Market Revenue (billion) Forecast, by Application 2020 & 2033
Frequently Asked Questions
1. What is the projected Compound Annual Growth Rate (CAGR) of the Global Chemical Logistics Market?
The projected CAGR is approximately 5.2%.
2. Which companies are prominent players in the Global Chemical Logistics Market?
Key companies in the market include Petochem Middle East**List Not Exhaustive, DHL, A&R Logistics, Montreal Chemical Logistics, CEVA Logistics, Al-Futtaim Logistics, Agility Logistics, BDP International, C H Robinson, Rhenus Logistics.
3. What are the main segments of the Global Chemical Logistics Market?
The market segments include Service, Mode of Transportation, End User.
4. Can you provide details about the market size?
The market size is estimated to be USD 300.5 billion as of 2022.
5. What are some drivers contributing to market growth?
Growing Events in E-commerce Sector; Increasing Demand for Qualified Event Logistics Services.
6. What are the notable trends driving market growth?
Chemical Sector Significant Expansion Driving the market.
7. Are there any restraints impacting market growth?
High Labour Cost; High Pricing.
8. Can you provide examples of recent developments in the market?
N/A
9. What pricing options are available for accessing the report?
Pricing options include single-user, multi-user, and enterprise licenses priced at USD 4750, USD 5250, and USD 8750 respectively.
10. Is the market size provided in terms of value or volume?
The market size is provided in terms of value, measured in billion.
11. Are there any specific market keywords associated with the report?
Yes, the market keyword associated with the report is "Global Chemical Logistics Market," which aids in identifying and referencing the specific market segment covered.
12. How do I determine which pricing option suits my needs best?
The pricing options vary based on user requirements and access needs. Individual users may opt for single-user licenses, while businesses requiring broader access may choose multi-user or enterprise licenses for cost-effective access to the report.
13. Are there any additional resources or data provided in the Global Chemical Logistics Market report?
While the report offers comprehensive insights, it's advisable to review the specific contents or supplementary materials provided to ascertain if additional resources or data are available.
14. How can I stay updated on further developments or reports in the Global Chemical Logistics Market?
To stay informed about further developments, trends, and reports in the Global Chemical Logistics Market, consider subscribing to industry newsletters, following relevant companies and organizations, or regularly checking reputable industry news sources and publications.
Methodology
Step 1 - Identification of Relevant Samples Size from Population Database


Step 2 - Approaches for Defining Global Market Size (Value, Volume* & Price*)

Note*: In applicable scenarios
Step 3 - Data Sources
Primary Research
- Web Analytics
- Survey Reports
- Research Institute
- Latest Research Reports
- Opinion Leaders
Secondary Research
- Annual Reports
- White Paper
- Latest Press Release
- Industry Association
- Paid Database
- Investor Presentations

Step 4 - Data Triangulation
Involves using different sources of information in order to increase the validity of a study
These sources are likely to be stakeholders in a program - participants, other researchers, program staff, other community members, and so on.
Then we put all data in single framework & apply various statistical tools to find out the dynamic on the market.
During the analysis stage, feedback from the stakeholder groups would be compared to determine areas of agreement as well as areas of divergence