

Key Insights
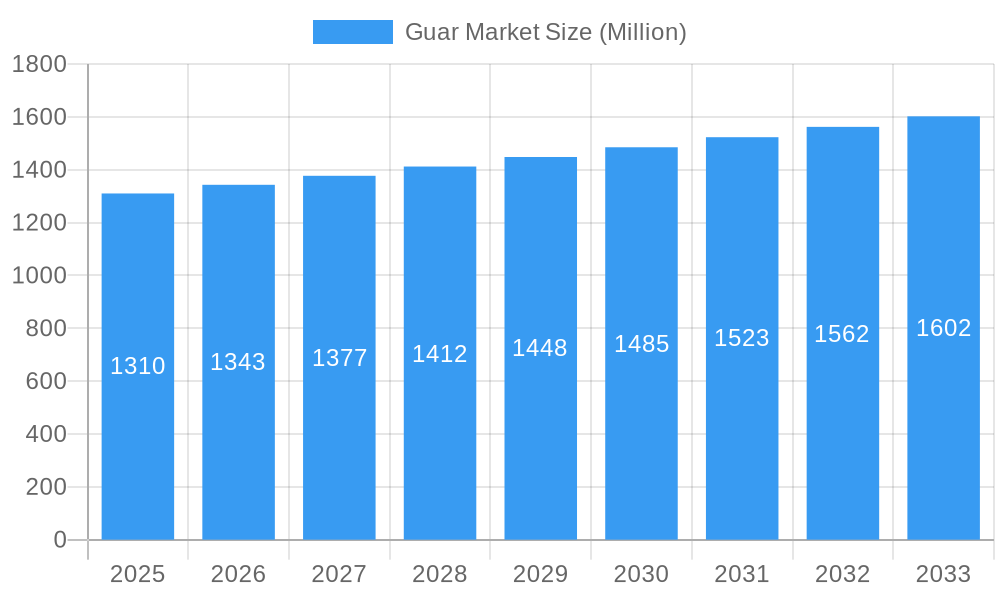
The global guar market, valued at $1.31 billion in 2025, is projected to experience steady growth, driven by increasing demand across diverse sectors. The Compound Annual Growth Rate (CAGR) of 2.60% from 2025 to 2033 indicates a consistent, albeit moderate, expansion. Key drivers include the growing use of guar gum as a thickening and stabilizing agent in the food industry, its importance in hydraulic fracturing operations within the oil and gas sector, and its application as a binder in paper manufacturing. Furthermore, the pharmaceutical industry's utilization of guar gum as an excipient contributes significantly to market growth. While the market faces certain restraints, such as price volatility linked to agricultural production and the emergence of substitute materials, the ongoing diversification of applications and exploration of novel uses are expected to mitigate these challenges. The segmentation of the market into guar gum and guar meal, along with its diverse applications across various industries, offers multiple avenues for growth. Leading players like Noble Commodities, SunGum Global, and Galaxy Gum are actively shaping market dynamics through innovation and expansion strategies. Regional analysis reveals significant contributions from North America, Asia Pacific, and Europe, with each region exhibiting unique growth trajectories influenced by factors such as industrial activity, regulatory landscapes, and consumer preferences.
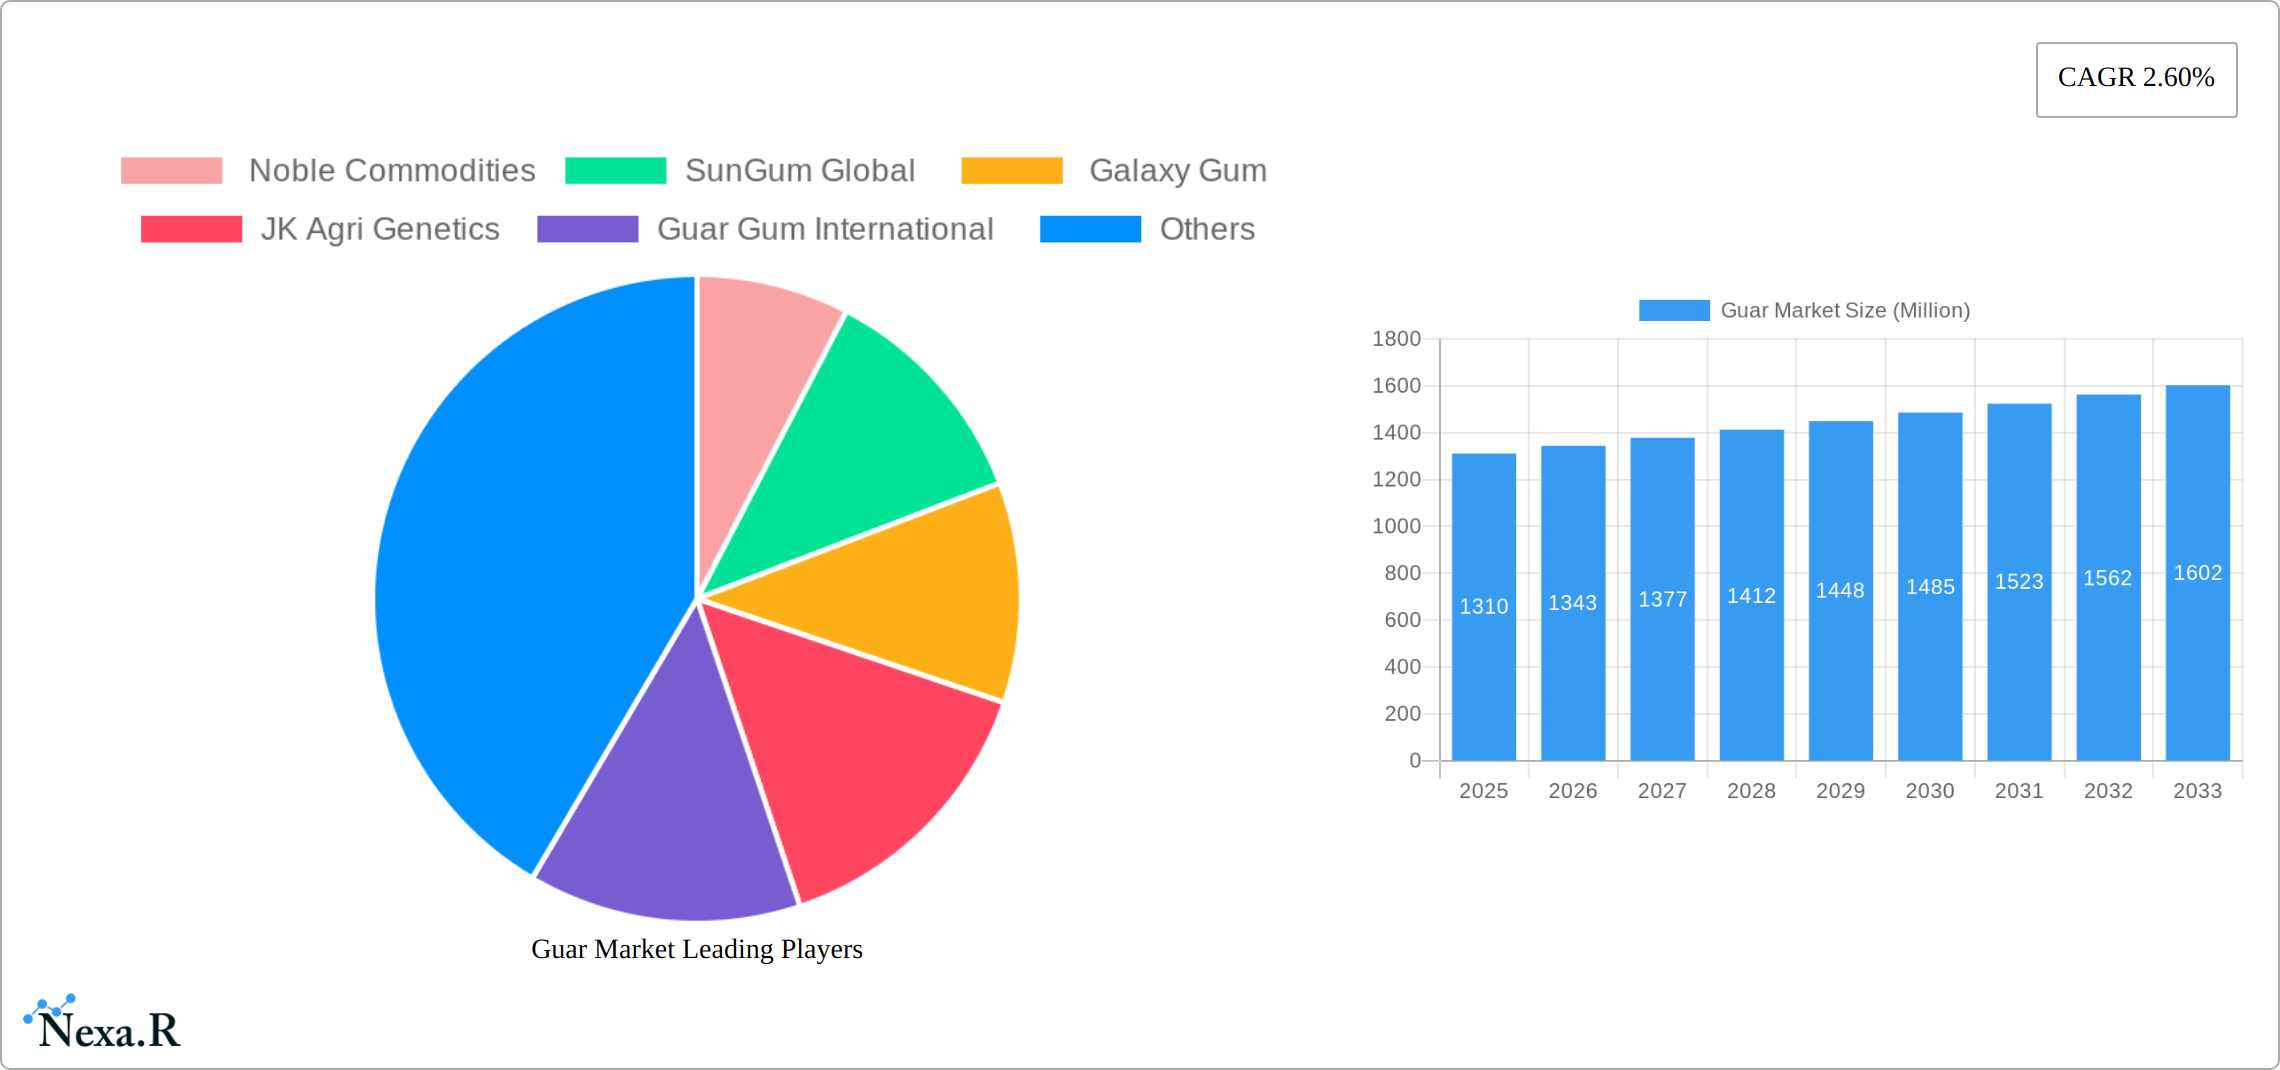
Guar Market Market Size (In Billion)
The forecast period (2025-2033) suggests a continued upward trend, albeit at a moderate pace, highlighting the market's stability and resilience. Growth is likely to be influenced by advancements in guar gum processing technologies leading to higher quality and efficiency. Furthermore, the increasing emphasis on sustainable and natural ingredients in various industries offers significant opportunities. However, the market is expected to continue navigating challenges related to supply chain management and fluctuating raw material costs. Successful players will be those who effectively manage these challenges and adapt to evolving industry trends, focusing on value-added products and strategic partnerships across the value chain. The long-term outlook for the guar market remains positive, fueled by its versatile nature and continued adoption across a range of applications.
Guar Market Company Market Share
Guar Market: A Comprehensive Market Report (2019-2033)
This comprehensive report provides an in-depth analysis of the Guar Market, encompassing its market dynamics, growth trends, regional dominance, product landscape, key challenges and opportunities, and future outlook. The study period covers 2019-2033, with 2025 as the base and estimated year. This report is crucial for industry professionals, investors, and stakeholders seeking a clear understanding of this dynamic market. The report analyzes the parent market of agricultural commodities and the child market of hydrocolloids, specifically focusing on Guar Gum and Guar Meal applications across various sectors.
Guar Market Dynamics & Structure
The global Guar market, valued at xx Million in 2024, is characterized by moderate concentration with key players like Noble Commodities, SunGum Global, Galaxy Gum, JK Agri Genetics, and Guar Gum International holding significant market share. Technological innovation, primarily in extraction and processing techniques, is a key driver, alongside regulatory changes impacting export and import. The market faces competition from synthetic substitutes, necessitating continuous product improvement and diversification. End-user demographics are primarily driven by the food, oil & gas, and paper industries. M&A activity has been relatively low in recent years, with xx deals recorded between 2019 and 2024, indicating potential for future consolidation.
- Market Concentration: Moderately concentrated, with top 5 players holding approximately xx% market share (2024).
- Technological Innovation: Focus on sustainable extraction, improved purity, and functional modifications of guar gum and meal.
- Regulatory Landscape: Stringent regulations concerning food safety and environmental impact, particularly impacting export markets.
- Competitive Substitutes: Synthetic hydrocolloids and other thickening agents pose a competitive threat.
- End-User Demographics: Food industry (xx%), Oil & Gas (xx%), Paper (xx%), Pharmaceuticals (xx%), Others (xx%) (2024).
- M&A Trends: Low activity observed recently; potential for increased consolidation in the coming years.
Guar Market Growth Trends & Insights
The global Guar market is demonstrating robust and consistent expansion, propelled by escalating demand across a multitude of industrial and consumer-facing sectors. Throughout the historical period spanning 2019-2024, the market experienced a Compound Annual Growth Rate (CAGR) of approximately [Insert Historical CAGR Value Here, e.g., 5.5%]%. Projections for the forecast period, from 2025 to 2033, indicate an accelerated CAGR of around [Insert Forecast CAGR Value Here, e.g., 6.8%]%. This upward trajectory is primarily attributed to the increasing consumer preference for natural and healthier food ingredients, the expanding utility of guar gum in the vital oil and gas sector for hydraulic fracturing and drilling fluids, and the growing imperative for sustainable and eco-friendly packaging materials. Furthermore, significant advancements in guar gum modification technologies are continuously enhancing its inherent functionalities, thereby unlocking its potential and driving adoption in novel and previously unexplored applications. The pervasive shift in consumer consciousness towards natural, plant-based, and environmentally benign products is a pivotal driver, significantly influencing consumption patterns and hastening adoption rates across the value chain.
Dominant Regions, Countries, or Segments in Guar Market
India dominates the Guar market, accounting for xx% of global production and exports in 2024. This dominance is attributed to India’s favorable climatic conditions for guar bean cultivation and established processing infrastructure. Within the product segments, Guar Gum holds a larger market share (xx%) compared to Guar Meal (xx%) in 2024 driven by broader application in food and other industries. The Food application segment leads in consumption (xx%), followed by Oil & Gas (xx%) and Paper (xx%).
- Key Drivers for India's Dominance: Favorable climate, large-scale cultivation, and established processing infrastructure.
- Guar Gum Segment Dominance: Broader applications across various sectors.
- Food Application Segment: High demand for natural thickening and stabilizing agents.
- Oil & Gas Segment: Usage as a fracturing fluid in hydraulic fracturing operations.
- Paper Segment: Applications in paper coatings and sizing.
Guar Market Product Landscape
Guar gum and guar meal are the primary products, with ongoing innovations focusing on modified guar gums with enhanced functionality and tailored properties for specific applications, including improved viscosity, clarity, and stability. These advancements address customer requirements for specific performance characteristics and cater to diverse end-use industries. The focus is on developing sustainable and eco-friendly processing methods.
Key Drivers, Barriers & Challenges in Guar Market
Key Drivers: Growing demand from the food industry, expanding applications in oil and gas (hydraulic fracturing), increased use in paper manufacturing, and rising adoption in pharmaceutical formulations.
Key Challenges: Fluctuations in guar bean yields due to weather patterns, competition from synthetic substitutes, and stringent regulatory requirements impacting international trade and export. Supply chain disruptions can also cause price volatility and impact market stability. The total impact of these challenges is estimated to reduce market growth by xx% in the forecast period.
Emerging Opportunities in Guar Market
The Guar market is ripe with emerging opportunities, particularly in under-penetrated developing economies where industrialization and consumer demand are on the rise. The growing global emphasis on sustainability and the urgent need for biodegradable materials present a substantial avenue for guar gum's application. Beyond its established uses, researchers are actively exploring novel applications in cutting-edge fields such as biomedicine, where its biocompatible properties can be leveraged, and in the cosmetics industry for its emulsifying and thickening capabilities. Continued investment in research and development focused on innovative guar gum modifications is poised to further broaden its application spectrum, opening doors to high-value markets and solidifying its position as a versatile biopolymer.
Growth Accelerators in the Guar Market Industry
Several critical factors are acting as powerful accelerators for growth within the Guar market industry. Foremost among these are ongoing technological breakthroughs in the modification and processing of guar gum, enabling enhanced performance characteristics and broader applicability. Strategic collaborations and partnerships forged between guar processors and key end-users are fostering innovation and ensuring market demand is met effectively. Furthermore, the proactive expansion into new and burgeoning geographical markets, particularly in Asia-Pacific and Latin America, is significantly contributing to market penetration. The development and adoption of sustainable, eco-friendly, and energy-efficient processing techniques are increasingly becoming a magnet for new customers and regulatory bodies, further bolstering market growth and industry reputation.
Key Players Shaping the Guar Market Market
- Noble Commodities
- SunGum Global
- Galaxy Gum
- JK Agri Genetics
- Guar Gum International
- Laxmi Proteins
- Agro Gums Pvt. Ltd.
- Modern Mills
- Viswaat Industries
- Sami-Sabinsa Group
Notable Milestones in Guar Market Sector
- May 2022: The Directorate General of Foreign Trade (DGFT) revised export regulations concerning guar gum shipments to the European Union (EU) and the United Kingdom (UK), mandating specific testing certificates. This regulatory adjustment has introduced increased scrutiny, potentially impacting export volumes and leading to higher compliance costs for Indian exporters, while also emphasizing the need for stringent quality control.
- October 2021: A significant development emerged with the successful creation of a novel biodegradable polymer synthesized using guar gum in conjunction with chitosan. This innovation holds immense promise for the packaging sector and other environmentally conscious industries, potentially creating a substantial surge in demand for guar gum as a sustainable alternative to conventional plastics.
- Early 2023: Advancements in enzymatic modification of guar gum have led to improved solubility and viscosity control, making it more adaptable for food applications requiring precise textural properties, such as dairy alternatives and gluten-free baked goods.
- Late 2022: Increased investment in research and development for guar gum's application in pharmaceutical drug delivery systems, exploring its controlled-release capabilities, signifies a growing interest in its high-value, specialized uses.
In-Depth Guar Market Market Outlook
The Guar market is poised for steady growth, driven by innovation, expanding applications, and increasing demand for natural and sustainable materials. Strategic partnerships and investments in research and development will further accelerate market expansion, creating lucrative opportunities for existing and new market players. The forecasted growth will predominantly come from increased adoption in developing markets and innovative applications, with a continued focus on sustainability.
Guar Market Segmentation
- 1. Production Analysis
- 2. Consumption Analysis
- 3. Import Market Analysis (Value & Volume)
- 4. Export Market Analysis (Value & Volume)
- 5. Price Trend Analysis
Guar Market Segmentation By Geography
-
1. North America
- 1.1. United States
- 1.2. Canada
-
2. Europe
- 2.1. Germany
- 2.2. France
- 2.3. Russia
- 2.4. Spain
-
3. Asia Pacific
- 3.1. India
- 3.2. China
- 3.3. Japan
- 3.4. Australia
-
4. South America
- 4.1. Brazil
- 4.2. Argentina
-
5. Africa
- 5.1. Malawi
- 5.2. Sudan
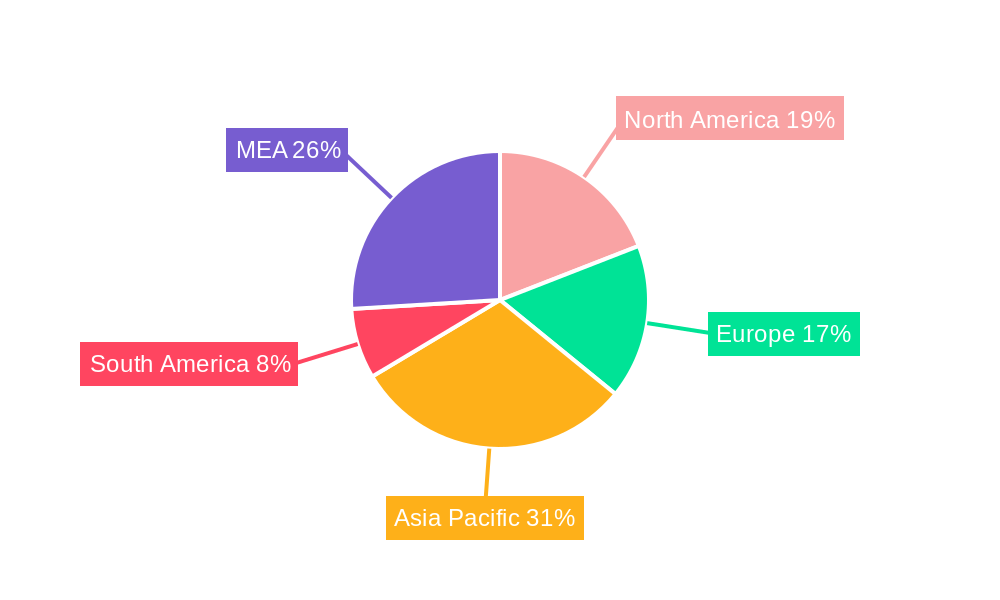
Guar Market Regional Market Share
Geographic Coverage of Guar Market
Guar Market REPORT HIGHLIGHTS
| Aspects | Details |
|---|---|
| Study Period | 2020-2034 |
| Base Year | 2025 |
| Estimated Year | 2026 |
| Forecast Period | 2026-2034 |
| Historical Period | 2020-2025 |
| Growth Rate | CAGR of 2.60% from 2020-2034 |
| Segmentation |
|
Table of Contents
- 1. Introduction
- 1.1. Research Scope
- 1.2. Market Segmentation
- 1.3. Research Objective
- 1.4. Definitions and Assumptions
- 2. Executive Summary
- 2.1. Market Snapshot
- 3. Market Dynamics
- 3.1. Market Drivers
- 3.2. Market Restrains
- 3.3. Market Trends
- 3.4. Market Opportunities
- 4. Market Factor Analysis
- 4.1. Porters Five Forces
- 4.1.1. Bargaining Power of Suppliers
- 4.1.2. Bargaining Power of Buyers
- 4.1.3. Threat of New Entrants
- 4.1.4. Threat of Substitutes
- 4.1.5. Competitive Rivalry
- 4.2. PESTEL analysis
- 4.3. BCG Analysis
- 4.3.1. Stars (High Growth, High Market Share)
- 4.3.2. Cash Cows (Low Growth, High Market Share)
- 4.3.3. Question Mark (High Growth, Low Market Share)
- 4.3.4. Dogs (Low Growth, Low Market Share)
- 4.4. Ansoff Matrix Analysis
- 4.5. Supply Chain Analysis
- 4.6. Regulatory Landscape
- 4.7. Current Market Potential and Opportunity Assessment (TAM–SAM–SOM Framework)
- 4.8. NRP Analyst Note
- 4.1. Porters Five Forces
- 5. Market Analysis, Insights and Forecast 2021-2033
- 5.1. Market Analysis, Insights and Forecast - by Production Analysis
- 5.2. Market Analysis, Insights and Forecast - by Consumption Analysis
- 5.3. Market Analysis, Insights and Forecast - by Import Market Analysis (Value & Volume)
- 5.4. Market Analysis, Insights and Forecast - by Export Market Analysis (Value & Volume)
- 5.5. Market Analysis, Insights and Forecast - by Price Trend Analysis
- 5.6. Market Analysis, Insights and Forecast - by Region
- 5.6.1. North America
- 5.6.2. Europe
- 5.6.3. Asia Pacific
- 5.6.4. South America
- 5.6.5. Africa
- 6. Global Guar Market Analysis, Insights and Forecast, 2021-2033
- 6.1. Market Analysis, Insights and Forecast - by Production Analysis
- 6.2. Market Analysis, Insights and Forecast - by Consumption Analysis
- 6.3. Market Analysis, Insights and Forecast - by Import Market Analysis (Value & Volume)
- 6.4. Market Analysis, Insights and Forecast - by Export Market Analysis (Value & Volume)
- 6.5. Market Analysis, Insights and Forecast - by Price Trend Analysis
- 7. North America Guar Market Analysis, Insights and Forecast, 2020-2032
- 7.1. Market Analysis, Insights and Forecast - by Production Analysis
- 7.2. Market Analysis, Insights and Forecast - by Consumption Analysis
- 7.3. Market Analysis, Insights and Forecast - by Import Market Analysis (Value & Volume)
- 7.4. Market Analysis, Insights and Forecast - by Export Market Analysis (Value & Volume)
- 7.5. Market Analysis, Insights and Forecast - by Price Trend Analysis
- 8. Europe Guar Market Analysis, Insights and Forecast, 2020-2032
- 8.1. Market Analysis, Insights and Forecast - by Production Analysis
- 8.2. Market Analysis, Insights and Forecast - by Consumption Analysis
- 8.3. Market Analysis, Insights and Forecast - by Import Market Analysis (Value & Volume)
- 8.4. Market Analysis, Insights and Forecast - by Export Market Analysis (Value & Volume)
- 8.5. Market Analysis, Insights and Forecast - by Price Trend Analysis
- 9. Asia Pacific Guar Market Analysis, Insights and Forecast, 2020-2032
- 9.1. Market Analysis, Insights and Forecast - by Production Analysis
- 9.2. Market Analysis, Insights and Forecast - by Consumption Analysis
- 9.3. Market Analysis, Insights and Forecast - by Import Market Analysis (Value & Volume)
- 9.4. Market Analysis, Insights and Forecast - by Export Market Analysis (Value & Volume)
- 9.5. Market Analysis, Insights and Forecast - by Price Trend Analysis
- 10. South America Guar Market Analysis, Insights and Forecast, 2020-2032
- 10.1. Market Analysis, Insights and Forecast - by Production Analysis
- 10.2. Market Analysis, Insights and Forecast - by Consumption Analysis
- 10.3. Market Analysis, Insights and Forecast - by Import Market Analysis (Value & Volume)
- 10.4. Market Analysis, Insights and Forecast - by Export Market Analysis (Value & Volume)
- 10.5. Market Analysis, Insights and Forecast - by Price Trend Analysis
- 11. Africa Guar Market Analysis, Insights and Forecast, 2020-2032
- 11.1. Market Analysis, Insights and Forecast - by Production Analysis
- 11.2. Market Analysis, Insights and Forecast - by Consumption Analysis
- 11.3. Market Analysis, Insights and Forecast - by Import Market Analysis (Value & Volume)
- 11.4. Market Analysis, Insights and Forecast - by Export Market Analysis (Value & Volume)
- 11.5. Market Analysis, Insights and Forecast - by Price Trend Analysis
- 12. Competitive Analysis
- 12.1. Company Profiles
- 12.1.1 Noble Commodities
- 12.1.1.1. Company Overview
- 12.1.1.2. Products
- 12.1.1.3. Company Financials
- 12.1.1.4. SWOT Analysis
- 12.1.2 SunGum Global
- 12.1.2.1. Company Overview
- 12.1.2.2. Products
- 12.1.2.3. Company Financials
- 12.1.2.4. SWOT Analysis
- 12.1.3 Galaxy Gum
- 12.1.3.1. Company Overview
- 12.1.3.2. Products
- 12.1.3.3. Company Financials
- 12.1.3.4. SWOT Analysis
- 12.1.4 JK Agri Genetics
- 12.1.4.1. Company Overview
- 12.1.4.2. Products
- 12.1.4.3. Company Financials
- 12.1.4.4. SWOT Analysis
- 12.1.5 Guar Gum International
- 12.1.5.1. Company Overview
- 12.1.5.2. Products
- 12.1.5.3. Company Financials
- 12.1.5.4. SWOT Analysis
- 12.1.1 Noble Commodities
- 12.2. Market Entropy
- 12.2.1 Company's Key Areas Served
- 12.2.2 Recent Developments
- 12.3. Company Market Share Analysis 2025
- 12.3.1 Top 5 Companies Market Share Analysis
- 12.3.2 Top 3 Companies Market Share Analysis
- 12.4. List of Potential Customers
- 13. Research Methodology
List of Figures
- Figure 1: Global Guar Market Revenue Breakdown (Million, %) by Region 2025 & 2033
- Figure 2: Global Guar Market Volume Breakdown (Kiloton, %) by Region 2025 & 2033
- Figure 3: North America Guar Market Revenue (Million), by Production Analysis 2025 & 2033
- Figure 4: North America Guar Market Volume (Kiloton), by Production Analysis 2025 & 2033
- Figure 5: North America Guar Market Revenue Share (%), by Production Analysis 2025 & 2033
- Figure 6: North America Guar Market Volume Share (%), by Production Analysis 2025 & 2033
- Figure 7: North America Guar Market Revenue (Million), by Consumption Analysis 2025 & 2033
- Figure 8: North America Guar Market Volume (Kiloton), by Consumption Analysis 2025 & 2033
- Figure 9: North America Guar Market Revenue Share (%), by Consumption Analysis 2025 & 2033
- Figure 10: North America Guar Market Volume Share (%), by Consumption Analysis 2025 & 2033
- Figure 11: North America Guar Market Revenue (Million), by Import Market Analysis (Value & Volume) 2025 & 2033
- Figure 12: North America Guar Market Volume (Kiloton), by Import Market Analysis (Value & Volume) 2025 & 2033
- Figure 13: North America Guar Market Revenue Share (%), by Import Market Analysis (Value & Volume) 2025 & 2033
- Figure 14: North America Guar Market Volume Share (%), by Import Market Analysis (Value & Volume) 2025 & 2033
- Figure 15: North America Guar Market Revenue (Million), by Export Market Analysis (Value & Volume) 2025 & 2033
- Figure 16: North America Guar Market Volume (Kiloton), by Export Market Analysis (Value & Volume) 2025 & 2033
- Figure 17: North America Guar Market Revenue Share (%), by Export Market Analysis (Value & Volume) 2025 & 2033
- Figure 18: North America Guar Market Volume Share (%), by Export Market Analysis (Value & Volume) 2025 & 2033
- Figure 19: North America Guar Market Revenue (Million), by Price Trend Analysis 2025 & 2033
- Figure 20: North America Guar Market Volume (Kiloton), by Price Trend Analysis 2025 & 2033
- Figure 21: North America Guar Market Revenue Share (%), by Price Trend Analysis 2025 & 2033
- Figure 22: North America Guar Market Volume Share (%), by Price Trend Analysis 2025 & 2033
- Figure 23: North America Guar Market Revenue (Million), by Country 2025 & 2033
- Figure 24: North America Guar Market Volume (Kiloton), by Country 2025 & 2033
- Figure 25: North America Guar Market Revenue Share (%), by Country 2025 & 2033
- Figure 26: North America Guar Market Volume Share (%), by Country 2025 & 2033
- Figure 27: Europe Guar Market Revenue (Million), by Production Analysis 2025 & 2033
- Figure 28: Europe Guar Market Volume (Kiloton), by Production Analysis 2025 & 2033
- Figure 29: Europe Guar Market Revenue Share (%), by Production Analysis 2025 & 2033
- Figure 30: Europe Guar Market Volume Share (%), by Production Analysis 2025 & 2033
- Figure 31: Europe Guar Market Revenue (Million), by Consumption Analysis 2025 & 2033
- Figure 32: Europe Guar Market Volume (Kiloton), by Consumption Analysis 2025 & 2033
- Figure 33: Europe Guar Market Revenue Share (%), by Consumption Analysis 2025 & 2033
- Figure 34: Europe Guar Market Volume Share (%), by Consumption Analysis 2025 & 2033
- Figure 35: Europe Guar Market Revenue (Million), by Import Market Analysis (Value & Volume) 2025 & 2033
- Figure 36: Europe Guar Market Volume (Kiloton), by Import Market Analysis (Value & Volume) 2025 & 2033
- Figure 37: Europe Guar Market Revenue Share (%), by Import Market Analysis (Value & Volume) 2025 & 2033
- Figure 38: Europe Guar Market Volume Share (%), by Import Market Analysis (Value & Volume) 2025 & 2033
- Figure 39: Europe Guar Market Revenue (Million), by Export Market Analysis (Value & Volume) 2025 & 2033
- Figure 40: Europe Guar Market Volume (Kiloton), by Export Market Analysis (Value & Volume) 2025 & 2033
- Figure 41: Europe Guar Market Revenue Share (%), by Export Market Analysis (Value & Volume) 2025 & 2033
- Figure 42: Europe Guar Market Volume Share (%), by Export Market Analysis (Value & Volume) 2025 & 2033
- Figure 43: Europe Guar Market Revenue (Million), by Price Trend Analysis 2025 & 2033
- Figure 44: Europe Guar Market Volume (Kiloton), by Price Trend Analysis 2025 & 2033
- Figure 45: Europe Guar Market Revenue Share (%), by Price Trend Analysis 2025 & 2033
- Figure 46: Europe Guar Market Volume Share (%), by Price Trend Analysis 2025 & 2033
- Figure 47: Europe Guar Market Revenue (Million), by Country 2025 & 2033
- Figure 48: Europe Guar Market Volume (Kiloton), by Country 2025 & 2033
- Figure 49: Europe Guar Market Revenue Share (%), by Country 2025 & 2033
- Figure 50: Europe Guar Market Volume Share (%), by Country 2025 & 2033
- Figure 51: Asia Pacific Guar Market Revenue (Million), by Production Analysis 2025 & 2033
- Figure 52: Asia Pacific Guar Market Volume (Kiloton), by Production Analysis 2025 & 2033
- Figure 53: Asia Pacific Guar Market Revenue Share (%), by Production Analysis 2025 & 2033
- Figure 54: Asia Pacific Guar Market Volume Share (%), by Production Analysis 2025 & 2033
- Figure 55: Asia Pacific Guar Market Revenue (Million), by Consumption Analysis 2025 & 2033
- Figure 56: Asia Pacific Guar Market Volume (Kiloton), by Consumption Analysis 2025 & 2033
- Figure 57: Asia Pacific Guar Market Revenue Share (%), by Consumption Analysis 2025 & 2033
- Figure 58: Asia Pacific Guar Market Volume Share (%), by Consumption Analysis 2025 & 2033
- Figure 59: Asia Pacific Guar Market Revenue (Million), by Import Market Analysis (Value & Volume) 2025 & 2033
- Figure 60: Asia Pacific Guar Market Volume (Kiloton), by Import Market Analysis (Value & Volume) 2025 & 2033
- Figure 61: Asia Pacific Guar Market Revenue Share (%), by Import Market Analysis (Value & Volume) 2025 & 2033
- Figure 62: Asia Pacific Guar Market Volume Share (%), by Import Market Analysis (Value & Volume) 2025 & 2033
- Figure 63: Asia Pacific Guar Market Revenue (Million), by Export Market Analysis (Value & Volume) 2025 & 2033
- Figure 64: Asia Pacific Guar Market Volume (Kiloton), by Export Market Analysis (Value & Volume) 2025 & 2033
- Figure 65: Asia Pacific Guar Market Revenue Share (%), by Export Market Analysis (Value & Volume) 2025 & 2033
- Figure 66: Asia Pacific Guar Market Volume Share (%), by Export Market Analysis (Value & Volume) 2025 & 2033
- Figure 67: Asia Pacific Guar Market Revenue (Million), by Price Trend Analysis 2025 & 2033
- Figure 68: Asia Pacific Guar Market Volume (Kiloton), by Price Trend Analysis 2025 & 2033
- Figure 69: Asia Pacific Guar Market Revenue Share (%), by Price Trend Analysis 2025 & 2033
- Figure 70: Asia Pacific Guar Market Volume Share (%), by Price Trend Analysis 2025 & 2033
- Figure 71: Asia Pacific Guar Market Revenue (Million), by Country 2025 & 2033
- Figure 72: Asia Pacific Guar Market Volume (Kiloton), by Country 2025 & 2033
- Figure 73: Asia Pacific Guar Market Revenue Share (%), by Country 2025 & 2033
- Figure 74: Asia Pacific Guar Market Volume Share (%), by Country 2025 & 2033
- Figure 75: South America Guar Market Revenue (Million), by Production Analysis 2025 & 2033
- Figure 76: South America Guar Market Volume (Kiloton), by Production Analysis 2025 & 2033
- Figure 77: South America Guar Market Revenue Share (%), by Production Analysis 2025 & 2033
- Figure 78: South America Guar Market Volume Share (%), by Production Analysis 2025 & 2033
- Figure 79: South America Guar Market Revenue (Million), by Consumption Analysis 2025 & 2033
- Figure 80: South America Guar Market Volume (Kiloton), by Consumption Analysis 2025 & 2033
- Figure 81: South America Guar Market Revenue Share (%), by Consumption Analysis 2025 & 2033
- Figure 82: South America Guar Market Volume Share (%), by Consumption Analysis 2025 & 2033
- Figure 83: South America Guar Market Revenue (Million), by Import Market Analysis (Value & Volume) 2025 & 2033
- Figure 84: South America Guar Market Volume (Kiloton), by Import Market Analysis (Value & Volume) 2025 & 2033
- Figure 85: South America Guar Market Revenue Share (%), by Import Market Analysis (Value & Volume) 2025 & 2033
- Figure 86: South America Guar Market Volume Share (%), by Import Market Analysis (Value & Volume) 2025 & 2033
- Figure 87: South America Guar Market Revenue (Million), by Export Market Analysis (Value & Volume) 2025 & 2033
- Figure 88: South America Guar Market Volume (Kiloton), by Export Market Analysis (Value & Volume) 2025 & 2033
- Figure 89: South America Guar Market Revenue Share (%), by Export Market Analysis (Value & Volume) 2025 & 2033
- Figure 90: South America Guar Market Volume Share (%), by Export Market Analysis (Value & Volume) 2025 & 2033
- Figure 91: South America Guar Market Revenue (Million), by Price Trend Analysis 2025 & 2033
- Figure 92: South America Guar Market Volume (Kiloton), by Price Trend Analysis 2025 & 2033
- Figure 93: South America Guar Market Revenue Share (%), by Price Trend Analysis 2025 & 2033
- Figure 94: South America Guar Market Volume Share (%), by Price Trend Analysis 2025 & 2033
- Figure 95: South America Guar Market Revenue (Million), by Country 2025 & 2033
- Figure 96: South America Guar Market Volume (Kiloton), by Country 2025 & 2033
- Figure 97: South America Guar Market Revenue Share (%), by Country 2025 & 2033
- Figure 98: South America Guar Market Volume Share (%), by Country 2025 & 2033
- Figure 99: Africa Guar Market Revenue (Million), by Production Analysis 2025 & 2033
- Figure 100: Africa Guar Market Volume (Kiloton), by Production Analysis 2025 & 2033
- Figure 101: Africa Guar Market Revenue Share (%), by Production Analysis 2025 & 2033
- Figure 102: Africa Guar Market Volume Share (%), by Production Analysis 2025 & 2033
- Figure 103: Africa Guar Market Revenue (Million), by Consumption Analysis 2025 & 2033
- Figure 104: Africa Guar Market Volume (Kiloton), by Consumption Analysis 2025 & 2033
- Figure 105: Africa Guar Market Revenue Share (%), by Consumption Analysis 2025 & 2033
- Figure 106: Africa Guar Market Volume Share (%), by Consumption Analysis 2025 & 2033
- Figure 107: Africa Guar Market Revenue (Million), by Import Market Analysis (Value & Volume) 2025 & 2033
- Figure 108: Africa Guar Market Volume (Kiloton), by Import Market Analysis (Value & Volume) 2025 & 2033
- Figure 109: Africa Guar Market Revenue Share (%), by Import Market Analysis (Value & Volume) 2025 & 2033
- Figure 110: Africa Guar Market Volume Share (%), by Import Market Analysis (Value & Volume) 2025 & 2033
- Figure 111: Africa Guar Market Revenue (Million), by Export Market Analysis (Value & Volume) 2025 & 2033
- Figure 112: Africa Guar Market Volume (Kiloton), by Export Market Analysis (Value & Volume) 2025 & 2033
- Figure 113: Africa Guar Market Revenue Share (%), by Export Market Analysis (Value & Volume) 2025 & 2033
- Figure 114: Africa Guar Market Volume Share (%), by Export Market Analysis (Value & Volume) 2025 & 2033
- Figure 115: Africa Guar Market Revenue (Million), by Price Trend Analysis 2025 & 2033
- Figure 116: Africa Guar Market Volume (Kiloton), by Price Trend Analysis 2025 & 2033
- Figure 117: Africa Guar Market Revenue Share (%), by Price Trend Analysis 2025 & 2033
- Figure 118: Africa Guar Market Volume Share (%), by Price Trend Analysis 2025 & 2033
- Figure 119: Africa Guar Market Revenue (Million), by Country 2025 & 2033
- Figure 120: Africa Guar Market Volume (Kiloton), by Country 2025 & 2033
- Figure 121: Africa Guar Market Revenue Share (%), by Country 2025 & 2033
- Figure 122: Africa Guar Market Volume Share (%), by Country 2025 & 2033
List of Tables
- Table 1: Global Guar Market Revenue Million Forecast, by Production Analysis 2020 & 2033
- Table 2: Global Guar Market Volume Kiloton Forecast, by Production Analysis 2020 & 2033
- Table 3: Global Guar Market Revenue Million Forecast, by Consumption Analysis 2020 & 2033
- Table 4: Global Guar Market Volume Kiloton Forecast, by Consumption Analysis 2020 & 2033
- Table 5: Global Guar Market Revenue Million Forecast, by Import Market Analysis (Value & Volume) 2020 & 2033
- Table 6: Global Guar Market Volume Kiloton Forecast, by Import Market Analysis (Value & Volume) 2020 & 2033
- Table 7: Global Guar Market Revenue Million Forecast, by Export Market Analysis (Value & Volume) 2020 & 2033
- Table 8: Global Guar Market Volume Kiloton Forecast, by Export Market Analysis (Value & Volume) 2020 & 2033
- Table 9: Global Guar Market Revenue Million Forecast, by Price Trend Analysis 2020 & 2033
- Table 10: Global Guar Market Volume Kiloton Forecast, by Price Trend Analysis 2020 & 2033
- Table 11: Global Guar Market Revenue Million Forecast, by Region 2020 & 2033
- Table 12: Global Guar Market Volume Kiloton Forecast, by Region 2020 & 2033
- Table 13: Global Guar Market Revenue Million Forecast, by Production Analysis 2020 & 2033
- Table 14: Global Guar Market Volume Kiloton Forecast, by Production Analysis 2020 & 2033
- Table 15: Global Guar Market Revenue Million Forecast, by Consumption Analysis 2020 & 2033
- Table 16: Global Guar Market Volume Kiloton Forecast, by Consumption Analysis 2020 & 2033
- Table 17: Global Guar Market Revenue Million Forecast, by Import Market Analysis (Value & Volume) 2020 & 2033
- Table 18: Global Guar Market Volume Kiloton Forecast, by Import Market Analysis (Value & Volume) 2020 & 2033
- Table 19: Global Guar Market Revenue Million Forecast, by Export Market Analysis (Value & Volume) 2020 & 2033
- Table 20: Global Guar Market Volume Kiloton Forecast, by Export Market Analysis (Value & Volume) 2020 & 2033
- Table 21: Global Guar Market Revenue Million Forecast, by Price Trend Analysis 2020 & 2033
- Table 22: Global Guar Market Volume Kiloton Forecast, by Price Trend Analysis 2020 & 2033
- Table 23: Global Guar Market Revenue Million Forecast, by Country 2020 & 2033
- Table 24: Global Guar Market Volume Kiloton Forecast, by Country 2020 & 2033
- Table 25: United States Guar Market Revenue (Million) Forecast, by Application 2020 & 2033
- Table 26: United States Guar Market Volume (Kiloton) Forecast, by Application 2020 & 2033
- Table 27: Canada Guar Market Revenue (Million) Forecast, by Application 2020 & 2033
- Table 28: Canada Guar Market Volume (Kiloton) Forecast, by Application 2020 & 2033
- Table 29: Global Guar Market Revenue Million Forecast, by Production Analysis 2020 & 2033
- Table 30: Global Guar Market Volume Kiloton Forecast, by Production Analysis 2020 & 2033
- Table 31: Global Guar Market Revenue Million Forecast, by Consumption Analysis 2020 & 2033
- Table 32: Global Guar Market Volume Kiloton Forecast, by Consumption Analysis 2020 & 2033
- Table 33: Global Guar Market Revenue Million Forecast, by Import Market Analysis (Value & Volume) 2020 & 2033
- Table 34: Global Guar Market Volume Kiloton Forecast, by Import Market Analysis (Value & Volume) 2020 & 2033
- Table 35: Global Guar Market Revenue Million Forecast, by Export Market Analysis (Value & Volume) 2020 & 2033
- Table 36: Global Guar Market Volume Kiloton Forecast, by Export Market Analysis (Value & Volume) 2020 & 2033
- Table 37: Global Guar Market Revenue Million Forecast, by Price Trend Analysis 2020 & 2033
- Table 38: Global Guar Market Volume Kiloton Forecast, by Price Trend Analysis 2020 & 2033
- Table 39: Global Guar Market Revenue Million Forecast, by Country 2020 & 2033
- Table 40: Global Guar Market Volume Kiloton Forecast, by Country 2020 & 2033
- Table 41: Germany Guar Market Revenue (Million) Forecast, by Application 2020 & 2033
- Table 42: Germany Guar Market Volume (Kiloton) Forecast, by Application 2020 & 2033
- Table 43: France Guar Market Revenue (Million) Forecast, by Application 2020 & 2033
- Table 44: France Guar Market Volume (Kiloton) Forecast, by Application 2020 & 2033
- Table 45: Russia Guar Market Revenue (Million) Forecast, by Application 2020 & 2033
- Table 46: Russia Guar Market Volume (Kiloton) Forecast, by Application 2020 & 2033
- Table 47: Spain Guar Market Revenue (Million) Forecast, by Application 2020 & 2033
- Table 48: Spain Guar Market Volume (Kiloton) Forecast, by Application 2020 & 2033
- Table 49: Global Guar Market Revenue Million Forecast, by Production Analysis 2020 & 2033
- Table 50: Global Guar Market Volume Kiloton Forecast, by Production Analysis 2020 & 2033
- Table 51: Global Guar Market Revenue Million Forecast, by Consumption Analysis 2020 & 2033
- Table 52: Global Guar Market Volume Kiloton Forecast, by Consumption Analysis 2020 & 2033
- Table 53: Global Guar Market Revenue Million Forecast, by Import Market Analysis (Value & Volume) 2020 & 2033
- Table 54: Global Guar Market Volume Kiloton Forecast, by Import Market Analysis (Value & Volume) 2020 & 2033
- Table 55: Global Guar Market Revenue Million Forecast, by Export Market Analysis (Value & Volume) 2020 & 2033
- Table 56: Global Guar Market Volume Kiloton Forecast, by Export Market Analysis (Value & Volume) 2020 & 2033
- Table 57: Global Guar Market Revenue Million Forecast, by Price Trend Analysis 2020 & 2033
- Table 58: Global Guar Market Volume Kiloton Forecast, by Price Trend Analysis 2020 & 2033
- Table 59: Global Guar Market Revenue Million Forecast, by Country 2020 & 2033
- Table 60: Global Guar Market Volume Kiloton Forecast, by Country 2020 & 2033
- Table 61: India Guar Market Revenue (Million) Forecast, by Application 2020 & 2033
- Table 62: India Guar Market Volume (Kiloton) Forecast, by Application 2020 & 2033
- Table 63: China Guar Market Revenue (Million) Forecast, by Application 2020 & 2033
- Table 64: China Guar Market Volume (Kiloton) Forecast, by Application 2020 & 2033
- Table 65: Japan Guar Market Revenue (Million) Forecast, by Application 2020 & 2033
- Table 66: Japan Guar Market Volume (Kiloton) Forecast, by Application 2020 & 2033
- Table 67: Australia Guar Market Revenue (Million) Forecast, by Application 2020 & 2033
- Table 68: Australia Guar Market Volume (Kiloton) Forecast, by Application 2020 & 2033
- Table 69: Global Guar Market Revenue Million Forecast, by Production Analysis 2020 & 2033
- Table 70: Global Guar Market Volume Kiloton Forecast, by Production Analysis 2020 & 2033
- Table 71: Global Guar Market Revenue Million Forecast, by Consumption Analysis 2020 & 2033
- Table 72: Global Guar Market Volume Kiloton Forecast, by Consumption Analysis 2020 & 2033
- Table 73: Global Guar Market Revenue Million Forecast, by Import Market Analysis (Value & Volume) 2020 & 2033
- Table 74: Global Guar Market Volume Kiloton Forecast, by Import Market Analysis (Value & Volume) 2020 & 2033
- Table 75: Global Guar Market Revenue Million Forecast, by Export Market Analysis (Value & Volume) 2020 & 2033
- Table 76: Global Guar Market Volume Kiloton Forecast, by Export Market Analysis (Value & Volume) 2020 & 2033
- Table 77: Global Guar Market Revenue Million Forecast, by Price Trend Analysis 2020 & 2033
- Table 78: Global Guar Market Volume Kiloton Forecast, by Price Trend Analysis 2020 & 2033
- Table 79: Global Guar Market Revenue Million Forecast, by Country 2020 & 2033
- Table 80: Global Guar Market Volume Kiloton Forecast, by Country 2020 & 2033
- Table 81: Brazil Guar Market Revenue (Million) Forecast, by Application 2020 & 2033
- Table 82: Brazil Guar Market Volume (Kiloton) Forecast, by Application 2020 & 2033
- Table 83: Argentina Guar Market Revenue (Million) Forecast, by Application 2020 & 2033
- Table 84: Argentina Guar Market Volume (Kiloton) Forecast, by Application 2020 & 2033
- Table 85: Global Guar Market Revenue Million Forecast, by Production Analysis 2020 & 2033
- Table 86: Global Guar Market Volume Kiloton Forecast, by Production Analysis 2020 & 2033
- Table 87: Global Guar Market Revenue Million Forecast, by Consumption Analysis 2020 & 2033
- Table 88: Global Guar Market Volume Kiloton Forecast, by Consumption Analysis 2020 & 2033
- Table 89: Global Guar Market Revenue Million Forecast, by Import Market Analysis (Value & Volume) 2020 & 2033
- Table 90: Global Guar Market Volume Kiloton Forecast, by Import Market Analysis (Value & Volume) 2020 & 2033
- Table 91: Global Guar Market Revenue Million Forecast, by Export Market Analysis (Value & Volume) 2020 & 2033
- Table 92: Global Guar Market Volume Kiloton Forecast, by Export Market Analysis (Value & Volume) 2020 & 2033
- Table 93: Global Guar Market Revenue Million Forecast, by Price Trend Analysis 2020 & 2033
- Table 94: Global Guar Market Volume Kiloton Forecast, by Price Trend Analysis 2020 & 2033
- Table 95: Global Guar Market Revenue Million Forecast, by Country 2020 & 2033
- Table 96: Global Guar Market Volume Kiloton Forecast, by Country 2020 & 2033
- Table 97: Malawi Guar Market Revenue (Million) Forecast, by Application 2020 & 2033
- Table 98: Malawi Guar Market Volume (Kiloton) Forecast, by Application 2020 & 2033
- Table 99: Sudan Guar Market Revenue (Million) Forecast, by Application 2020 & 2033
- Table 100: Sudan Guar Market Volume (Kiloton) Forecast, by Application 2020 & 2033
Frequently Asked Questions
1. What is the projected Compound Annual Growth Rate (CAGR) of the Guar Market?
The projected CAGR is approximately 2.60%.
2. Which companies are prominent players in the Guar Market?
Key companies in the market include Noble Commodities, SunGum Global , Galaxy Gum , JK Agri Genetics , Guar Gum International .
3. What are the main segments of the Guar Market?
The market segments include Production Analysis, Consumption Analysis, Import Market Analysis (Value & Volume), Export Market Analysis (Value & Volume), Price Trend Analysis.
4. Can you provide details about the market size?
The market size is estimated to be USD 1.31 Million as of 2022.
5. What are some drivers contributing to market growth?
Rising Consumption of Cashew Nuts in the Country; Favorable Government Initiatives.
6. What are the notable trends driving market growth?
High Demand by End-users.
7. Are there any restraints impacting market growth?
Hazardous Climatic Condition Hinders Cashew Production; Stringent Regulations Related to Food Quality Standards.
8. Can you provide examples of recent developments in the market?
May 2022: The Directorate General of Foreign Trade (DGFT), on May 9, 2022, issued an amendment to the notification dated September 29, 2017, for the export of guar gum to the European Union and the United Kingdom. The export originating from India should get an official certificate and the original analytical report of testing of pentachlorophenol (PCP) and ethylene oxide (ETO) from Vimta Labs, Hyderabad. In addition to Vimta Labs, Hyderabad, Export Inspection Agency (EIA) Chennai has also been authorized to issue the analytical report of testing of PCP.
9. What pricing options are available for accessing the report?
Pricing options include single-user, multi-user, and enterprise licenses priced at USD 4750, USD 5250, and USD 8750 respectively.
10. Is the market size provided in terms of value or volume?
The market size is provided in terms of value, measured in Million and volume, measured in Kiloton.
11. Are there any specific market keywords associated with the report?
Yes, the market keyword associated with the report is "Guar Market," which aids in identifying and referencing the specific market segment covered.
12. How do I determine which pricing option suits my needs best?
The pricing options vary based on user requirements and access needs. Individual users may opt for single-user licenses, while businesses requiring broader access may choose multi-user or enterprise licenses for cost-effective access to the report.
13. Are there any additional resources or data provided in the Guar Market report?
While the report offers comprehensive insights, it's advisable to review the specific contents or supplementary materials provided to ascertain if additional resources or data are available.
14. How can I stay updated on further developments or reports in the Guar Market?
To stay informed about further developments, trends, and reports in the Guar Market, consider subscribing to industry newsletters, following relevant companies and organizations, or regularly checking reputable industry news sources and publications.
Methodology
Step 1 - Identification of Relevant Samples Size from Population Database


Step 2 - Approaches for Defining Global Market Size (Value, Volume* & Price*)

Note*: In applicable scenarios
Step 3 - Data Sources
Primary Research
- Web Analytics
- Survey Reports
- Research Institute
- Latest Research Reports
- Opinion Leaders
Secondary Research
- Annual Reports
- White Paper
- Latest Press Release
- Industry Association
- Paid Database
- Investor Presentations

Step 4 - Data Triangulation
Involves using different sources of information in order to increase the validity of a study
These sources are likely to be stakeholders in a program - participants, other researchers, program staff, other community members, and so on.
Then we put all data in single framework & apply various statistical tools to find out the dynamic on the market.
During the analysis stage, feedback from the stakeholder groups would be compared to determine areas of agreement as well as areas of divergence