

Key Insights
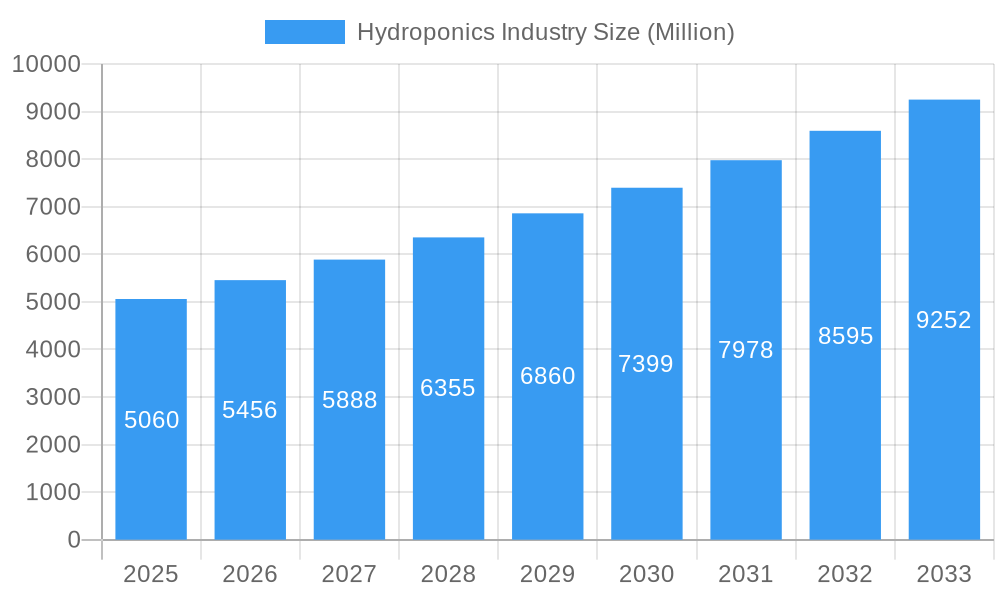
The global hydroponics market, valued at $5.06 billion in 2025, is projected to experience robust growth, driven by a Compound Annual Growth Rate (CAGR) of 7.80% from 2025 to 2033. This expansion is fueled by several key factors. Increasing urbanization and the consequent shrinking of arable land are pushing towards more efficient and space-saving agricultural techniques. Consumer demand for fresh, locally-sourced produce is also a significant driver, as hydroponics allows for year-round cultivation regardless of climate or season. Technological advancements in hydroponic systems, particularly in automation and precision agriculture, are further enhancing efficiency and yield, making the technology more accessible and appealing to both large-scale commercial operations and smaller-scale urban farms. The growing awareness of the environmental benefits of hydroponics, including reduced water usage and minimized pesticide application, is also contributing to market growth. While initial investment costs can be a barrier for some, the long-term benefits in terms of higher yields and reduced operational expenses are increasingly outweighing this concern. The market is segmented by system type (aggregate and liquid hydroponic systems), crop type (tomatoes, lettuce, leafy greens, peppers, cucumbers, microgreens, and others), and geography, with North America and Europe currently holding significant market shares.
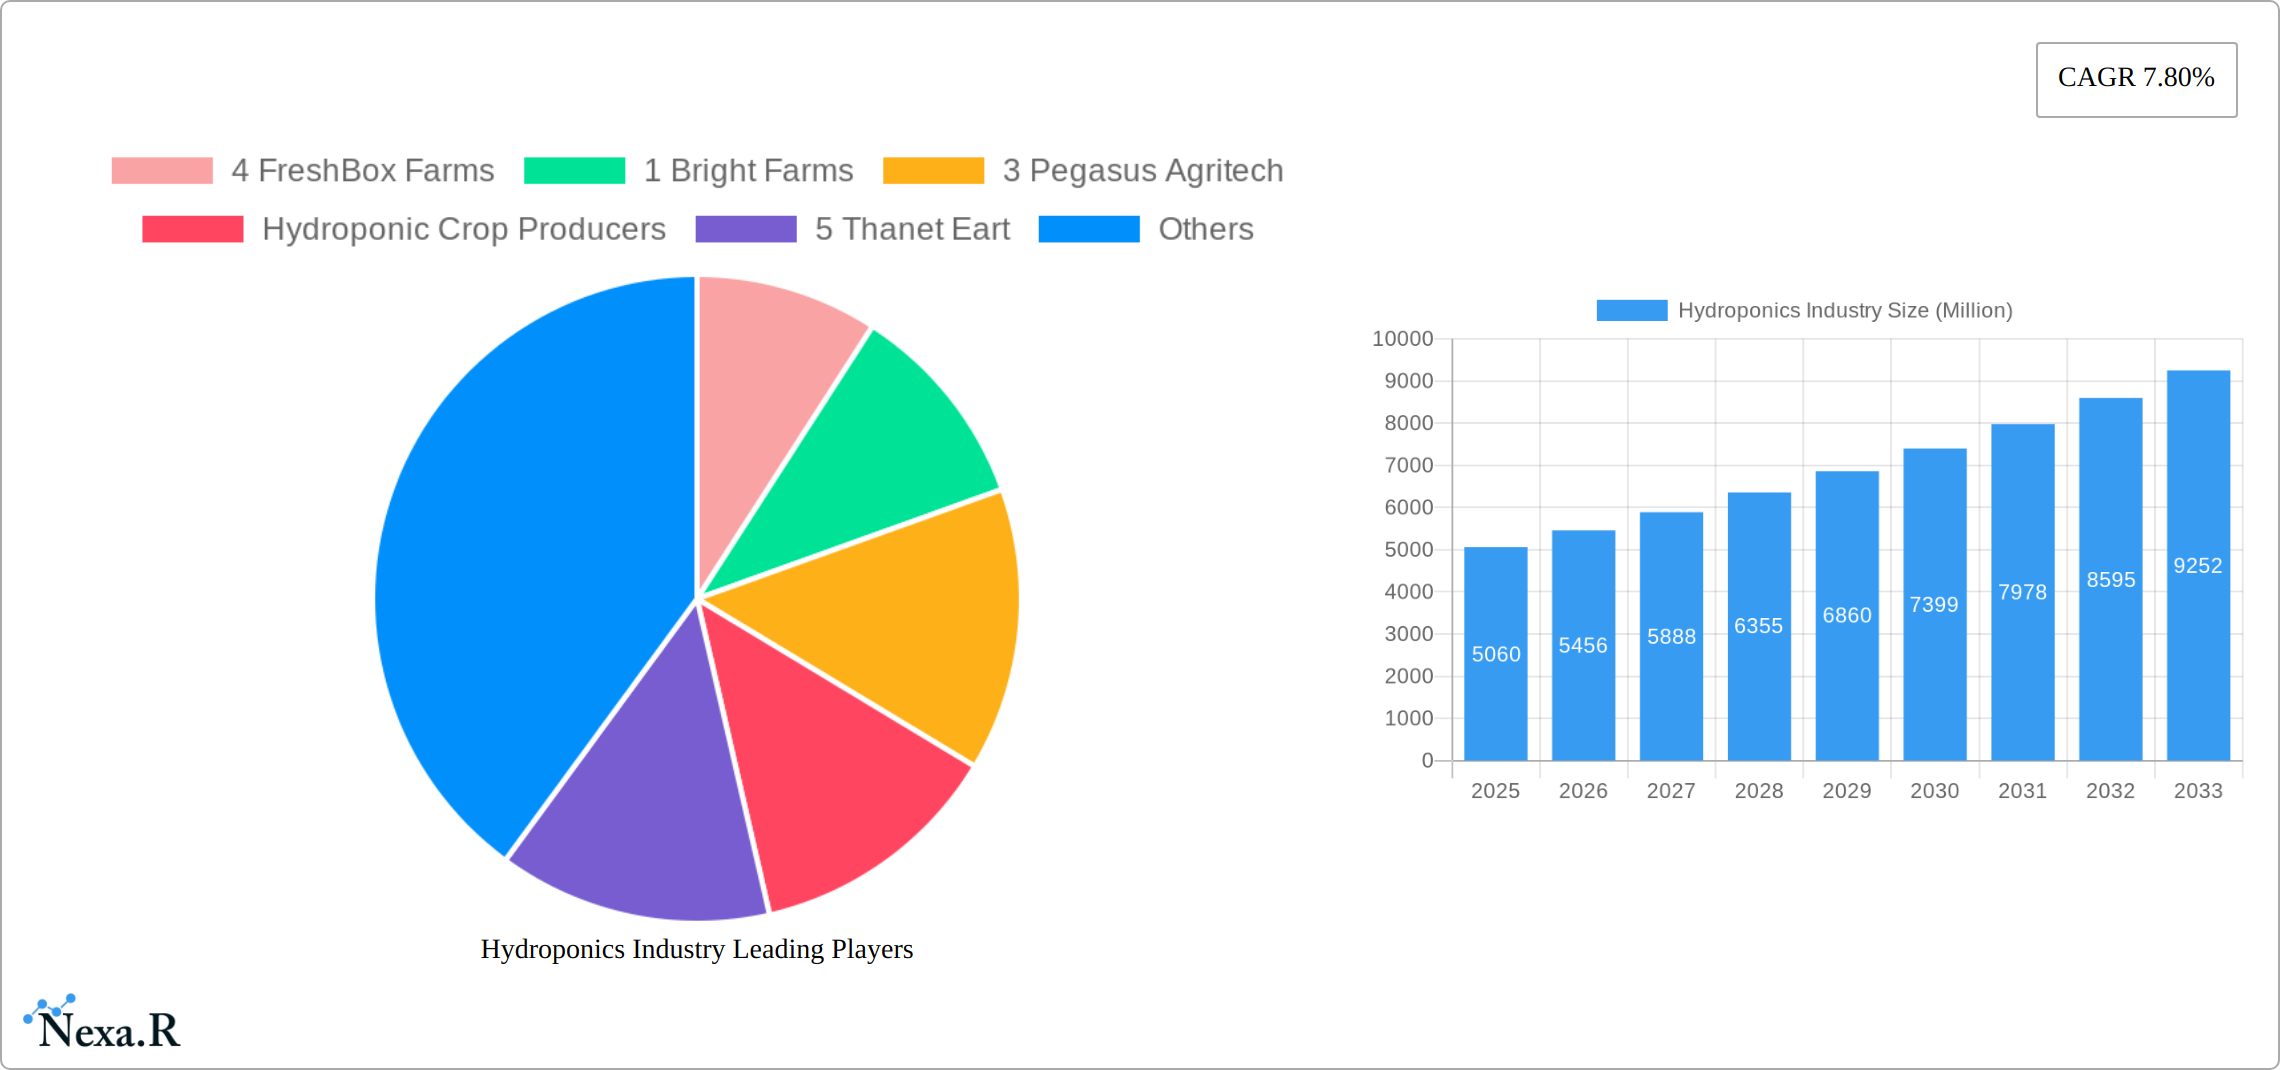
Hydroponics Industry Market Size (In Billion)
The competitive landscape is characterized by a mix of established players and emerging startups. Companies like Village Farms International Inc. and Bright Farms are leading the way in large-scale commercial hydroponic operations, while smaller, innovative companies are focusing on niche markets and technological advancements. Future growth will likely be influenced by factors such as government support for sustainable agriculture, further technological innovations, and the evolving preferences of consumers who are increasingly aware of the environmental and health implications of their food choices. The expansion into new crop types and the development of more resilient and adaptable hydroponic systems will also play a crucial role in shaping the market's future trajectory. The continued rise in consumer awareness of food security and the sustainability concerns surrounding traditional farming methods positions the hydroponics industry for sustained and significant growth in the coming years.
Hydroponics Industry Company Market Share
Hydroponics Industry Market Report: 2019-2033
This comprehensive report provides a detailed analysis of the hydroponics industry, encompassing market dynamics, growth trends, key players, and future outlook. With a focus on key segments – including Aggregate Hydroponic Systems, Liquid Hydroponic Systems, and various crop types like Tomatoes, Lettuce, Leafy Vegetables, Peppers, Cucumbers, Microgreens, and Others – this report offers invaluable insights for industry professionals, investors, and stakeholders. The study period covers 2019-2033, with a base year of 2025 and a forecast period of 2025-2033. The historical period analyzed is 2019-2024. Market values are presented in millions of units.
Hydroponics Industry Market Dynamics & Structure
The hydroponics industry is characterized by a moderately fragmented market structure, with several key players vying for market share. While larger companies like Village Farms International Inc. hold significant positions, numerous smaller, specialized businesses also contribute substantially. Technological innovation, particularly in automation, nutrient delivery systems, and environmental control, is a major driver. Regulatory frameworks vary by region, influencing both growth and investment. Competitive substitutes, such as traditional agriculture and other controlled-environment agriculture (CEA) methods, exert pressure. End-user demographics are expanding, driven by increasing consumer demand for fresh, locally-sourced produce and growing awareness of sustainable food production. M&A activity remains significant, with larger companies acquiring smaller firms to expand their market reach and technological capabilities.
- Market Concentration: Moderately Fragmented (xx% top 5 players)
- Technological Innovation: Automation, precision nutrient delivery, AI-driven monitoring.
- Regulatory Landscape: Varies by region; impacts investment and expansion.
- Competitive Substitutes: Traditional agriculture, other CEA technologies.
- End-User Demographics: Growing demand for fresh, sustainable produce.
- M&A Activity: Significant; driven by market consolidation and technology acquisition (xx deals in the last 5 years).
Hydroponics Industry Growth Trends & Insights
The hydroponics industry is experiencing remarkable growth, fueled by a confluence of factors. A surge in consumer demand for locally sourced, fresh, and sustainably produced food is significantly expanding the market. Simultaneously, technological advancements, including automation, data analytics, and precision agriculture techniques, are dramatically increasing efficiency and yield, attracting substantial investment. Government initiatives promoting sustainable agriculture, food security, and water conservation are further bolstering this growth. While hydroponics currently holds a relatively small market share compared to traditional agriculture, adoption rates are accelerating, particularly in regions grappling with water scarcity or limited arable land. Market analysts project a compound annual growth rate (CAGR) of [Insert Updated CAGR]% during the forecast period (2025-2033), indicating a dynamic and rapidly evolving industry. The market size is predicted to reach [Insert Updated Market Size in Millions] by 2033, a significant increase from [Insert Updated Market Size in Millions] in 2025. This growth trajectory reflects the increasing recognition of hydroponics' potential to address global food security challenges and promote sustainable agricultural practices.
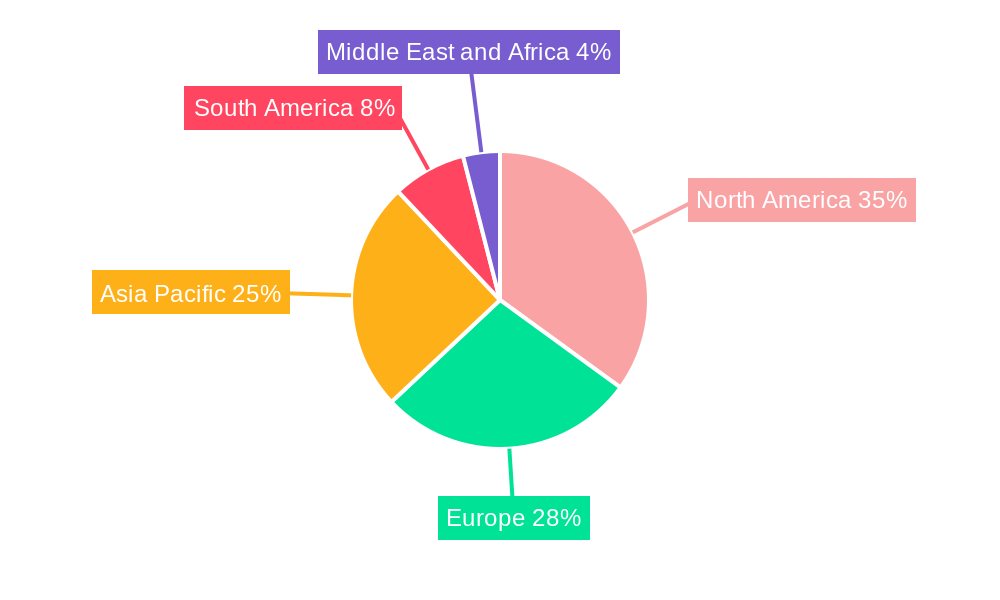
Dominant Regions, Countries, or Segments in Hydroponics Industry
The North American and European markets currently dominate the global hydroponics industry, driven by strong consumer demand, technological innovation, and supportive government policies. Within these regions, specific countries like the United States, Canada, Netherlands, and Germany are particularly strong. However, growth in Asia and the Middle East is accelerating rapidly, prompted by rising populations, water scarcity, and increasing investment in agricultural technology.
- Leading Segment: Liquid Hydroponic Systems (holds xx% market share in 2025)
- Fastest-Growing Segment: Microgreens (estimated CAGR of xx% during 2025-2033)
- Key Drivers:
- Increasing consumer demand for fresh, locally-sourced produce.
- Technological advancements leading to improved efficiency and yield.
- Government support and incentives for sustainable agriculture.
- Water scarcity and land limitations in certain regions.
Hydroponics Industry Product Landscape
The hydroponic systems market is characterized by constant innovation, with a focus on enhancing efficiency, maximizing yield, and automating processes. Deep water culture (DWC) and nutrient film technique (NFT) systems remain popular for their scalability and ease of management, while aeroponic and other advanced systems provide precise control over nutrient delivery and environmental conditions. Technological advancements such as automated climate control, AI-powered monitoring and predictive analytics, and sophisticated nutrient management systems are revolutionizing the sector. Key selling points for hydroponic systems include significantly reduced water consumption compared to traditional agriculture, substantially higher yields, and the capacity for year-round crop production, irrespective of climate or season. This allows for consistent supply and reduced reliance on weather patterns.
Key Drivers, Barriers & Challenges in Hydroponics Industry
Key Drivers:
- The escalating consumer preference for fresh, healthy, and sustainably produced food.
- Continuous technological advancements driving increased efficiency and yield.
- Government policies and incentives supporting sustainable agriculture and technological innovation.
- The growing urgency to address water scarcity and land limitations, particularly in densely populated regions.
- Rising demand for locally grown produce, reducing transportation costs and environmental impact.
Key Challenges:
- High initial capital investment required for establishing hydroponic systems.
- Dependence on reliable energy sources and robust technological infrastructure.
- The potential risk of pest and disease outbreaks, requiring proactive management strategies.
- Competition from established agricultural practices, which currently hold a [Insert Updated Market Share]% market share (2025).
- The need for skilled labor and specialized knowledge to operate and maintain hydroponic systems effectively.
Emerging Opportunities in Hydroponics Industry
Several emerging trends present compelling opportunities for growth within the hydroponics industry. The increasing demand for organic produce and specialized crops is creating lucrative niche markets. Significant potential exists for expansion into underserved markets in developing countries, addressing critical food security challenges. Innovative applications, such as vertical farming in urban environments, are gaining significant traction, offering solutions for local food production in densely populated areas. The development of robust and resilient supply chains, efficient distribution networks, and effective market access strategies will be pivotal for sustained industry expansion and market penetration.
Growth Accelerators in the Hydroponics Industry
Technological advancements, such as the integration of AI and IoT in hydroponic systems, are accelerating industry growth. Strategic partnerships between technology companies, agricultural businesses, and retailers are creating synergies and expanding market reach. Market expansion into emerging economies and underserved regions offers significant long-term growth potential.
Key Players Shaping the Hydroponics Industry Market
- 4 FreshBox Farms
- Bright Farms
- Pegasus Agritech
- Hydroponic Crop Producers
- Thanet Eart
- Village Farms International Inc
Notable Milestones in Hydroponics Industry Sector
- July 2022: Bustanica unveils the world's largest hydroponic farm (USD 40 million investment), showcasing the scale of potential within the industry.
- October 2022: GrowGeneration Corp expands its retail presence to 17 states, indicating a growing market for hydroponic supplies and equipment.
- January 2024: Bright Farms expands its greenhouse operations to three new locations, demonstrating the increasing viability of large-scale hydroponic operations.
- March 2024: INSONGREEN announces significant expansion in the Middle East and Africa, highlighting the global reach and potential of hydroponic technology.
- [Add More Recent Milestones]: Include any other significant developments, such as new product launches, mergers and acquisitions, or significant funding rounds. This will keep the content current and relevant.
In-Depth Hydroponics Industry Market Outlook
The hydroponics industry is poised for significant long-term growth, driven by technological advancements, increasing consumer demand, and supportive government policies. Strategic opportunities lie in expanding into new markets, developing innovative products and services, and building robust supply chains. The focus on sustainability and efficiency positions the industry for continued success in the face of growing global food security concerns.
Hydroponics Industry Segmentation
- 1. Production Analysis
- 2. Consumption Analysis
- 3. Import Market Analysis (Value & Volume)
- 4. Export Market Analysis (Value & Volume)
- 5. Price Trend Analysis
Hydroponics Industry Segmentation By Geography
-
1. North America
- 1.1. United States
- 1.2. Canada
- 1.3. Mexico
-
2. South America
- 2.1. Brazil
- 2.2. Argentina
- 2.3. Rest of South America
-
3. Europe
- 3.1. United Kingdom
- 3.2. Germany
- 3.3. France
- 3.4. Italy
- 3.5. Spain
- 3.6. Russia
- 3.7. Benelux
- 3.8. Nordics
- 3.9. Rest of Europe
-
4. Middle East & Africa
- 4.1. Turkey
- 4.2. Israel
- 4.3. GCC
- 4.4. North Africa
- 4.5. South Africa
- 4.6. Rest of Middle East & Africa
-
5. Asia Pacific
- 5.1. China
- 5.2. India
- 5.3. Japan
- 5.4. South Korea
- 5.5. ASEAN
- 5.6. Oceania
- 5.7. Rest of Asia Pacific
Hydroponics Industry Regional Market Share
Geographic Coverage of Hydroponics Industry
Hydroponics Industry REPORT HIGHLIGHTS
| Aspects | Details |
|---|---|
| Study Period | 2020-2034 |
| Base Year | 2025 |
| Estimated Year | 2026 |
| Forecast Period | 2026-2034 |
| Historical Period | 2020-2025 |
| Growth Rate | CAGR of 7.80% from 2020-2034 |
| Segmentation |
|
Table of Contents
- 1. Introduction
- 1.1. Research Scope
- 1.2. Market Segmentation
- 1.3. Research Objective
- 1.4. Definitions and Assumptions
- 2. Executive Summary
- 2.1. Market Snapshot
- 3. Market Dynamics
- 3.1. Market Drivers
- 3.2. Market Restrains
- 3.3. Market Trends
- 3.4. Market Opportunities
- 4. Market Factor Analysis
- 4.1. Porters Five Forces
- 4.1.1. Bargaining Power of Suppliers
- 4.1.2. Bargaining Power of Buyers
- 4.1.3. Threat of New Entrants
- 4.1.4. Threat of Substitutes
- 4.1.5. Competitive Rivalry
- 4.2. PESTEL analysis
- 4.3. BCG Analysis
- 4.3.1. Stars (High Growth, High Market Share)
- 4.3.2. Cash Cows (Low Growth, High Market Share)
- 4.3.3. Question Mark (High Growth, Low Market Share)
- 4.3.4. Dogs (Low Growth, Low Market Share)
- 4.4. Ansoff Matrix Analysis
- 4.5. Supply Chain Analysis
- 4.6. Regulatory Landscape
- 4.7. Current Market Potential and Opportunity Assessment (TAM–SAM–SOM Framework)
- 4.8. NRP Analyst Note
- 4.1. Porters Five Forces
- 5. Market Analysis, Insights and Forecast 2021-2033
- 5.1. Market Analysis, Insights and Forecast - by Production Analysis
- 5.2. Market Analysis, Insights and Forecast - by Consumption Analysis
- 5.3. Market Analysis, Insights and Forecast - by Import Market Analysis (Value & Volume)
- 5.4. Market Analysis, Insights and Forecast - by Export Market Analysis (Value & Volume)
- 5.5. Market Analysis, Insights and Forecast - by Price Trend Analysis
- 5.6. Market Analysis, Insights and Forecast - by Region
- 5.6.1. North America
- 5.6.2. South America
- 5.6.3. Europe
- 5.6.4. Middle East & Africa
- 5.6.5. Asia Pacific
- 6. Global Hydroponics Industry Analysis, Insights and Forecast, 2021-2033
- 6.1. Market Analysis, Insights and Forecast - by Production Analysis
- 6.2. Market Analysis, Insights and Forecast - by Consumption Analysis
- 6.3. Market Analysis, Insights and Forecast - by Import Market Analysis (Value & Volume)
- 6.4. Market Analysis, Insights and Forecast - by Export Market Analysis (Value & Volume)
- 6.5. Market Analysis, Insights and Forecast - by Price Trend Analysis
- 7. North America Hydroponics Industry Analysis, Insights and Forecast, 2020-2032
- 7.1. Market Analysis, Insights and Forecast - by Production Analysis
- 7.2. Market Analysis, Insights and Forecast - by Consumption Analysis
- 7.3. Market Analysis, Insights and Forecast - by Import Market Analysis (Value & Volume)
- 7.4. Market Analysis, Insights and Forecast - by Export Market Analysis (Value & Volume)
- 7.5. Market Analysis, Insights and Forecast - by Price Trend Analysis
- 8. South America Hydroponics Industry Analysis, Insights and Forecast, 2020-2032
- 8.1. Market Analysis, Insights and Forecast - by Production Analysis
- 8.2. Market Analysis, Insights and Forecast - by Consumption Analysis
- 8.3. Market Analysis, Insights and Forecast - by Import Market Analysis (Value & Volume)
- 8.4. Market Analysis, Insights and Forecast - by Export Market Analysis (Value & Volume)
- 8.5. Market Analysis, Insights and Forecast - by Price Trend Analysis
- 9. Europe Hydroponics Industry Analysis, Insights and Forecast, 2020-2032
- 9.1. Market Analysis, Insights and Forecast - by Production Analysis
- 9.2. Market Analysis, Insights and Forecast - by Consumption Analysis
- 9.3. Market Analysis, Insights and Forecast - by Import Market Analysis (Value & Volume)
- 9.4. Market Analysis, Insights and Forecast - by Export Market Analysis (Value & Volume)
- 9.5. Market Analysis, Insights and Forecast - by Price Trend Analysis
- 10. Middle East & Africa Hydroponics Industry Analysis, Insights and Forecast, 2020-2032
- 10.1. Market Analysis, Insights and Forecast - by Production Analysis
- 10.2. Market Analysis, Insights and Forecast - by Consumption Analysis
- 10.3. Market Analysis, Insights and Forecast - by Import Market Analysis (Value & Volume)
- 10.4. Market Analysis, Insights and Forecast - by Export Market Analysis (Value & Volume)
- 10.5. Market Analysis, Insights and Forecast - by Price Trend Analysis
- 11. Asia Pacific Hydroponics Industry Analysis, Insights and Forecast, 2020-2032
- 11.1. Market Analysis, Insights and Forecast - by Production Analysis
- 11.2. Market Analysis, Insights and Forecast - by Consumption Analysis
- 11.3. Market Analysis, Insights and Forecast - by Import Market Analysis (Value & Volume)
- 11.4. Market Analysis, Insights and Forecast - by Export Market Analysis (Value & Volume)
- 11.5. Market Analysis, Insights and Forecast - by Price Trend Analysis
- 12. Competitive Analysis
- 12.1. Company Profiles
- 12.1.1 4 FreshBox Farms
- 12.1.1.1. Company Overview
- 12.1.1.2. Products
- 12.1.1.3. Company Financials
- 12.1.1.4. SWOT Analysis
- 12.1.2 1 Bright Farms
- 12.1.2.1. Company Overview
- 12.1.2.2. Products
- 12.1.2.3. Company Financials
- 12.1.2.4. SWOT Analysis
- 12.1.3 3 Pegasus Agritech
- 12.1.3.1. Company Overview
- 12.1.3.2. Products
- 12.1.3.3. Company Financials
- 12.1.3.4. SWOT Analysis
- 12.1.4 Hydroponic Crop Producers
- 12.1.4.1. Company Overview
- 12.1.4.2. Products
- 12.1.4.3. Company Financials
- 12.1.4.4. SWOT Analysis
- 12.1.5 5 Thanet Eart
- 12.1.5.1. Company Overview
- 12.1.5.2. Products
- 12.1.5.3. Company Financials
- 12.1.5.4. SWOT Analysis
- 12.1.6 2 Village Farms International Inc
- 12.1.6.1. Company Overview
- 12.1.6.2. Products
- 12.1.6.3. Company Financials
- 12.1.6.4. SWOT Analysis
- 12.1.1 4 FreshBox Farms
- 12.2. Market Entropy
- 12.2.1 Company's Key Areas Served
- 12.2.2 Recent Developments
- 12.3. Company Market Share Analysis 2025
- 12.3.1 Top 5 Companies Market Share Analysis
- 12.3.2 Top 3 Companies Market Share Analysis
- 12.4. List of Potential Customers
- 13. Research Methodology
List of Figures
- Figure 1: Global Hydroponics Industry Revenue Breakdown (Million, %) by Region 2025 & 2033
- Figure 2: North America Hydroponics Industry Revenue (Million), by Production Analysis 2025 & 2033
- Figure 3: North America Hydroponics Industry Revenue Share (%), by Production Analysis 2025 & 2033
- Figure 4: North America Hydroponics Industry Revenue (Million), by Consumption Analysis 2025 & 2033
- Figure 5: North America Hydroponics Industry Revenue Share (%), by Consumption Analysis 2025 & 2033
- Figure 6: North America Hydroponics Industry Revenue (Million), by Import Market Analysis (Value & Volume) 2025 & 2033
- Figure 7: North America Hydroponics Industry Revenue Share (%), by Import Market Analysis (Value & Volume) 2025 & 2033
- Figure 8: North America Hydroponics Industry Revenue (Million), by Export Market Analysis (Value & Volume) 2025 & 2033
- Figure 9: North America Hydroponics Industry Revenue Share (%), by Export Market Analysis (Value & Volume) 2025 & 2033
- Figure 10: North America Hydroponics Industry Revenue (Million), by Price Trend Analysis 2025 & 2033
- Figure 11: North America Hydroponics Industry Revenue Share (%), by Price Trend Analysis 2025 & 2033
- Figure 12: North America Hydroponics Industry Revenue (Million), by Country 2025 & 2033
- Figure 13: North America Hydroponics Industry Revenue Share (%), by Country 2025 & 2033
- Figure 14: South America Hydroponics Industry Revenue (Million), by Production Analysis 2025 & 2033
- Figure 15: South America Hydroponics Industry Revenue Share (%), by Production Analysis 2025 & 2033
- Figure 16: South America Hydroponics Industry Revenue (Million), by Consumption Analysis 2025 & 2033
- Figure 17: South America Hydroponics Industry Revenue Share (%), by Consumption Analysis 2025 & 2033
- Figure 18: South America Hydroponics Industry Revenue (Million), by Import Market Analysis (Value & Volume) 2025 & 2033
- Figure 19: South America Hydroponics Industry Revenue Share (%), by Import Market Analysis (Value & Volume) 2025 & 2033
- Figure 20: South America Hydroponics Industry Revenue (Million), by Export Market Analysis (Value & Volume) 2025 & 2033
- Figure 21: South America Hydroponics Industry Revenue Share (%), by Export Market Analysis (Value & Volume) 2025 & 2033
- Figure 22: South America Hydroponics Industry Revenue (Million), by Price Trend Analysis 2025 & 2033
- Figure 23: South America Hydroponics Industry Revenue Share (%), by Price Trend Analysis 2025 & 2033
- Figure 24: South America Hydroponics Industry Revenue (Million), by Country 2025 & 2033
- Figure 25: South America Hydroponics Industry Revenue Share (%), by Country 2025 & 2033
- Figure 26: Europe Hydroponics Industry Revenue (Million), by Production Analysis 2025 & 2033
- Figure 27: Europe Hydroponics Industry Revenue Share (%), by Production Analysis 2025 & 2033
- Figure 28: Europe Hydroponics Industry Revenue (Million), by Consumption Analysis 2025 & 2033
- Figure 29: Europe Hydroponics Industry Revenue Share (%), by Consumption Analysis 2025 & 2033
- Figure 30: Europe Hydroponics Industry Revenue (Million), by Import Market Analysis (Value & Volume) 2025 & 2033
- Figure 31: Europe Hydroponics Industry Revenue Share (%), by Import Market Analysis (Value & Volume) 2025 & 2033
- Figure 32: Europe Hydroponics Industry Revenue (Million), by Export Market Analysis (Value & Volume) 2025 & 2033
- Figure 33: Europe Hydroponics Industry Revenue Share (%), by Export Market Analysis (Value & Volume) 2025 & 2033
- Figure 34: Europe Hydroponics Industry Revenue (Million), by Price Trend Analysis 2025 & 2033
- Figure 35: Europe Hydroponics Industry Revenue Share (%), by Price Trend Analysis 2025 & 2033
- Figure 36: Europe Hydroponics Industry Revenue (Million), by Country 2025 & 2033
- Figure 37: Europe Hydroponics Industry Revenue Share (%), by Country 2025 & 2033
- Figure 38: Middle East & Africa Hydroponics Industry Revenue (Million), by Production Analysis 2025 & 2033
- Figure 39: Middle East & Africa Hydroponics Industry Revenue Share (%), by Production Analysis 2025 & 2033
- Figure 40: Middle East & Africa Hydroponics Industry Revenue (Million), by Consumption Analysis 2025 & 2033
- Figure 41: Middle East & Africa Hydroponics Industry Revenue Share (%), by Consumption Analysis 2025 & 2033
- Figure 42: Middle East & Africa Hydroponics Industry Revenue (Million), by Import Market Analysis (Value & Volume) 2025 & 2033
- Figure 43: Middle East & Africa Hydroponics Industry Revenue Share (%), by Import Market Analysis (Value & Volume) 2025 & 2033
- Figure 44: Middle East & Africa Hydroponics Industry Revenue (Million), by Export Market Analysis (Value & Volume) 2025 & 2033
- Figure 45: Middle East & Africa Hydroponics Industry Revenue Share (%), by Export Market Analysis (Value & Volume) 2025 & 2033
- Figure 46: Middle East & Africa Hydroponics Industry Revenue (Million), by Price Trend Analysis 2025 & 2033
- Figure 47: Middle East & Africa Hydroponics Industry Revenue Share (%), by Price Trend Analysis 2025 & 2033
- Figure 48: Middle East & Africa Hydroponics Industry Revenue (Million), by Country 2025 & 2033
- Figure 49: Middle East & Africa Hydroponics Industry Revenue Share (%), by Country 2025 & 2033
- Figure 50: Asia Pacific Hydroponics Industry Revenue (Million), by Production Analysis 2025 & 2033
- Figure 51: Asia Pacific Hydroponics Industry Revenue Share (%), by Production Analysis 2025 & 2033
- Figure 52: Asia Pacific Hydroponics Industry Revenue (Million), by Consumption Analysis 2025 & 2033
- Figure 53: Asia Pacific Hydroponics Industry Revenue Share (%), by Consumption Analysis 2025 & 2033
- Figure 54: Asia Pacific Hydroponics Industry Revenue (Million), by Import Market Analysis (Value & Volume) 2025 & 2033
- Figure 55: Asia Pacific Hydroponics Industry Revenue Share (%), by Import Market Analysis (Value & Volume) 2025 & 2033
- Figure 56: Asia Pacific Hydroponics Industry Revenue (Million), by Export Market Analysis (Value & Volume) 2025 & 2033
- Figure 57: Asia Pacific Hydroponics Industry Revenue Share (%), by Export Market Analysis (Value & Volume) 2025 & 2033
- Figure 58: Asia Pacific Hydroponics Industry Revenue (Million), by Price Trend Analysis 2025 & 2033
- Figure 59: Asia Pacific Hydroponics Industry Revenue Share (%), by Price Trend Analysis 2025 & 2033
- Figure 60: Asia Pacific Hydroponics Industry Revenue (Million), by Country 2025 & 2033
- Figure 61: Asia Pacific Hydroponics Industry Revenue Share (%), by Country 2025 & 2033
List of Tables
- Table 1: Global Hydroponics Industry Revenue Million Forecast, by Production Analysis 2020 & 2033
- Table 2: Global Hydroponics Industry Revenue Million Forecast, by Consumption Analysis 2020 & 2033
- Table 3: Global Hydroponics Industry Revenue Million Forecast, by Import Market Analysis (Value & Volume) 2020 & 2033
- Table 4: Global Hydroponics Industry Revenue Million Forecast, by Export Market Analysis (Value & Volume) 2020 & 2033
- Table 5: Global Hydroponics Industry Revenue Million Forecast, by Price Trend Analysis 2020 & 2033
- Table 6: Global Hydroponics Industry Revenue Million Forecast, by Region 2020 & 2033
- Table 7: Global Hydroponics Industry Revenue Million Forecast, by Production Analysis 2020 & 2033
- Table 8: Global Hydroponics Industry Revenue Million Forecast, by Consumption Analysis 2020 & 2033
- Table 9: Global Hydroponics Industry Revenue Million Forecast, by Import Market Analysis (Value & Volume) 2020 & 2033
- Table 10: Global Hydroponics Industry Revenue Million Forecast, by Export Market Analysis (Value & Volume) 2020 & 2033
- Table 11: Global Hydroponics Industry Revenue Million Forecast, by Price Trend Analysis 2020 & 2033
- Table 12: Global Hydroponics Industry Revenue Million Forecast, by Country 2020 & 2033
- Table 13: United States Hydroponics Industry Revenue (Million) Forecast, by Application 2020 & 2033
- Table 14: Canada Hydroponics Industry Revenue (Million) Forecast, by Application 2020 & 2033
- Table 15: Mexico Hydroponics Industry Revenue (Million) Forecast, by Application 2020 & 2033
- Table 16: Global Hydroponics Industry Revenue Million Forecast, by Production Analysis 2020 & 2033
- Table 17: Global Hydroponics Industry Revenue Million Forecast, by Consumption Analysis 2020 & 2033
- Table 18: Global Hydroponics Industry Revenue Million Forecast, by Import Market Analysis (Value & Volume) 2020 & 2033
- Table 19: Global Hydroponics Industry Revenue Million Forecast, by Export Market Analysis (Value & Volume) 2020 & 2033
- Table 20: Global Hydroponics Industry Revenue Million Forecast, by Price Trend Analysis 2020 & 2033
- Table 21: Global Hydroponics Industry Revenue Million Forecast, by Country 2020 & 2033
- Table 22: Brazil Hydroponics Industry Revenue (Million) Forecast, by Application 2020 & 2033
- Table 23: Argentina Hydroponics Industry Revenue (Million) Forecast, by Application 2020 & 2033
- Table 24: Rest of South America Hydroponics Industry Revenue (Million) Forecast, by Application 2020 & 2033
- Table 25: Global Hydroponics Industry Revenue Million Forecast, by Production Analysis 2020 & 2033
- Table 26: Global Hydroponics Industry Revenue Million Forecast, by Consumption Analysis 2020 & 2033
- Table 27: Global Hydroponics Industry Revenue Million Forecast, by Import Market Analysis (Value & Volume) 2020 & 2033
- Table 28: Global Hydroponics Industry Revenue Million Forecast, by Export Market Analysis (Value & Volume) 2020 & 2033
- Table 29: Global Hydroponics Industry Revenue Million Forecast, by Price Trend Analysis 2020 & 2033
- Table 30: Global Hydroponics Industry Revenue Million Forecast, by Country 2020 & 2033
- Table 31: United Kingdom Hydroponics Industry Revenue (Million) Forecast, by Application 2020 & 2033
- Table 32: Germany Hydroponics Industry Revenue (Million) Forecast, by Application 2020 & 2033
- Table 33: France Hydroponics Industry Revenue (Million) Forecast, by Application 2020 & 2033
- Table 34: Italy Hydroponics Industry Revenue (Million) Forecast, by Application 2020 & 2033
- Table 35: Spain Hydroponics Industry Revenue (Million) Forecast, by Application 2020 & 2033
- Table 36: Russia Hydroponics Industry Revenue (Million) Forecast, by Application 2020 & 2033
- Table 37: Benelux Hydroponics Industry Revenue (Million) Forecast, by Application 2020 & 2033
- Table 38: Nordics Hydroponics Industry Revenue (Million) Forecast, by Application 2020 & 2033
- Table 39: Rest of Europe Hydroponics Industry Revenue (Million) Forecast, by Application 2020 & 2033
- Table 40: Global Hydroponics Industry Revenue Million Forecast, by Production Analysis 2020 & 2033
- Table 41: Global Hydroponics Industry Revenue Million Forecast, by Consumption Analysis 2020 & 2033
- Table 42: Global Hydroponics Industry Revenue Million Forecast, by Import Market Analysis (Value & Volume) 2020 & 2033
- Table 43: Global Hydroponics Industry Revenue Million Forecast, by Export Market Analysis (Value & Volume) 2020 & 2033
- Table 44: Global Hydroponics Industry Revenue Million Forecast, by Price Trend Analysis 2020 & 2033
- Table 45: Global Hydroponics Industry Revenue Million Forecast, by Country 2020 & 2033
- Table 46: Turkey Hydroponics Industry Revenue (Million) Forecast, by Application 2020 & 2033
- Table 47: Israel Hydroponics Industry Revenue (Million) Forecast, by Application 2020 & 2033
- Table 48: GCC Hydroponics Industry Revenue (Million) Forecast, by Application 2020 & 2033
- Table 49: North Africa Hydroponics Industry Revenue (Million) Forecast, by Application 2020 & 2033
- Table 50: South Africa Hydroponics Industry Revenue (Million) Forecast, by Application 2020 & 2033
- Table 51: Rest of Middle East & Africa Hydroponics Industry Revenue (Million) Forecast, by Application 2020 & 2033
- Table 52: Global Hydroponics Industry Revenue Million Forecast, by Production Analysis 2020 & 2033
- Table 53: Global Hydroponics Industry Revenue Million Forecast, by Consumption Analysis 2020 & 2033
- Table 54: Global Hydroponics Industry Revenue Million Forecast, by Import Market Analysis (Value & Volume) 2020 & 2033
- Table 55: Global Hydroponics Industry Revenue Million Forecast, by Export Market Analysis (Value & Volume) 2020 & 2033
- Table 56: Global Hydroponics Industry Revenue Million Forecast, by Price Trend Analysis 2020 & 2033
- Table 57: Global Hydroponics Industry Revenue Million Forecast, by Country 2020 & 2033
- Table 58: China Hydroponics Industry Revenue (Million) Forecast, by Application 2020 & 2033
- Table 59: India Hydroponics Industry Revenue (Million) Forecast, by Application 2020 & 2033
- Table 60: Japan Hydroponics Industry Revenue (Million) Forecast, by Application 2020 & 2033
- Table 61: South Korea Hydroponics Industry Revenue (Million) Forecast, by Application 2020 & 2033
- Table 62: ASEAN Hydroponics Industry Revenue (Million) Forecast, by Application 2020 & 2033
- Table 63: Oceania Hydroponics Industry Revenue (Million) Forecast, by Application 2020 & 2033
- Table 64: Rest of Asia Pacific Hydroponics Industry Revenue (Million) Forecast, by Application 2020 & 2033
Frequently Asked Questions
1. What is the projected Compound Annual Growth Rate (CAGR) of the Hydroponics Industry?
The projected CAGR is approximately 7.80%.
2. Which companies are prominent players in the Hydroponics Industry?
Key companies in the market include 4 FreshBox Farms, 1 Bright Farms, 3 Pegasus Agritech, Hydroponic Crop Producers, 5 Thanet Eart, 2 Village Farms International Inc.
3. What are the main segments of the Hydroponics Industry?
The market segments include Production Analysis, Consumption Analysis, Import Market Analysis (Value & Volume), Export Market Analysis (Value & Volume), Price Trend Analysis.
4. Can you provide details about the market size?
The market size is estimated to be USD 5.06 Million as of 2022.
5. What are some drivers contributing to market growth?
Need for Custom Product Development; Use of CROs for Regulatory Services.
6. What are the notable trends driving market growth?
Higher Consumption of Salads and Exotic Vegetables.
7. Are there any restraints impacting market growth?
Data and Cyber Security Concerns; Lack of Experts and Professionals in this Industry.
8. Can you provide examples of recent developments in the market?
March 2024: INSONGREEN announced a significant expansion of its hydroponic and vertical greenhouse production in the Middle East and Africa. This initiative aims to tackle regional water scarcity and food security challenges by utilizing advanced agricultural technologies for sustainable development.
9. What pricing options are available for accessing the report?
Pricing options include single-user, multi-user, and enterprise licenses priced at USD 4750, USD 5250, and USD 8750 respectively.
10. Is the market size provided in terms of value or volume?
The market size is provided in terms of value, measured in Million.
11. Are there any specific market keywords associated with the report?
Yes, the market keyword associated with the report is "Hydroponics Industry," which aids in identifying and referencing the specific market segment covered.
12. How do I determine which pricing option suits my needs best?
The pricing options vary based on user requirements and access needs. Individual users may opt for single-user licenses, while businesses requiring broader access may choose multi-user or enterprise licenses for cost-effective access to the report.
13. Are there any additional resources or data provided in the Hydroponics Industry report?
While the report offers comprehensive insights, it's advisable to review the specific contents or supplementary materials provided to ascertain if additional resources or data are available.
14. How can I stay updated on further developments or reports in the Hydroponics Industry?
To stay informed about further developments, trends, and reports in the Hydroponics Industry, consider subscribing to industry newsletters, following relevant companies and organizations, or regularly checking reputable industry news sources and publications.
Methodology
Step 1 - Identification of Relevant Samples Size from Population Database


Step 2 - Approaches for Defining Global Market Size (Value, Volume* & Price*)

Note*: In applicable scenarios
Step 3 - Data Sources
Primary Research
- Web Analytics
- Survey Reports
- Research Institute
- Latest Research Reports
- Opinion Leaders
Secondary Research
- Annual Reports
- White Paper
- Latest Press Release
- Industry Association
- Paid Database
- Investor Presentations

Step 4 - Data Triangulation
Involves using different sources of information in order to increase the validity of a study
These sources are likely to be stakeholders in a program - participants, other researchers, program staff, other community members, and so on.
Then we put all data in single framework & apply various statistical tools to find out the dynamic on the market.
During the analysis stage, feedback from the stakeholder groups would be compared to determine areas of agreement as well as areas of divergence