

Key Insights
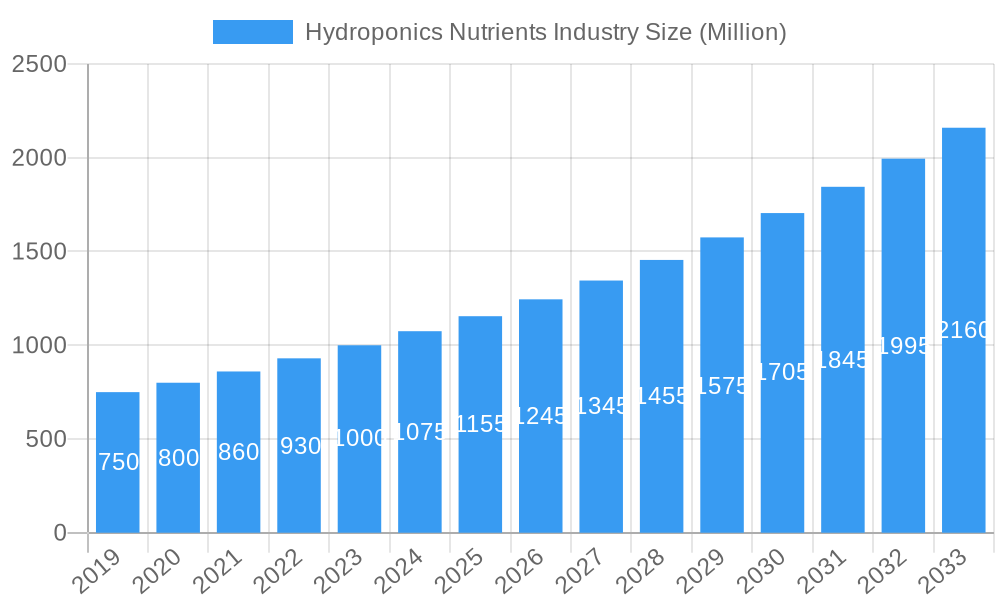
The global hydroponics nutrients market is poised for significant expansion, projected to reach an estimated market size of approximately USD 1,250 million by 2025, exhibiting a robust Compound Annual Growth Rate (CAGR) of 8.80% throughout the forecast period of 2025-2033. This burgeoning growth is propelled by a confluence of factors, most notably the increasing adoption of sustainable agricultural practices and the escalating demand for high-quality, year-round produce. As urban populations swell and arable land diminishes, hydroponics offers a compelling solution, enabling efficient food production in controlled environments with reduced water and land usage. The market is further invigorated by advancements in nutrient formulations and delivery systems, leading to improved crop yields and enhanced nutritional content. The growing awareness among consumers regarding the benefits of hydroponically grown produce, such as reduced pesticide use and freshness, is also a significant driver.
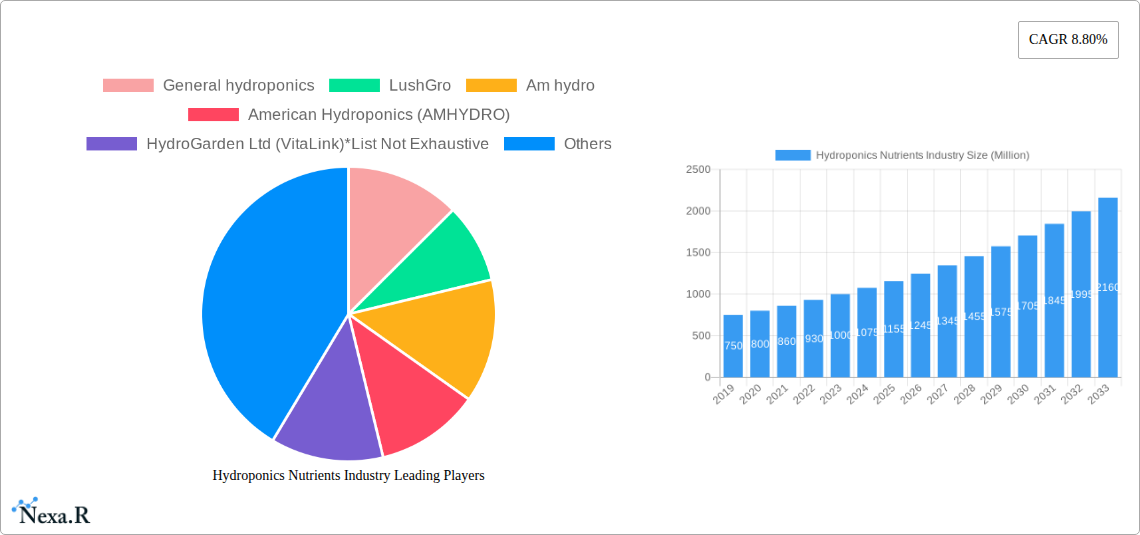
Hydroponics Nutrients Industry Market Size (In Million)
Several key trends are shaping the hydroponics nutrients landscape. The development of specialized nutrient solutions tailored to specific crop types and growth stages is a prominent trend, allowing for optimized plant development and disease resistance. Furthermore, the integration of automation and IoT technologies in hydroponic systems is streamlining nutrient management, leading to greater efficiency and precision. However, the market also faces certain restraints. The initial capital investment required for setting up advanced hydroponic systems can be a barrier for some growers. Additionally, the availability of skilled labor and technical expertise for managing complex hydroponic operations remains a challenge in certain regions. Nevertheless, the overwhelming advantages in terms of resource efficiency, product quality, and adaptability to diverse environments position the hydroponics nutrients market for sustained and substantial growth in the coming years.
Hydroponics Nutrients Industry Company Market Share
Comprehensive Report: Hydroponics Nutrients Industry – Market Dynamics, Trends, and Future Outlook (2019-2033)
This in-depth report provides a critical analysis of the global hydroponics nutrients market, offering actionable insights for stakeholders navigating this rapidly expanding sector. We delve into market dynamics, growth trajectories, regional dominance, product innovations, and the strategic landscape, leveraging high-traffic keywords such as "hydroponics nutrients," "vertical farming solutions," "soilless farming inputs," "CEA market growth," and "sustainable agriculture technology." The report meticulously examines both parent and child markets, providing a holistic view of the ecosystem.
Hydroponics Nutrients Industry Market Dynamics & Structure
The hydroponics nutrients industry is characterized by a moderately concentrated market structure, with several key players holding significant market share. Innovation remains a primary driver, fueled by advancements in plant science and a growing demand for efficient, sustainable agricultural practices. Regulatory frameworks, while evolving, are generally supportive of controlled environment agriculture (CEA) and soilless farming, encouraging investment and expansion. Competitive product substitutes, such as organic fertilizers and traditional soil-based agriculture, exist but are increasingly challenged by the efficiency and predictability offered by hydroponic nutrient solutions. End-user demographics are diversifying, encompassing commercial growers, hobbyists, and researchers, all seeking optimized plant growth and yield. Mergers and acquisitions (M&A) activity is a notable trend, with larger companies acquiring smaller innovators to expand their product portfolios and market reach.
- Market Concentration: Dominated by a mix of established chemical manufacturers and specialized hydroponic nutrient providers.
- Technological Innovation Drivers: Focus on customized formulations, nutrient delivery systems, and bio-stimulants for enhanced plant health and yield.
- Regulatory Frameworks: Emerging standards for nutrient safety and environmental impact in soilless cultivation.
- Competitive Product Substitutes: Traditional fertilizers and soil-based agriculture, facing challenges in water efficiency and land use.
- End-User Demographics: Commercial farms, urban agriculture projects, home gardeners, and research institutions.
- M&A Trends: Strategic acquisitions to gain market share and integrate innovative technologies.
Hydroponics Nutrients Industry Growth Trends & Insights
The global hydroponics nutrients market is poised for significant expansion, driven by an escalating demand for food security and sustainable agricultural practices. Projections indicate a robust Compound Annual Growth Rate (CAGR) of xx% from 2025 to 2033, with the market size projected to reach an estimated $XX,XXX Million in 2025. This growth is underpinned by increasing adoption rates of soilless farming technologies, particularly in urban and peri-urban areas where land is scarce. Technological disruptions, such as the development of AI-driven nutrient management systems and advanced sensor technologies, are further revolutionizing the industry, enabling precise control over nutrient delivery and plant health. Consumer behavior shifts towards locally sourced, pesticide-free produce are also playing a pivotal role, driving demand for hydroponically grown crops. Market penetration for hydroponics nutrients is expected to accelerate as awareness and accessibility of these systems increase. Historical data from 2019-2024 indicates a steady upward trend, setting a strong foundation for future growth.
Dominant Regions, Countries, or Segments in Hydroponics Nutrients Industry
North America, particularly the United States, is emerging as a dominant region in the hydroponics nutrients industry, fueled by extensive government support for agricultural innovation and a thriving market for CEA. The region's strong economic policies, coupled with significant investments in research and development, have fostered a robust ecosystem for soilless farming. Production analysis in North America is significantly driven by large-scale commercial operations, while consumption analysis reveals a growing demand from both commercial and emerging urban farming initiatives.
- Production Analysis: Leading in the production of advanced hydroponic nutrient formulations, driven by technological capabilities and R&D investment.
- Consumption Analysis: High consumption rates due to the widespread adoption of commercial hydroponic farms and a growing interest in home gardening solutions.
- Import Market Analysis (Value & Volume): Imports are substantial, catering to specialized nutrient needs and smaller-scale operations, valued at $X,XXX Million and X,XXX Million units in 2025.
- Export Market Analysis (Value & Volume): North America is also a significant exporter of specialized hydroponic nutrient solutions, valued at $X,XXX Million and X,XXX Million units in 2025, reaching markets globally.
- Price Trend Analysis: Stable to slightly increasing price trends, influenced by raw material costs and the introduction of premium, specialized nutrient blends.
- Dominance Factors: Economic policies promoting CEA, advanced infrastructure for nutrient manufacturing and distribution, and a strong consumer base demanding fresh, locally grown produce.
Hydroponics Nutrients Industry Product Landscape
The hydroponics nutrients market is characterized by a diverse and innovative product landscape. Innovations focus on tailored nutrient solutions for specific crops and growth stages, including macro and micronutrient formulations, pH adjusters, and specialized supplements like bio-stimulants and growth enhancers. These products are designed to optimize plant health, accelerate growth, and improve crop yields in soilless environments. Performance metrics are centered on nutrient uptake efficiency, plant resilience, and overall produce quality. Unique selling propositions often lie in the purity of ingredients, customizability of blends, and the provision of comprehensive nutrient management support. Technological advancements are leading to the development of water-soluble powders, liquid concentrates, and slow-release nutrient delivery systems, all aimed at enhancing grower convenience and effectiveness.
Key Drivers, Barriers & Challenges in Hydroponics Nutrients Industry
The hydroponics nutrients industry is propelled by several key drivers, including the global need for sustainable food production, increasing urbanization, and advancements in CEA technologies. Government incentives for soilless farming and a growing consumer preference for pesticide-free produce further fuel market expansion.
- Key Drivers:
- Growing demand for food security and sustainable agriculture.
- Rapid urbanization leading to limited arable land.
- Technological advancements in hydroponic systems and nutrient formulations.
- Consumer demand for fresh, locally grown, and pesticide-free produce.
- Favorable government policies and investments in CEA.
The industry faces certain barriers and challenges that can impede its growth trajectory. High initial setup costs for hydroponic systems can be a deterrent for some potential growers. Supply chain complexities, particularly for specialized raw materials, can lead to price volatility and availability issues. Navigating diverse and evolving regulatory landscapes across different regions also presents a challenge. Intense competition among nutrient manufacturers, with price sensitivity being a factor for some market segments, adds to the pressure.
- Key Barriers & Challenges:
- High initial investment costs for hydroponic systems.
- Supply chain vulnerabilities for raw materials and logistical hurdles.
- Complex and evolving regulatory frameworks.
- Price competition and the need for cost-effective solutions.
- Educating new growers on proper nutrient management.
Emerging Opportunities in Hydroponics Nutrients Industry
Emerging opportunities within the hydroponics nutrients sector are abundant, driven by innovation and evolving market demands. The development of advanced, bio-based nutrient solutions and the integration of AI for personalized nutrient recommendations represent significant growth avenues. Untapped markets in developing economies seeking to improve local food production also offer substantial potential. Furthermore, the increasing focus on vertical farming and controlled environment agriculture in urban settings is creating a continuous demand for specialized hydroponic nutrients tailored to specific crops and indoor conditions. The demand for nutrient solutions that enhance the nutritional profile and shelf-life of produce is also a growing area of opportunity.
Growth Accelerators in the Hydroponics Nutrients Industry Industry
Long-term growth in the hydroponics nutrients industry will be significantly accelerated by continuous technological breakthroughs, such as the development of next-generation nutrient delivery systems and highly efficient, environmentally friendly formulations. Strategic partnerships between nutrient manufacturers, equipment providers, and research institutions will foster innovation and market penetration. Expansion into emerging markets with supportive agricultural policies and a growing awareness of the benefits of soilless farming will also be critical growth catalysts. The increasing adoption of data analytics and precision agriculture techniques in hydroponics will further optimize nutrient use and drive efficiency, leading to greater adoption and market expansion.
Key Players Shaping the Hydroponics Nutrients Industry Market
- General Hydroponics
- LushGro
- Am hydro
- American Hydroponics (AMHYDRO)
- HydroGarden Ltd (VitaLink)
- Advanced Hydroponics of Holland
- Nutrifield
- Emerald Harvest
- Watercircle hydroponics pte ltd
- X Nutrients
Notable Milestones in Hydroponics Nutrients Industry Sector
- 2019: Increased focus on micronutrient-rich formulations for specialty crops.
- 2020: Rise in demand for organic and sustainable hydroponic nutrient options.
- 2021: Launch of AI-powered nutrient management systems by several key players.
- 2022: Expansion of hydroponic nutrient offerings for vertical farming applications.
- 2023: Significant investment in R&D for bio-stimulant enhanced nutrient solutions.
- 2024: Growing market adoption of pre-mixed nutrient solutions for home growers.
In-Depth Hydroponics Nutrients Industry Market Outlook
The future outlook for the hydroponics nutrients industry remains exceptionally bright, driven by its crucial role in addressing global food security and sustainability challenges. Growth accelerators such as cutting-edge research in plant nutrition, the widespread adoption of precision agriculture techniques within CEA, and strategic collaborations will propel the market forward. The increasing consumer demand for healthy, locally sourced produce and supportive government policies further solidify the industry's upward trajectory. Strategic market expansion into developing regions and the continuous innovation in product offerings to cater to diverse crop needs and grower preferences will define the landscape, presenting substantial opportunities for continued growth and profitability. The market is projected to reach $XX,XXX Million by 2033, indicating sustained robust expansion.
Hydroponics Nutrients Industry Segmentation
- 1. Production Analysis
- 2. Consumption Analysis
- 3. Import Market Analysis (Value & Volume)
- 4. Export Market Analysis (Value & Volume)
- 5. Price Trend Analysis
Hydroponics Nutrients Industry Segmentation By Geography
-
1. North America
- 1.1. United States
- 1.2. Canada
- 1.3. Mexico
-
2. South America
- 2.1. Brazil
- 2.2. Argentina
- 2.3. Rest of South America
-
3. Europe
- 3.1. United Kingdom
- 3.2. Germany
- 3.3. France
- 3.4. Italy
- 3.5. Spain
- 3.6. Russia
- 3.7. Benelux
- 3.8. Nordics
- 3.9. Rest of Europe
-
4. Middle East & Africa
- 4.1. Turkey
- 4.2. Israel
- 4.3. GCC
- 4.4. North Africa
- 4.5. South Africa
- 4.6. Rest of Middle East & Africa
-
5. Asia Pacific
- 5.1. China
- 5.2. India
- 5.3. Japan
- 5.4. South Korea
- 5.5. ASEAN
- 5.6. Oceania
- 5.7. Rest of Asia Pacific
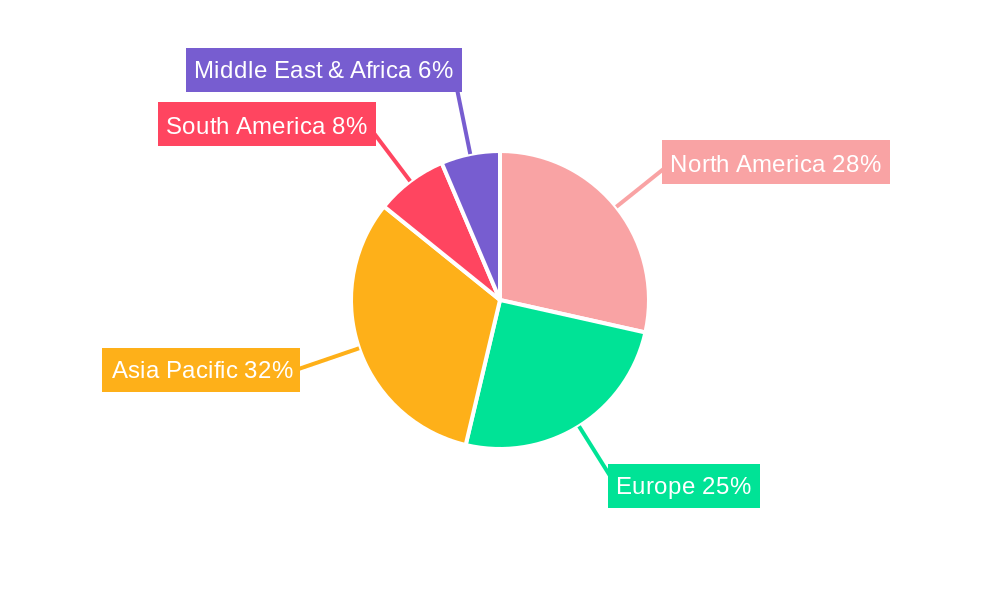
Hydroponics Nutrients Industry Regional Market Share
Geographic Coverage of Hydroponics Nutrients Industry
Hydroponics Nutrients Industry REPORT HIGHLIGHTS
| Aspects | Details |
|---|---|
| Study Period | 2020-2034 |
| Base Year | 2025 |
| Estimated Year | 2026 |
| Forecast Period | 2026-2034 |
| Historical Period | 2020-2025 |
| Growth Rate | CAGR of 8.80% from 2020-2034 |
| Segmentation |
|
Table of Contents
- 1. Introduction
- 1.1. Research Scope
- 1.2. Market Segmentation
- 1.3. Research Objective
- 1.4. Definitions and Assumptions
- 2. Executive Summary
- 2.1. Market Snapshot
- 3. Market Dynamics
- 3.1. Market Drivers
- 3.2. Market Restrains
- 3.3. Market Trends
- 3.4. Market Opportunities
- 4. Market Factor Analysis
- 4.1. Porters Five Forces
- 4.1.1. Bargaining Power of Suppliers
- 4.1.2. Bargaining Power of Buyers
- 4.1.3. Threat of New Entrants
- 4.1.4. Threat of Substitutes
- 4.1.5. Competitive Rivalry
- 4.2. PESTEL analysis
- 4.3. BCG Analysis
- 4.3.1. Stars (High Growth, High Market Share)
- 4.3.2. Cash Cows (Low Growth, High Market Share)
- 4.3.3. Question Mark (High Growth, Low Market Share)
- 4.3.4. Dogs (Low Growth, Low Market Share)
- 4.4. Ansoff Matrix Analysis
- 4.5. Supply Chain Analysis
- 4.6. Regulatory Landscape
- 4.7. Current Market Potential and Opportunity Assessment (TAM–SAM–SOM Framework)
- 4.8. NRP Analyst Note
- 4.1. Porters Five Forces
- 5. Market Analysis, Insights and Forecast 2021-2033
- 5.1. Market Analysis, Insights and Forecast - by Production Analysis
- 5.2. Market Analysis, Insights and Forecast - by Consumption Analysis
- 5.3. Market Analysis, Insights and Forecast - by Import Market Analysis (Value & Volume)
- 5.4. Market Analysis, Insights and Forecast - by Export Market Analysis (Value & Volume)
- 5.5. Market Analysis, Insights and Forecast - by Price Trend Analysis
- 5.6. Market Analysis, Insights and Forecast - by Region
- 5.6.1. North America
- 5.6.2. South America
- 5.6.3. Europe
- 5.6.4. Middle East & Africa
- 5.6.5. Asia Pacific
- 6. Global Hydroponics Nutrients Industry Analysis, Insights and Forecast, 2021-2033
- 6.1. Market Analysis, Insights and Forecast - by Production Analysis
- 6.2. Market Analysis, Insights and Forecast - by Consumption Analysis
- 6.3. Market Analysis, Insights and Forecast - by Import Market Analysis (Value & Volume)
- 6.4. Market Analysis, Insights and Forecast - by Export Market Analysis (Value & Volume)
- 6.5. Market Analysis, Insights and Forecast - by Price Trend Analysis
- 7. North America Hydroponics Nutrients Industry Analysis, Insights and Forecast, 2020-2032
- 7.1. Market Analysis, Insights and Forecast - by Production Analysis
- 7.2. Market Analysis, Insights and Forecast - by Consumption Analysis
- 7.3. Market Analysis, Insights and Forecast - by Import Market Analysis (Value & Volume)
- 7.4. Market Analysis, Insights and Forecast - by Export Market Analysis (Value & Volume)
- 7.5. Market Analysis, Insights and Forecast - by Price Trend Analysis
- 8. South America Hydroponics Nutrients Industry Analysis, Insights and Forecast, 2020-2032
- 8.1. Market Analysis, Insights and Forecast - by Production Analysis
- 8.2. Market Analysis, Insights and Forecast - by Consumption Analysis
- 8.3. Market Analysis, Insights and Forecast - by Import Market Analysis (Value & Volume)
- 8.4. Market Analysis, Insights and Forecast - by Export Market Analysis (Value & Volume)
- 8.5. Market Analysis, Insights and Forecast - by Price Trend Analysis
- 9. Europe Hydroponics Nutrients Industry Analysis, Insights and Forecast, 2020-2032
- 9.1. Market Analysis, Insights and Forecast - by Production Analysis
- 9.2. Market Analysis, Insights and Forecast - by Consumption Analysis
- 9.3. Market Analysis, Insights and Forecast - by Import Market Analysis (Value & Volume)
- 9.4. Market Analysis, Insights and Forecast - by Export Market Analysis (Value & Volume)
- 9.5. Market Analysis, Insights and Forecast - by Price Trend Analysis
- 10. Middle East & Africa Hydroponics Nutrients Industry Analysis, Insights and Forecast, 2020-2032
- 10.1. Market Analysis, Insights and Forecast - by Production Analysis
- 10.2. Market Analysis, Insights and Forecast - by Consumption Analysis
- 10.3. Market Analysis, Insights and Forecast - by Import Market Analysis (Value & Volume)
- 10.4. Market Analysis, Insights and Forecast - by Export Market Analysis (Value & Volume)
- 10.5. Market Analysis, Insights and Forecast - by Price Trend Analysis
- 11. Asia Pacific Hydroponics Nutrients Industry Analysis, Insights and Forecast, 2020-2032
- 11.1. Market Analysis, Insights and Forecast - by Production Analysis
- 11.2. Market Analysis, Insights and Forecast - by Consumption Analysis
- 11.3. Market Analysis, Insights and Forecast - by Import Market Analysis (Value & Volume)
- 11.4. Market Analysis, Insights and Forecast - by Export Market Analysis (Value & Volume)
- 11.5. Market Analysis, Insights and Forecast - by Price Trend Analysis
- 12. Competitive Analysis
- 12.1. Company Profiles
- 12.1.1 General hydroponics
- 12.1.1.1. Company Overview
- 12.1.1.2. Products
- 12.1.1.3. Company Financials
- 12.1.1.4. SWOT Analysis
- 12.1.2 LushGro
- 12.1.2.1. Company Overview
- 12.1.2.2. Products
- 12.1.2.3. Company Financials
- 12.1.2.4. SWOT Analysis
- 12.1.3 Am hydro
- 12.1.3.1. Company Overview
- 12.1.3.2. Products
- 12.1.3.3. Company Financials
- 12.1.3.4. SWOT Analysis
- 12.1.4 American Hydroponics (AMHYDRO)
- 12.1.4.1. Company Overview
- 12.1.4.2. Products
- 12.1.4.3. Company Financials
- 12.1.4.4. SWOT Analysis
- 12.1.5 HydroGarden Ltd (VitaLink)*List Not Exhaustive
- 12.1.5.1. Company Overview
- 12.1.5.2. Products
- 12.1.5.3. Company Financials
- 12.1.5.4. SWOT Analysis
- 12.1.6 Advanced Hydroponics of Holland
- 12.1.6.1. Company Overview
- 12.1.6.2. Products
- 12.1.6.3. Company Financials
- 12.1.6.4. SWOT Analysis
- 12.1.7 Nutrifield
- 12.1.7.1. Company Overview
- 12.1.7.2. Products
- 12.1.7.3. Company Financials
- 12.1.7.4. SWOT Analysis
- 12.1.8 Emerald Harvest
- 12.1.8.1. Company Overview
- 12.1.8.2. Products
- 12.1.8.3. Company Financials
- 12.1.8.4. SWOT Analysis
- 12.1.9 Watercircle hydroponics pte ltd
- 12.1.9.1. Company Overview
- 12.1.9.2. Products
- 12.1.9.3. Company Financials
- 12.1.9.4. SWOT Analysis
- 12.1.10 X Nutrients
- 12.1.10.1. Company Overview
- 12.1.10.2. Products
- 12.1.10.3. Company Financials
- 12.1.10.4. SWOT Analysis
- 12.1.1 General hydroponics
- 12.2. Market Entropy
- 12.2.1 Company's Key Areas Served
- 12.2.2 Recent Developments
- 12.3. Company Market Share Analysis 2025
- 12.3.1 Top 5 Companies Market Share Analysis
- 12.3.2 Top 3 Companies Market Share Analysis
- 12.4. List of Potential Customers
- 13. Research Methodology
List of Figures
- Figure 1: Global Hydroponics Nutrients Industry Revenue Breakdown (Million, %) by Region 2025 & 2033
- Figure 2: North America Hydroponics Nutrients Industry Revenue (Million), by Production Analysis 2025 & 2033
- Figure 3: North America Hydroponics Nutrients Industry Revenue Share (%), by Production Analysis 2025 & 2033
- Figure 4: North America Hydroponics Nutrients Industry Revenue (Million), by Consumption Analysis 2025 & 2033
- Figure 5: North America Hydroponics Nutrients Industry Revenue Share (%), by Consumption Analysis 2025 & 2033
- Figure 6: North America Hydroponics Nutrients Industry Revenue (Million), by Import Market Analysis (Value & Volume) 2025 & 2033
- Figure 7: North America Hydroponics Nutrients Industry Revenue Share (%), by Import Market Analysis (Value & Volume) 2025 & 2033
- Figure 8: North America Hydroponics Nutrients Industry Revenue (Million), by Export Market Analysis (Value & Volume) 2025 & 2033
- Figure 9: North America Hydroponics Nutrients Industry Revenue Share (%), by Export Market Analysis (Value & Volume) 2025 & 2033
- Figure 10: North America Hydroponics Nutrients Industry Revenue (Million), by Price Trend Analysis 2025 & 2033
- Figure 11: North America Hydroponics Nutrients Industry Revenue Share (%), by Price Trend Analysis 2025 & 2033
- Figure 12: North America Hydroponics Nutrients Industry Revenue (Million), by Country 2025 & 2033
- Figure 13: North America Hydroponics Nutrients Industry Revenue Share (%), by Country 2025 & 2033
- Figure 14: South America Hydroponics Nutrients Industry Revenue (Million), by Production Analysis 2025 & 2033
- Figure 15: South America Hydroponics Nutrients Industry Revenue Share (%), by Production Analysis 2025 & 2033
- Figure 16: South America Hydroponics Nutrients Industry Revenue (Million), by Consumption Analysis 2025 & 2033
- Figure 17: South America Hydroponics Nutrients Industry Revenue Share (%), by Consumption Analysis 2025 & 2033
- Figure 18: South America Hydroponics Nutrients Industry Revenue (Million), by Import Market Analysis (Value & Volume) 2025 & 2033
- Figure 19: South America Hydroponics Nutrients Industry Revenue Share (%), by Import Market Analysis (Value & Volume) 2025 & 2033
- Figure 20: South America Hydroponics Nutrients Industry Revenue (Million), by Export Market Analysis (Value & Volume) 2025 & 2033
- Figure 21: South America Hydroponics Nutrients Industry Revenue Share (%), by Export Market Analysis (Value & Volume) 2025 & 2033
- Figure 22: South America Hydroponics Nutrients Industry Revenue (Million), by Price Trend Analysis 2025 & 2033
- Figure 23: South America Hydroponics Nutrients Industry Revenue Share (%), by Price Trend Analysis 2025 & 2033
- Figure 24: South America Hydroponics Nutrients Industry Revenue (Million), by Country 2025 & 2033
- Figure 25: South America Hydroponics Nutrients Industry Revenue Share (%), by Country 2025 & 2033
- Figure 26: Europe Hydroponics Nutrients Industry Revenue (Million), by Production Analysis 2025 & 2033
- Figure 27: Europe Hydroponics Nutrients Industry Revenue Share (%), by Production Analysis 2025 & 2033
- Figure 28: Europe Hydroponics Nutrients Industry Revenue (Million), by Consumption Analysis 2025 & 2033
- Figure 29: Europe Hydroponics Nutrients Industry Revenue Share (%), by Consumption Analysis 2025 & 2033
- Figure 30: Europe Hydroponics Nutrients Industry Revenue (Million), by Import Market Analysis (Value & Volume) 2025 & 2033
- Figure 31: Europe Hydroponics Nutrients Industry Revenue Share (%), by Import Market Analysis (Value & Volume) 2025 & 2033
- Figure 32: Europe Hydroponics Nutrients Industry Revenue (Million), by Export Market Analysis (Value & Volume) 2025 & 2033
- Figure 33: Europe Hydroponics Nutrients Industry Revenue Share (%), by Export Market Analysis (Value & Volume) 2025 & 2033
- Figure 34: Europe Hydroponics Nutrients Industry Revenue (Million), by Price Trend Analysis 2025 & 2033
- Figure 35: Europe Hydroponics Nutrients Industry Revenue Share (%), by Price Trend Analysis 2025 & 2033
- Figure 36: Europe Hydroponics Nutrients Industry Revenue (Million), by Country 2025 & 2033
- Figure 37: Europe Hydroponics Nutrients Industry Revenue Share (%), by Country 2025 & 2033
- Figure 38: Middle East & Africa Hydroponics Nutrients Industry Revenue (Million), by Production Analysis 2025 & 2033
- Figure 39: Middle East & Africa Hydroponics Nutrients Industry Revenue Share (%), by Production Analysis 2025 & 2033
- Figure 40: Middle East & Africa Hydroponics Nutrients Industry Revenue (Million), by Consumption Analysis 2025 & 2033
- Figure 41: Middle East & Africa Hydroponics Nutrients Industry Revenue Share (%), by Consumption Analysis 2025 & 2033
- Figure 42: Middle East & Africa Hydroponics Nutrients Industry Revenue (Million), by Import Market Analysis (Value & Volume) 2025 & 2033
- Figure 43: Middle East & Africa Hydroponics Nutrients Industry Revenue Share (%), by Import Market Analysis (Value & Volume) 2025 & 2033
- Figure 44: Middle East & Africa Hydroponics Nutrients Industry Revenue (Million), by Export Market Analysis (Value & Volume) 2025 & 2033
- Figure 45: Middle East & Africa Hydroponics Nutrients Industry Revenue Share (%), by Export Market Analysis (Value & Volume) 2025 & 2033
- Figure 46: Middle East & Africa Hydroponics Nutrients Industry Revenue (Million), by Price Trend Analysis 2025 & 2033
- Figure 47: Middle East & Africa Hydroponics Nutrients Industry Revenue Share (%), by Price Trend Analysis 2025 & 2033
- Figure 48: Middle East & Africa Hydroponics Nutrients Industry Revenue (Million), by Country 2025 & 2033
- Figure 49: Middle East & Africa Hydroponics Nutrients Industry Revenue Share (%), by Country 2025 & 2033
- Figure 50: Asia Pacific Hydroponics Nutrients Industry Revenue (Million), by Production Analysis 2025 & 2033
- Figure 51: Asia Pacific Hydroponics Nutrients Industry Revenue Share (%), by Production Analysis 2025 & 2033
- Figure 52: Asia Pacific Hydroponics Nutrients Industry Revenue (Million), by Consumption Analysis 2025 & 2033
- Figure 53: Asia Pacific Hydroponics Nutrients Industry Revenue Share (%), by Consumption Analysis 2025 & 2033
- Figure 54: Asia Pacific Hydroponics Nutrients Industry Revenue (Million), by Import Market Analysis (Value & Volume) 2025 & 2033
- Figure 55: Asia Pacific Hydroponics Nutrients Industry Revenue Share (%), by Import Market Analysis (Value & Volume) 2025 & 2033
- Figure 56: Asia Pacific Hydroponics Nutrients Industry Revenue (Million), by Export Market Analysis (Value & Volume) 2025 & 2033
- Figure 57: Asia Pacific Hydroponics Nutrients Industry Revenue Share (%), by Export Market Analysis (Value & Volume) 2025 & 2033
- Figure 58: Asia Pacific Hydroponics Nutrients Industry Revenue (Million), by Price Trend Analysis 2025 & 2033
- Figure 59: Asia Pacific Hydroponics Nutrients Industry Revenue Share (%), by Price Trend Analysis 2025 & 2033
- Figure 60: Asia Pacific Hydroponics Nutrients Industry Revenue (Million), by Country 2025 & 2033
- Figure 61: Asia Pacific Hydroponics Nutrients Industry Revenue Share (%), by Country 2025 & 2033
List of Tables
- Table 1: Global Hydroponics Nutrients Industry Revenue Million Forecast, by Production Analysis 2020 & 2033
- Table 2: Global Hydroponics Nutrients Industry Revenue Million Forecast, by Consumption Analysis 2020 & 2033
- Table 3: Global Hydroponics Nutrients Industry Revenue Million Forecast, by Import Market Analysis (Value & Volume) 2020 & 2033
- Table 4: Global Hydroponics Nutrients Industry Revenue Million Forecast, by Export Market Analysis (Value & Volume) 2020 & 2033
- Table 5: Global Hydroponics Nutrients Industry Revenue Million Forecast, by Price Trend Analysis 2020 & 2033
- Table 6: Global Hydroponics Nutrients Industry Revenue Million Forecast, by Region 2020 & 2033
- Table 7: Global Hydroponics Nutrients Industry Revenue Million Forecast, by Production Analysis 2020 & 2033
- Table 8: Global Hydroponics Nutrients Industry Revenue Million Forecast, by Consumption Analysis 2020 & 2033
- Table 9: Global Hydroponics Nutrients Industry Revenue Million Forecast, by Import Market Analysis (Value & Volume) 2020 & 2033
- Table 10: Global Hydroponics Nutrients Industry Revenue Million Forecast, by Export Market Analysis (Value & Volume) 2020 & 2033
- Table 11: Global Hydroponics Nutrients Industry Revenue Million Forecast, by Price Trend Analysis 2020 & 2033
- Table 12: Global Hydroponics Nutrients Industry Revenue Million Forecast, by Country 2020 & 2033
- Table 13: United States Hydroponics Nutrients Industry Revenue (Million) Forecast, by Application 2020 & 2033
- Table 14: Canada Hydroponics Nutrients Industry Revenue (Million) Forecast, by Application 2020 & 2033
- Table 15: Mexico Hydroponics Nutrients Industry Revenue (Million) Forecast, by Application 2020 & 2033
- Table 16: Global Hydroponics Nutrients Industry Revenue Million Forecast, by Production Analysis 2020 & 2033
- Table 17: Global Hydroponics Nutrients Industry Revenue Million Forecast, by Consumption Analysis 2020 & 2033
- Table 18: Global Hydroponics Nutrients Industry Revenue Million Forecast, by Import Market Analysis (Value & Volume) 2020 & 2033
- Table 19: Global Hydroponics Nutrients Industry Revenue Million Forecast, by Export Market Analysis (Value & Volume) 2020 & 2033
- Table 20: Global Hydroponics Nutrients Industry Revenue Million Forecast, by Price Trend Analysis 2020 & 2033
- Table 21: Global Hydroponics Nutrients Industry Revenue Million Forecast, by Country 2020 & 2033
- Table 22: Brazil Hydroponics Nutrients Industry Revenue (Million) Forecast, by Application 2020 & 2033
- Table 23: Argentina Hydroponics Nutrients Industry Revenue (Million) Forecast, by Application 2020 & 2033
- Table 24: Rest of South America Hydroponics Nutrients Industry Revenue (Million) Forecast, by Application 2020 & 2033
- Table 25: Global Hydroponics Nutrients Industry Revenue Million Forecast, by Production Analysis 2020 & 2033
- Table 26: Global Hydroponics Nutrients Industry Revenue Million Forecast, by Consumption Analysis 2020 & 2033
- Table 27: Global Hydroponics Nutrients Industry Revenue Million Forecast, by Import Market Analysis (Value & Volume) 2020 & 2033
- Table 28: Global Hydroponics Nutrients Industry Revenue Million Forecast, by Export Market Analysis (Value & Volume) 2020 & 2033
- Table 29: Global Hydroponics Nutrients Industry Revenue Million Forecast, by Price Trend Analysis 2020 & 2033
- Table 30: Global Hydroponics Nutrients Industry Revenue Million Forecast, by Country 2020 & 2033
- Table 31: United Kingdom Hydroponics Nutrients Industry Revenue (Million) Forecast, by Application 2020 & 2033
- Table 32: Germany Hydroponics Nutrients Industry Revenue (Million) Forecast, by Application 2020 & 2033
- Table 33: France Hydroponics Nutrients Industry Revenue (Million) Forecast, by Application 2020 & 2033
- Table 34: Italy Hydroponics Nutrients Industry Revenue (Million) Forecast, by Application 2020 & 2033
- Table 35: Spain Hydroponics Nutrients Industry Revenue (Million) Forecast, by Application 2020 & 2033
- Table 36: Russia Hydroponics Nutrients Industry Revenue (Million) Forecast, by Application 2020 & 2033
- Table 37: Benelux Hydroponics Nutrients Industry Revenue (Million) Forecast, by Application 2020 & 2033
- Table 38: Nordics Hydroponics Nutrients Industry Revenue (Million) Forecast, by Application 2020 & 2033
- Table 39: Rest of Europe Hydroponics Nutrients Industry Revenue (Million) Forecast, by Application 2020 & 2033
- Table 40: Global Hydroponics Nutrients Industry Revenue Million Forecast, by Production Analysis 2020 & 2033
- Table 41: Global Hydroponics Nutrients Industry Revenue Million Forecast, by Consumption Analysis 2020 & 2033
- Table 42: Global Hydroponics Nutrients Industry Revenue Million Forecast, by Import Market Analysis (Value & Volume) 2020 & 2033
- Table 43: Global Hydroponics Nutrients Industry Revenue Million Forecast, by Export Market Analysis (Value & Volume) 2020 & 2033
- Table 44: Global Hydroponics Nutrients Industry Revenue Million Forecast, by Price Trend Analysis 2020 & 2033
- Table 45: Global Hydroponics Nutrients Industry Revenue Million Forecast, by Country 2020 & 2033
- Table 46: Turkey Hydroponics Nutrients Industry Revenue (Million) Forecast, by Application 2020 & 2033
- Table 47: Israel Hydroponics Nutrients Industry Revenue (Million) Forecast, by Application 2020 & 2033
- Table 48: GCC Hydroponics Nutrients Industry Revenue (Million) Forecast, by Application 2020 & 2033
- Table 49: North Africa Hydroponics Nutrients Industry Revenue (Million) Forecast, by Application 2020 & 2033
- Table 50: South Africa Hydroponics Nutrients Industry Revenue (Million) Forecast, by Application 2020 & 2033
- Table 51: Rest of Middle East & Africa Hydroponics Nutrients Industry Revenue (Million) Forecast, by Application 2020 & 2033
- Table 52: Global Hydroponics Nutrients Industry Revenue Million Forecast, by Production Analysis 2020 & 2033
- Table 53: Global Hydroponics Nutrients Industry Revenue Million Forecast, by Consumption Analysis 2020 & 2033
- Table 54: Global Hydroponics Nutrients Industry Revenue Million Forecast, by Import Market Analysis (Value & Volume) 2020 & 2033
- Table 55: Global Hydroponics Nutrients Industry Revenue Million Forecast, by Export Market Analysis (Value & Volume) 2020 & 2033
- Table 56: Global Hydroponics Nutrients Industry Revenue Million Forecast, by Price Trend Analysis 2020 & 2033
- Table 57: Global Hydroponics Nutrients Industry Revenue Million Forecast, by Country 2020 & 2033
- Table 58: China Hydroponics Nutrients Industry Revenue (Million) Forecast, by Application 2020 & 2033
- Table 59: India Hydroponics Nutrients Industry Revenue (Million) Forecast, by Application 2020 & 2033
- Table 60: Japan Hydroponics Nutrients Industry Revenue (Million) Forecast, by Application 2020 & 2033
- Table 61: South Korea Hydroponics Nutrients Industry Revenue (Million) Forecast, by Application 2020 & 2033
- Table 62: ASEAN Hydroponics Nutrients Industry Revenue (Million) Forecast, by Application 2020 & 2033
- Table 63: Oceania Hydroponics Nutrients Industry Revenue (Million) Forecast, by Application 2020 & 2033
- Table 64: Rest of Asia Pacific Hydroponics Nutrients Industry Revenue (Million) Forecast, by Application 2020 & 2033
Frequently Asked Questions
1. What is the projected Compound Annual Growth Rate (CAGR) of the Hydroponics Nutrients Industry?
The projected CAGR is approximately 8.80%.
2. Which companies are prominent players in the Hydroponics Nutrients Industry?
Key companies in the market include General hydroponics, LushGro, Am hydro, American Hydroponics (AMHYDRO), HydroGarden Ltd (VitaLink)*List Not Exhaustive, Advanced Hydroponics of Holland, Nutrifield, Emerald Harvest, Watercircle hydroponics pte ltd, X Nutrients.
3. What are the main segments of the Hydroponics Nutrients Industry?
The market segments include Production Analysis, Consumption Analysis, Import Market Analysis (Value & Volume), Export Market Analysis (Value & Volume), Price Trend Analysis.
4. Can you provide details about the market size?
The market size is estimated to be USD XX Million as of 2022.
5. What are some drivers contributing to market growth?
Increasing Demand for Tomato; Adoption of Greenhouse Technology in Tomato Cultivation; Government support.
6. What are the notable trends driving market growth?
Hydroponics holds major share among various indoor farming systems..
7. Are there any restraints impacting market growth?
Increasing Loses due to Physiological Disorder. Pest and Disease; Unfavourable Climatic Condition.
8. Can you provide examples of recent developments in the market?
N/A
9. What pricing options are available for accessing the report?
Pricing options include single-user, multi-user, and enterprise licenses priced at USD 4750, USD 5250, and USD 8750 respectively.
10. Is the market size provided in terms of value or volume?
The market size is provided in terms of value, measured in Million.
11. Are there any specific market keywords associated with the report?
Yes, the market keyword associated with the report is "Hydroponics Nutrients Industry," which aids in identifying and referencing the specific market segment covered.
12. How do I determine which pricing option suits my needs best?
The pricing options vary based on user requirements and access needs. Individual users may opt for single-user licenses, while businesses requiring broader access may choose multi-user or enterprise licenses for cost-effective access to the report.
13. Are there any additional resources or data provided in the Hydroponics Nutrients Industry report?
While the report offers comprehensive insights, it's advisable to review the specific contents or supplementary materials provided to ascertain if additional resources or data are available.
14. How can I stay updated on further developments or reports in the Hydroponics Nutrients Industry?
To stay informed about further developments, trends, and reports in the Hydroponics Nutrients Industry, consider subscribing to industry newsletters, following relevant companies and organizations, or regularly checking reputable industry news sources and publications.
Methodology
Step 1 - Identification of Relevant Samples Size from Population Database


Step 2 - Approaches for Defining Global Market Size (Value, Volume* & Price*)

Note*: In applicable scenarios
Step 3 - Data Sources
Primary Research
- Web Analytics
- Survey Reports
- Research Institute
- Latest Research Reports
- Opinion Leaders
Secondary Research
- Annual Reports
- White Paper
- Latest Press Release
- Industry Association
- Paid Database
- Investor Presentations

Step 4 - Data Triangulation
Involves using different sources of information in order to increase the validity of a study
These sources are likely to be stakeholders in a program - participants, other researchers, program staff, other community members, and so on.
Then we put all data in single framework & apply various statistical tools to find out the dynamic on the market.
During the analysis stage, feedback from the stakeholder groups would be compared to determine areas of agreement as well as areas of divergence