

Key Insights
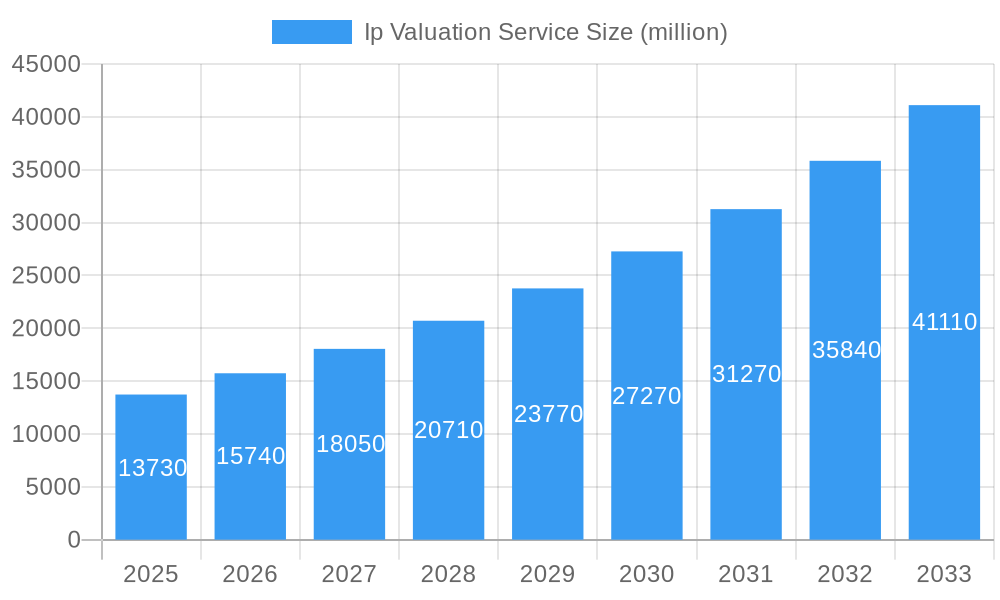
The Intellectual Property (IP) Valuation Service market is poised for substantial expansion, with a current market size estimated at $13,730 million. This robust growth is projected to continue at a Compound Annual Growth Rate (CAGR) of 14.7% over the forecast period (2025-2033). This accelerated pace indicates a dynamic market driven by increasing recognition of IP as a critical corporate asset and a significant contributor to financial value. The primary drivers fueling this growth include the escalating importance of intangible assets in mergers and acquisitions (M&A), the rising number of patent filings globally, and the growing demand for IP to secure funding and facilitate licensing agreements. Furthermore, the trend towards digital transformation across industries is generating new forms of IP, such as software, data, and algorithms, all of which require expert valuation. Regulatory shifts and the increasing focus on IP monetization strategies by corporations are also significant contributors to market expansion.
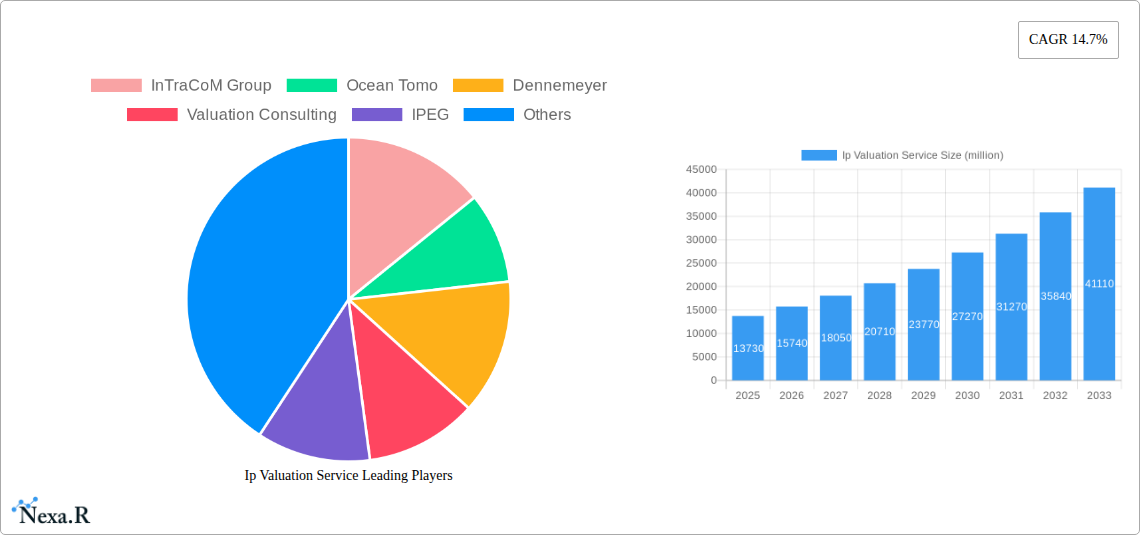
Ip Valuation Service Market Size (In Billion)
The IP Valuation Service market encompasses a broad spectrum of applications, from personal IP protection to enterprise-level strategic asset management. Key application segments include Personal and Enterprise, catering to individual inventors, startups, and large corporations alike. By type, the market is segmented into Patent, Trademark, Copyright, and Others, reflecting the diverse nature of IP assets that necessitate professional appraisal. Geographically, North America and Europe are currently leading the market, driven by established legal frameworks and a mature IP ecosystem. However, the Asia Pacific region is anticipated to witness the fastest growth, fueled by its burgeoning innovation landscape and increasing cross-border IP transactions. While the market's trajectory is overwhelmingly positive, potential restraints such as the complexity of valuation methodologies, the need for specialized expertise, and varying regulatory environments across jurisdictions could present challenges. Nevertheless, the inherent value creation and strategic advantages derived from accurate IP valuation are expected to outweigh these obstacles, solidifying its importance in the global business landscape.
Ip Valuation Service Company Market Share
This in-depth report provides a thorough analysis of the global IP Valuation Service Market, offering critical insights into its dynamics, growth trajectory, and future potential. Covering the period from 2019 to 2033, with a base year of 2025 and a forecast period extending to 2033, this report is an essential resource for industry professionals seeking to understand market concentration, innovation drivers, regulatory landscapes, and competitive strategies. We meticulously examine the parent and child markets to offer a holistic view, presenting all quantitative values in millions of units for clarity and strategic decision-making.
IP Valuation Service Market Dynamics & Structure
The IP Valuation Service market exhibits a moderate concentration, with a blend of established players and emerging specialists. Technological innovation, particularly in data analytics and AI-driven valuation methodologies, is a significant driver, enabling more precise and efficient IP assessments. The regulatory framework surrounding intellectual property rights and their monetization continues to evolve, impacting valuation practices and demand for services. Competitive product substitutes, while present in the form of in-house valuation capabilities or generalized financial advisory services, are largely outmatched by the specialized expertise offered by dedicated IP valuation firms. End-user demographics span a wide spectrum, from individual inventors and startups to large enterprises across diverse industries seeking to leverage their intangible assets for funding, M&A, or strategic decision-making. Mergers and Acquisitions (M&A) trends in the market are indicative of consolidation and the pursuit of expanded service portfolios and geographical reach.
- Market Concentration: Moderate, with key players vying for market share through specialized offerings.
- Technological Innovation Drivers: AI, machine learning, big data analytics for enhanced valuation accuracy and efficiency.
- Regulatory Frameworks: Evolving IP laws, tax policies, and international treaty updates influencing valuation standards.
- Competitive Product Substitutes: In-house valuation teams, general financial advisory services, and basic intellectual property management tools.
- End-User Demographics: Startups, SMEs, large corporations, R&D institutions, patent holding companies.
- M&A Trends: Strategic acquisitions to enhance service offerings, expand client base, and achieve economies of scale, with xx deals observed in the historical period.
IP Valuation Service Growth Trends & Insights
The IP Valuation Service Market has witnessed robust growth, driven by the increasing recognition of intellectual property as a critical business asset. The market size has evolved significantly, from an estimated XX million in 2019 to an anticipated XX million by 2025, projecting a Compound Annual Growth Rate (CAGR) of approximately X.XX% over the forecast period (2025-2033). Adoption rates for professional IP valuation services are on an upward trajectory, fueled by a growing need for accurate asset valuation for financial reporting, litigation support, licensing, and strategic investment decisions. Technological disruptions, including advancements in blockchain for IP tracking and AI for predictive analytics, are reshaping how IP is valued, leading to more sophisticated and data-driven approaches. Consumer behavior shifts are also playing a crucial role; businesses are increasingly proactive in understanding and monetizing their intangible assets, leading to a greater demand for specialized valuation expertise. This evolution in business strategy, coupled with the growing complexity of global IP landscapes, necessitates expert guidance for accurate and defensible valuations. The market penetration of specialized IP valuation services is expected to deepen as more companies embrace the strategic importance of their intellectual capital, moving beyond traditional tangible asset assessments.
- Market Size Evolution: From an estimated XX million in 2019 to an anticipated XX million by 2025, with projections to reach XX million by 2033.
- Adoption Rates: Steadily increasing as businesses recognize the strategic and financial importance of IP.
- Technological Disruptions: AI, blockchain, advanced data analytics are revolutionizing valuation methodologies.
- Consumer Behavior Shifts: Proactive IP monetization, increased reliance on IP for funding and competitive advantage.
- Market Penetration: Growing significantly across various industries and company sizes.
- CAGR (2025-2033): Estimated at X.XX% per annum.
Dominant Regions, Countries, or Segments in IP Valuation Service
The Enterprise segment within the IP Valuation Service Market demonstrates dominant growth, driven by the substantial IP portfolios and complex financial structures of large organizations. This dominance is further amplified by the Patent type of IP, which typically holds the highest intrinsic value and requires specialized valuation expertise. Geographically, North America, particularly the United States, currently leads the market due to its robust innovation ecosystem, well-established legal framework for IP protection, and a high concentration of technology-driven industries. Key drivers for this dominance include significant venture capital funding, a culture of innovation, and the active pursuit of IP monetization strategies by corporations. Economic policies that encourage R&D investment and protect intellectual property rights further bolster the market’s strength in this region.
- Dominant Segment (Application): Enterprise, accounting for an estimated XX% of the market.
- Dominant Segment (Type): Patent, representing approximately XX% of valuation services.
- Leading Region: North America, with the United States as the primary market.
- Key Drivers in North America: Strong innovation ecosystem, active venture capital landscape, robust IP legal framework, and proactive corporate IP strategies.
- Market Share in North America: Estimated at XX% of the global market.
- Growth Potential in Other Regions: Asia-Pacific is emerging as a significant growth region due to increasing R&D investments and a burgeoning IP landscape.
IP Valuation Service Product Landscape
The IP Valuation Service market is characterized by a sophisticated product landscape encompassing a range of methodologies and technological integrations. Services are tailored to specific IP types, including patents, trademarks, and copyrights, each requiring distinct valuation approaches. Innovations focus on enhancing accuracy, efficiency, and defensibility of valuations. Unique selling propositions often lie in the depth of industry-specific expertise, proprietary valuation models, and the ability to integrate with clients' existing financial and IP management systems. Technological advancements are increasingly incorporating AI and machine learning to analyze vast datasets, identify market trends, and predict future revenue streams attributable to IP assets, leading to more dynamic and data-driven valuations.
- Methodologies: Cost, market, and income approaches, often combined for comprehensive analysis.
- Technological Advancements: AI-powered data analysis, predictive modeling, and blockchain integration for IP tracking.
- Service Customization: Tailored valuations for litigation, licensing, M&A, financial reporting, and strategic planning.
- Focus Areas: Detailed analysis of patent claims, trademark brand equity, and copyright revenue potential.
Key Drivers, Barriers & Challenges in IP Valuation Service
The IP Valuation Service Market is propelled by several key drivers. The escalating value of intangible assets in today's knowledge economy is paramount. Increased M&A activity and the need for accurate financial reporting under evolving accounting standards (e.g., IFRS 3 and ASC 805) further fuel demand. Furthermore, the growing sophistication of patent litigation and the rise of IP-backed financing mechanisms create a persistent need for expert valuation.
However, several barriers and challenges exist. A significant challenge is the inherent subjectivity in IP valuation, making it difficult to achieve universally agreed-upon figures. Regulatory complexities and varying international IP laws can create discrepancies and hinder cross-border valuations. The shortage of highly skilled IP valuation professionals with a blend of technical, legal, and financial expertise also presents a restraint. Supply chain issues, while less direct, can impact the underlying industries whose IP is being valued, indirectly affecting the market.
- Key Drivers: Growing recognition of IP as a core asset, increased M&A activity, stringent financial reporting requirements, and the rise of IP-backed financing.
- Barriers & Challenges: Subjectivity in valuation, regulatory inconsistencies, scarcity of skilled professionals, and the time-consuming nature of thorough IP analysis.
Emerging Opportunities in IP Valuation Service
Emerging opportunities in the IP Valuation Service sector lie in the burgeoning fields of biotechnology, artificial intelligence, and renewable energy, where novel and valuable intellectual property is constantly being generated. The increasing demand for IP due diligence in cross-border M&A transactions, particularly from emerging economies, presents a significant growth avenue. Furthermore, the development of standardized AI-driven valuation platforms that can offer quicker, more cost-effective preliminary assessments for a wider range of clients, including startups and SMEs, holds substantial untapped market potential. The growing trend of open innovation and collaborative research also creates opportunities for valuing jointly developed IP.
- Untapped Markets: Biotechnology, AI, renewable energy, and emerging economies.
- Innovative Applications: IP due diligence for cross-border M&A, AI-powered preliminary valuations.
- Evolving Consumer Preferences: Demand for faster, more accessible, and data-driven valuation insights.
Growth Accelerators in the IP Valuation Service Industry
The IP Valuation Service industry is experiencing significant growth acceleration through several catalysts. Technological breakthroughs, particularly in AI and machine learning, are enhancing the accuracy and efficiency of valuation models, allowing for more complex data analysis and predictive capabilities. Strategic partnerships between IP law firms, financial institutions, and valuation consultancies are expanding service offerings and client reach. Market expansion strategies, including the development of specialized services for niche industries and geographical markets, are further driving growth. The increasing global emphasis on innovation and R&D investment by governments and corporations worldwide also serves as a fundamental accelerator for the IP valuation sector.
- Technological Breakthroughs: AI, machine learning for sophisticated valuation models.
- Strategic Partnerships: Collaborations between legal, financial, and valuation experts.
- Market Expansion: Specialized services for niche industries and new geographical territories.
Key Players Shaping the IP Valuation Service Market
- InTraCoM Group
- Ocean Tomo
- Dennemeyer
- Valuation Consulting
- IPEG
- OxFirst
- Kroll
- Hilco Valuation
- Barker Brettell
- Adastra
- Deloitte
- Parallel North IP
- Metis Partners
- Valuing IP
- Venner Shipley LLP
- CRA
- GHB Intellect
- Nevium
- Foresight Valuation
- Moss Adams
- Aranca
- Kashish
- EisnerAmper
- Stout
- Spring Galaxy
- Vincents
- Tee IP
- Hemming Morse
- Redwood
- EXCELON IP
- Mathys & Squire LLP
- Especia
- Schweiger & Partners
- Brainiac IP Solutions
- Pellegrino and Associates
- FIN IP Group
Notable Milestones in IP Valuation Service Sector
- 2020: Increased demand for IP valuations for litigation support and patent assertion.
- 2021: Advent of AI-powered analytics in IP valuation tools, enhancing speed and accuracy.
- 2022: Rise in IP-backed financing and securitization, driving demand for robust valuations.
- 2023: Growing focus on intangible asset valuation for ESG (Environmental, Social, and Governance) reporting.
- 2024: Expansion of valuation services into emerging technology sectors like quantum computing and advanced AI.
In-Depth IP Valuation Service Market Outlook
The future outlook for the IP Valuation Service market is exceptionally strong, poised for sustained and accelerated growth. Key accelerators, including rapid technological advancements in AI and data analytics, are empowering more sophisticated and efficient valuation methodologies. The increasing global emphasis on innovation and R&D, coupled with the strategic importance of intellectual property in driving competitive advantage and economic value, will continue to fuel demand. Furthermore, the ongoing wave of M&A activities and the growing trend of IP monetization across diverse industries present substantial strategic opportunities for service providers. As businesses increasingly recognize IP not just as a legal right but as a critical financial asset, the demand for expert, reliable, and defensible IP valuations will only intensify, making this a dynamic and lucrative sector for the foreseeable future.
Ip Valuation Service Segmentation
-
1. Application
- 1.1. Personal
- 1.2. Enterprise
-
2. Type
- 2.1. Patent
- 2.2. Trademark
- 2.3. Copyright
- 2.4. Others
Ip Valuation Service Segmentation By Geography
-
1. North America
- 1.1. United States
- 1.2. Canada
- 1.3. Mexico
-
2. South America
- 2.1. Brazil
- 2.2. Argentina
- 2.3. Rest of South America
-
3. Europe
- 3.1. United Kingdom
- 3.2. Germany
- 3.3. France
- 3.4. Italy
- 3.5. Spain
- 3.6. Russia
- 3.7. Benelux
- 3.8. Nordics
- 3.9. Rest of Europe
-
4. Middle East & Africa
- 4.1. Turkey
- 4.2. Israel
- 4.3. GCC
- 4.4. North Africa
- 4.5. South Africa
- 4.6. Rest of Middle East & Africa
-
5. Asia Pacific
- 5.1. China
- 5.2. India
- 5.3. Japan
- 5.4. South Korea
- 5.5. ASEAN
- 5.6. Oceania
- 5.7. Rest of Asia Pacific
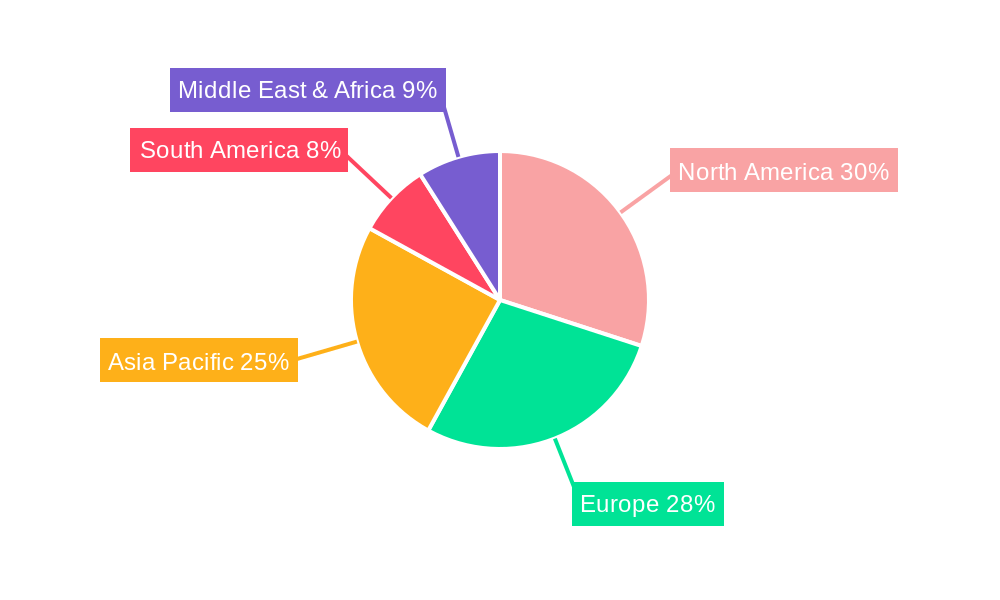
Ip Valuation Service Regional Market Share
Geographic Coverage of Ip Valuation Service
Ip Valuation Service REPORT HIGHLIGHTS
| Aspects | Details |
|---|---|
| Study Period | 2020-2034 |
| Base Year | 2025 |
| Estimated Year | 2026 |
| Forecast Period | 2026-2034 |
| Historical Period | 2020-2025 |
| Growth Rate | CAGR of 14.7% from 2020-2034 |
| Segmentation |
|
Table of Contents
- 1. Introduction
- 1.1. Research Scope
- 1.2. Market Segmentation
- 1.3. Research Objective
- 1.4. Definitions and Assumptions
- 2. Executive Summary
- 2.1. Market Snapshot
- 3. Market Dynamics
- 3.1. Market Drivers
- 3.2. Market Restrains
- 3.3. Market Trends
- 3.4. Market Opportunities
- 4. Market Factor Analysis
- 4.1. Porters Five Forces
- 4.1.1. Bargaining Power of Suppliers
- 4.1.2. Bargaining Power of Buyers
- 4.1.3. Threat of New Entrants
- 4.1.4. Threat of Substitutes
- 4.1.5. Competitive Rivalry
- 4.2. PESTEL analysis
- 4.3. BCG Analysis
- 4.3.1. Stars (High Growth, High Market Share)
- 4.3.2. Cash Cows (Low Growth, High Market Share)
- 4.3.3. Question Mark (High Growth, Low Market Share)
- 4.3.4. Dogs (Low Growth, Low Market Share)
- 4.4. Ansoff Matrix Analysis
- 4.5. Supply Chain Analysis
- 4.6. Regulatory Landscape
- 4.7. Current Market Potential and Opportunity Assessment (TAM–SAM–SOM Framework)
- 4.8. NRP Analyst Note
- 4.1. Porters Five Forces
- 5. Market Analysis, Insights and Forecast 2021-2033
- 5.1. Market Analysis, Insights and Forecast - by Application
- 5.1.1. Personal
- 5.1.2. Enterprise
- 5.2. Market Analysis, Insights and Forecast - by Type
- 5.2.1. Patent
- 5.2.2. Trademark
- 5.2.3. Copyright
- 5.2.4. Others
- 5.3. Market Analysis, Insights and Forecast - by Region
- 5.3.1. North America
- 5.3.2. South America
- 5.3.3. Europe
- 5.3.4. Middle East & Africa
- 5.3.5. Asia Pacific
- 5.1. Market Analysis, Insights and Forecast - by Application
- 6. Global Ip Valuation Service Analysis, Insights and Forecast, 2021-2033
- 6.1. Market Analysis, Insights and Forecast - by Application
- 6.1.1. Personal
- 6.1.2. Enterprise
- 6.2. Market Analysis, Insights and Forecast - by Type
- 6.2.1. Patent
- 6.2.2. Trademark
- 6.2.3. Copyright
- 6.2.4. Others
- 6.1. Market Analysis, Insights and Forecast - by Application
- 7. North America Ip Valuation Service Analysis, Insights and Forecast, 2020-2032
- 7.1. Market Analysis, Insights and Forecast - by Application
- 7.1.1. Personal
- 7.1.2. Enterprise
- 7.2. Market Analysis, Insights and Forecast - by Type
- 7.2.1. Patent
- 7.2.2. Trademark
- 7.2.3. Copyright
- 7.2.4. Others
- 7.1. Market Analysis, Insights and Forecast - by Application
- 8. South America Ip Valuation Service Analysis, Insights and Forecast, 2020-2032
- 8.1. Market Analysis, Insights and Forecast - by Application
- 8.1.1. Personal
- 8.1.2. Enterprise
- 8.2. Market Analysis, Insights and Forecast - by Type
- 8.2.1. Patent
- 8.2.2. Trademark
- 8.2.3. Copyright
- 8.2.4. Others
- 8.1. Market Analysis, Insights and Forecast - by Application
- 9. Europe Ip Valuation Service Analysis, Insights and Forecast, 2020-2032
- 9.1. Market Analysis, Insights and Forecast - by Application
- 9.1.1. Personal
- 9.1.2. Enterprise
- 9.2. Market Analysis, Insights and Forecast - by Type
- 9.2.1. Patent
- 9.2.2. Trademark
- 9.2.3. Copyright
- 9.2.4. Others
- 9.1. Market Analysis, Insights and Forecast - by Application
- 10. Middle East & Africa Ip Valuation Service Analysis, Insights and Forecast, 2020-2032
- 10.1. Market Analysis, Insights and Forecast - by Application
- 10.1.1. Personal
- 10.1.2. Enterprise
- 10.2. Market Analysis, Insights and Forecast - by Type
- 10.2.1. Patent
- 10.2.2. Trademark
- 10.2.3. Copyright
- 10.2.4. Others
- 10.1. Market Analysis, Insights and Forecast - by Application
- 11. Asia Pacific Ip Valuation Service Analysis, Insights and Forecast, 2020-2032
- 11.1. Market Analysis, Insights and Forecast - by Application
- 11.1.1. Personal
- 11.1.2. Enterprise
- 11.2. Market Analysis, Insights and Forecast - by Type
- 11.2.1. Patent
- 11.2.2. Trademark
- 11.2.3. Copyright
- 11.2.4. Others
- 11.1. Market Analysis, Insights and Forecast - by Application
- 12. Competitive Analysis
- 12.1. Company Profiles
- 12.1.1 InTraCoM Group
- 12.1.1.1. Company Overview
- 12.1.1.2. Products
- 12.1.1.3. Company Financials
- 12.1.1.4. SWOT Analysis
- 12.1.2 Ocean Tomo
- 12.1.2.1. Company Overview
- 12.1.2.2. Products
- 12.1.2.3. Company Financials
- 12.1.2.4. SWOT Analysis
- 12.1.3 Dennemeyer
- 12.1.3.1. Company Overview
- 12.1.3.2. Products
- 12.1.3.3. Company Financials
- 12.1.3.4. SWOT Analysis
- 12.1.4 Valuation Consulting
- 12.1.4.1. Company Overview
- 12.1.4.2. Products
- 12.1.4.3. Company Financials
- 12.1.4.4. SWOT Analysis
- 12.1.5 IPEG
- 12.1.5.1. Company Overview
- 12.1.5.2. Products
- 12.1.5.3. Company Financials
- 12.1.5.4. SWOT Analysis
- 12.1.6 OxFirst
- 12.1.6.1. Company Overview
- 12.1.6.2. Products
- 12.1.6.3. Company Financials
- 12.1.6.4. SWOT Analysis
- 12.1.7 Kroll
- 12.1.7.1. Company Overview
- 12.1.7.2. Products
- 12.1.7.3. Company Financials
- 12.1.7.4. SWOT Analysis
- 12.1.8 Hilco Valuation
- 12.1.8.1. Company Overview
- 12.1.8.2. Products
- 12.1.8.3. Company Financials
- 12.1.8.4. SWOT Analysis
- 12.1.9 Barker Brettell
- 12.1.9.1. Company Overview
- 12.1.9.2. Products
- 12.1.9.3. Company Financials
- 12.1.9.4. SWOT Analysis
- 12.1.10 Adastra
- 12.1.10.1. Company Overview
- 12.1.10.2. Products
- 12.1.10.3. Company Financials
- 12.1.10.4. SWOT Analysis
- 12.1.11 Deloitte
- 12.1.11.1. Company Overview
- 12.1.11.2. Products
- 12.1.11.3. Company Financials
- 12.1.11.4. SWOT Analysis
- 12.1.12 Parallel North IP
- 12.1.12.1. Company Overview
- 12.1.12.2. Products
- 12.1.12.3. Company Financials
- 12.1.12.4. SWOT Analysis
- 12.1.13 Metis Partners
- 12.1.13.1. Company Overview
- 12.1.13.2. Products
- 12.1.13.3. Company Financials
- 12.1.13.4. SWOT Analysis
- 12.1.14 Valuing IP
- 12.1.14.1. Company Overview
- 12.1.14.2. Products
- 12.1.14.3. Company Financials
- 12.1.14.4. SWOT Analysis
- 12.1.15 Venner Shipley LLP
- 12.1.15.1. Company Overview
- 12.1.15.2. Products
- 12.1.15.3. Company Financials
- 12.1.15.4. SWOT Analysis
- 12.1.16 CRA
- 12.1.16.1. Company Overview
- 12.1.16.2. Products
- 12.1.16.3. Company Financials
- 12.1.16.4. SWOT Analysis
- 12.1.17 GHB Intellect
- 12.1.17.1. Company Overview
- 12.1.17.2. Products
- 12.1.17.3. Company Financials
- 12.1.17.4. SWOT Analysis
- 12.1.18 Nevium
- 12.1.18.1. Company Overview
- 12.1.18.2. Products
- 12.1.18.3. Company Financials
- 12.1.18.4. SWOT Analysis
- 12.1.19 Foresight Valuation
- 12.1.19.1. Company Overview
- 12.1.19.2. Products
- 12.1.19.3. Company Financials
- 12.1.19.4. SWOT Analysis
- 12.1.20 Moss Adams
- 12.1.20.1. Company Overview
- 12.1.20.2. Products
- 12.1.20.3. Company Financials
- 12.1.20.4. SWOT Analysis
- 12.1.21 Aranca
- 12.1.21.1. Company Overview
- 12.1.21.2. Products
- 12.1.21.3. Company Financials
- 12.1.21.4. SWOT Analysis
- 12.1.22 Kashish
- 12.1.22.1. Company Overview
- 12.1.22.2. Products
- 12.1.22.3. Company Financials
- 12.1.22.4. SWOT Analysis
- 12.1.23 EisnerAmper
- 12.1.23.1. Company Overview
- 12.1.23.2. Products
- 12.1.23.3. Company Financials
- 12.1.23.4. SWOT Analysis
- 12.1.24 Stout
- 12.1.24.1. Company Overview
- 12.1.24.2. Products
- 12.1.24.3. Company Financials
- 12.1.24.4. SWOT Analysis
- 12.1.25 Spring Galaxy
- 12.1.25.1. Company Overview
- 12.1.25.2. Products
- 12.1.25.3. Company Financials
- 12.1.25.4. SWOT Analysis
- 12.1.26 Vincents
- 12.1.26.1. Company Overview
- 12.1.26.2. Products
- 12.1.26.3. Company Financials
- 12.1.26.4. SWOT Analysis
- 12.1.27 Tee IP
- 12.1.27.1. Company Overview
- 12.1.27.2. Products
- 12.1.27.3. Company Financials
- 12.1.27.4. SWOT Analysis
- 12.1.28 Hemming Morse
- 12.1.28.1. Company Overview
- 12.1.28.2. Products
- 12.1.28.3. Company Financials
- 12.1.28.4. SWOT Analysis
- 12.1.29 Redwood
- 12.1.29.1. Company Overview
- 12.1.29.2. Products
- 12.1.29.3. Company Financials
- 12.1.29.4. SWOT Analysis
- 12.1.30 EXCELON IP
- 12.1.30.1. Company Overview
- 12.1.30.2. Products
- 12.1.30.3. Company Financials
- 12.1.30.4. SWOT Analysis
- 12.1.31 Mathys & Squire LLP
- 12.1.31.1. Company Overview
- 12.1.31.2. Products
- 12.1.31.3. Company Financials
- 12.1.31.4. SWOT Analysis
- 12.1.32 Especia
- 12.1.32.1. Company Overview
- 12.1.32.2. Products
- 12.1.32.3. Company Financials
- 12.1.32.4. SWOT Analysis
- 12.1.33 Schweiger & Partners
- 12.1.33.1. Company Overview
- 12.1.33.2. Products
- 12.1.33.3. Company Financials
- 12.1.33.4. SWOT Analysis
- 12.1.34 Brainiac IP Solutions
- 12.1.34.1. Company Overview
- 12.1.34.2. Products
- 12.1.34.3. Company Financials
- 12.1.34.4. SWOT Analysis
- 12.1.35 Pellegrino and Associates
- 12.1.35.1. Company Overview
- 12.1.35.2. Products
- 12.1.35.3. Company Financials
- 12.1.35.4. SWOT Analysis
- 12.1.36 FIN IP Group
- 12.1.36.1. Company Overview
- 12.1.36.2. Products
- 12.1.36.3. Company Financials
- 12.1.36.4. SWOT Analysis
- 12.1.1 InTraCoM Group
- 12.2. Market Entropy
- 12.2.1 Company's Key Areas Served
- 12.2.2 Recent Developments
- 12.3. Company Market Share Analysis 2025
- 12.3.1 Top 5 Companies Market Share Analysis
- 12.3.2 Top 3 Companies Market Share Analysis
- 12.4. List of Potential Customers
- 13. Research Methodology
List of Figures
- Figure 1: Global Ip Valuation Service Revenue Breakdown (million, %) by Region 2025 & 2033
- Figure 2: North America Ip Valuation Service Revenue (million), by Application 2025 & 2033
- Figure 3: North America Ip Valuation Service Revenue Share (%), by Application 2025 & 2033
- Figure 4: North America Ip Valuation Service Revenue (million), by Type 2025 & 2033
- Figure 5: North America Ip Valuation Service Revenue Share (%), by Type 2025 & 2033
- Figure 6: North America Ip Valuation Service Revenue (million), by Country 2025 & 2033
- Figure 7: North America Ip Valuation Service Revenue Share (%), by Country 2025 & 2033
- Figure 8: South America Ip Valuation Service Revenue (million), by Application 2025 & 2033
- Figure 9: South America Ip Valuation Service Revenue Share (%), by Application 2025 & 2033
- Figure 10: South America Ip Valuation Service Revenue (million), by Type 2025 & 2033
- Figure 11: South America Ip Valuation Service Revenue Share (%), by Type 2025 & 2033
- Figure 12: South America Ip Valuation Service Revenue (million), by Country 2025 & 2033
- Figure 13: South America Ip Valuation Service Revenue Share (%), by Country 2025 & 2033
- Figure 14: Europe Ip Valuation Service Revenue (million), by Application 2025 & 2033
- Figure 15: Europe Ip Valuation Service Revenue Share (%), by Application 2025 & 2033
- Figure 16: Europe Ip Valuation Service Revenue (million), by Type 2025 & 2033
- Figure 17: Europe Ip Valuation Service Revenue Share (%), by Type 2025 & 2033
- Figure 18: Europe Ip Valuation Service Revenue (million), by Country 2025 & 2033
- Figure 19: Europe Ip Valuation Service Revenue Share (%), by Country 2025 & 2033
- Figure 20: Middle East & Africa Ip Valuation Service Revenue (million), by Application 2025 & 2033
- Figure 21: Middle East & Africa Ip Valuation Service Revenue Share (%), by Application 2025 & 2033
- Figure 22: Middle East & Africa Ip Valuation Service Revenue (million), by Type 2025 & 2033
- Figure 23: Middle East & Africa Ip Valuation Service Revenue Share (%), by Type 2025 & 2033
- Figure 24: Middle East & Africa Ip Valuation Service Revenue (million), by Country 2025 & 2033
- Figure 25: Middle East & Africa Ip Valuation Service Revenue Share (%), by Country 2025 & 2033
- Figure 26: Asia Pacific Ip Valuation Service Revenue (million), by Application 2025 & 2033
- Figure 27: Asia Pacific Ip Valuation Service Revenue Share (%), by Application 2025 & 2033
- Figure 28: Asia Pacific Ip Valuation Service Revenue (million), by Type 2025 & 2033
- Figure 29: Asia Pacific Ip Valuation Service Revenue Share (%), by Type 2025 & 2033
- Figure 30: Asia Pacific Ip Valuation Service Revenue (million), by Country 2025 & 2033
- Figure 31: Asia Pacific Ip Valuation Service Revenue Share (%), by Country 2025 & 2033
List of Tables
- Table 1: Global Ip Valuation Service Revenue million Forecast, by Application 2020 & 2033
- Table 2: Global Ip Valuation Service Revenue million Forecast, by Type 2020 & 2033
- Table 3: Global Ip Valuation Service Revenue million Forecast, by Region 2020 & 2033
- Table 4: Global Ip Valuation Service Revenue million Forecast, by Application 2020 & 2033
- Table 5: Global Ip Valuation Service Revenue million Forecast, by Type 2020 & 2033
- Table 6: Global Ip Valuation Service Revenue million Forecast, by Country 2020 & 2033
- Table 7: United States Ip Valuation Service Revenue (million) Forecast, by Application 2020 & 2033
- Table 8: Canada Ip Valuation Service Revenue (million) Forecast, by Application 2020 & 2033
- Table 9: Mexico Ip Valuation Service Revenue (million) Forecast, by Application 2020 & 2033
- Table 10: Global Ip Valuation Service Revenue million Forecast, by Application 2020 & 2033
- Table 11: Global Ip Valuation Service Revenue million Forecast, by Type 2020 & 2033
- Table 12: Global Ip Valuation Service Revenue million Forecast, by Country 2020 & 2033
- Table 13: Brazil Ip Valuation Service Revenue (million) Forecast, by Application 2020 & 2033
- Table 14: Argentina Ip Valuation Service Revenue (million) Forecast, by Application 2020 & 2033
- Table 15: Rest of South America Ip Valuation Service Revenue (million) Forecast, by Application 2020 & 2033
- Table 16: Global Ip Valuation Service Revenue million Forecast, by Application 2020 & 2033
- Table 17: Global Ip Valuation Service Revenue million Forecast, by Type 2020 & 2033
- Table 18: Global Ip Valuation Service Revenue million Forecast, by Country 2020 & 2033
- Table 19: United Kingdom Ip Valuation Service Revenue (million) Forecast, by Application 2020 & 2033
- Table 20: Germany Ip Valuation Service Revenue (million) Forecast, by Application 2020 & 2033
- Table 21: France Ip Valuation Service Revenue (million) Forecast, by Application 2020 & 2033
- Table 22: Italy Ip Valuation Service Revenue (million) Forecast, by Application 2020 & 2033
- Table 23: Spain Ip Valuation Service Revenue (million) Forecast, by Application 2020 & 2033
- Table 24: Russia Ip Valuation Service Revenue (million) Forecast, by Application 2020 & 2033
- Table 25: Benelux Ip Valuation Service Revenue (million) Forecast, by Application 2020 & 2033
- Table 26: Nordics Ip Valuation Service Revenue (million) Forecast, by Application 2020 & 2033
- Table 27: Rest of Europe Ip Valuation Service Revenue (million) Forecast, by Application 2020 & 2033
- Table 28: Global Ip Valuation Service Revenue million Forecast, by Application 2020 & 2033
- Table 29: Global Ip Valuation Service Revenue million Forecast, by Type 2020 & 2033
- Table 30: Global Ip Valuation Service Revenue million Forecast, by Country 2020 & 2033
- Table 31: Turkey Ip Valuation Service Revenue (million) Forecast, by Application 2020 & 2033
- Table 32: Israel Ip Valuation Service Revenue (million) Forecast, by Application 2020 & 2033
- Table 33: GCC Ip Valuation Service Revenue (million) Forecast, by Application 2020 & 2033
- Table 34: North Africa Ip Valuation Service Revenue (million) Forecast, by Application 2020 & 2033
- Table 35: South Africa Ip Valuation Service Revenue (million) Forecast, by Application 2020 & 2033
- Table 36: Rest of Middle East & Africa Ip Valuation Service Revenue (million) Forecast, by Application 2020 & 2033
- Table 37: Global Ip Valuation Service Revenue million Forecast, by Application 2020 & 2033
- Table 38: Global Ip Valuation Service Revenue million Forecast, by Type 2020 & 2033
- Table 39: Global Ip Valuation Service Revenue million Forecast, by Country 2020 & 2033
- Table 40: China Ip Valuation Service Revenue (million) Forecast, by Application 2020 & 2033
- Table 41: India Ip Valuation Service Revenue (million) Forecast, by Application 2020 & 2033
- Table 42: Japan Ip Valuation Service Revenue (million) Forecast, by Application 2020 & 2033
- Table 43: South Korea Ip Valuation Service Revenue (million) Forecast, by Application 2020 & 2033
- Table 44: ASEAN Ip Valuation Service Revenue (million) Forecast, by Application 2020 & 2033
- Table 45: Oceania Ip Valuation Service Revenue (million) Forecast, by Application 2020 & 2033
- Table 46: Rest of Asia Pacific Ip Valuation Service Revenue (million) Forecast, by Application 2020 & 2033
Frequently Asked Questions
1. What is the projected Compound Annual Growth Rate (CAGR) of the Ip Valuation Service?
The projected CAGR is approximately 14.7%.
2. Which companies are prominent players in the Ip Valuation Service?
Key companies in the market include InTraCoM Group, Ocean Tomo, Dennemeyer, Valuation Consulting, IPEG, OxFirst, Kroll, Hilco Valuation, Barker Brettell, Adastra, Deloitte, Parallel North IP, Metis Partners, Valuing IP, Venner Shipley LLP, CRA, GHB Intellect, Nevium, Foresight Valuation, Moss Adams, Aranca, Kashish, EisnerAmper, Stout, Spring Galaxy, Vincents, Tee IP, Hemming Morse, Redwood, EXCELON IP, Mathys & Squire LLP, Especia, Schweiger & Partners, Brainiac IP Solutions, Pellegrino and Associates, FIN IP Group.
3. What are the main segments of the Ip Valuation Service?
The market segments include Application, Type.
4. Can you provide details about the market size?
The market size is estimated to be USD 13730 million as of 2022.
5. What are some drivers contributing to market growth?
N/A
6. What are the notable trends driving market growth?
N/A
7. Are there any restraints impacting market growth?
N/A
8. Can you provide examples of recent developments in the market?
N/A
9. What pricing options are available for accessing the report?
Pricing options include single-user, multi-user, and enterprise licenses priced at USD 3950.00, USD 5925.00, and USD 7900.00 respectively.
10. Is the market size provided in terms of value or volume?
The market size is provided in terms of value, measured in million.
11. Are there any specific market keywords associated with the report?
Yes, the market keyword associated with the report is "Ip Valuation Service," which aids in identifying and referencing the specific market segment covered.
12. How do I determine which pricing option suits my needs best?
The pricing options vary based on user requirements and access needs. Individual users may opt for single-user licenses, while businesses requiring broader access may choose multi-user or enterprise licenses for cost-effective access to the report.
13. Are there any additional resources or data provided in the Ip Valuation Service report?
While the report offers comprehensive insights, it's advisable to review the specific contents or supplementary materials provided to ascertain if additional resources or data are available.
14. How can I stay updated on further developments or reports in the Ip Valuation Service?
To stay informed about further developments, trends, and reports in the Ip Valuation Service, consider subscribing to industry newsletters, following relevant companies and organizations, or regularly checking reputable industry news sources and publications.
Methodology
Step 1 - Identification of Relevant Samples Size from Population Database


Step 2 - Approaches for Defining Global Market Size (Value, Volume* & Price*)

Note*: In applicable scenarios
Step 3 - Data Sources
Primary Research
- Web Analytics
- Survey Reports
- Research Institute
- Latest Research Reports
- Opinion Leaders
Secondary Research
- Annual Reports
- White Paper
- Latest Press Release
- Industry Association
- Paid Database
- Investor Presentations

Step 4 - Data Triangulation
Involves using different sources of information in order to increase the validity of a study
These sources are likely to be stakeholders in a program - participants, other researchers, program staff, other community members, and so on.
Then we put all data in single framework & apply various statistical tools to find out the dynamic on the market.
During the analysis stage, feedback from the stakeholder groups would be compared to determine areas of agreement as well as areas of divergence