

Key Insights
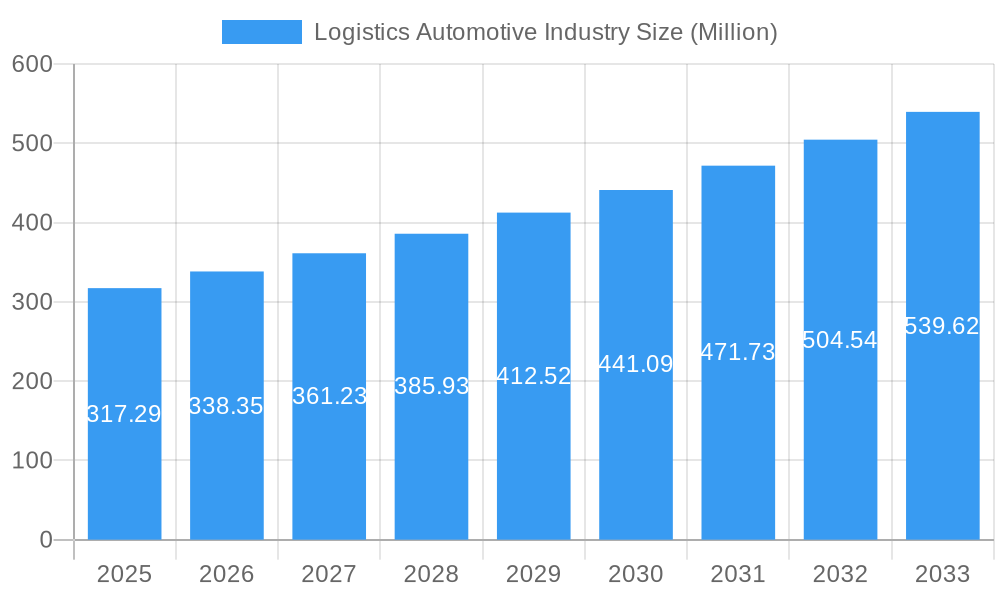
The global automotive logistics market, valued at $317.29 million in 2025, is poised for robust growth, exhibiting a Compound Annual Growth Rate (CAGR) of 6.65% from 2025 to 2033. This expansion is driven by several key factors. The rising demand for automobiles globally, fueled by increasing disposable incomes and a burgeoning middle class in emerging economies like India and China, is a significant catalyst. Furthermore, the automotive industry's increasing reliance on just-in-time manufacturing necessitates efficient and reliable logistics solutions, boosting the sector's growth. The trend towards e-commerce in automotive parts and accessories also contributes significantly to the market's expansion. Technological advancements, such as the adoption of advanced transportation management systems (TMS) and warehouse management systems (WMS), improve supply chain visibility and efficiency, further fueling market growth. However, factors like geopolitical instability, fluctuating fuel prices, and potential supply chain disruptions can act as restraints. The market is segmented by service type (transportation, warehousing, distribution, inventory management, and other services) and vehicle type (finished vehicles, auto components, and other types). North America and Asia-Pacific are expected to be the leading regional markets due to significant automotive manufacturing hubs and robust consumer demand.
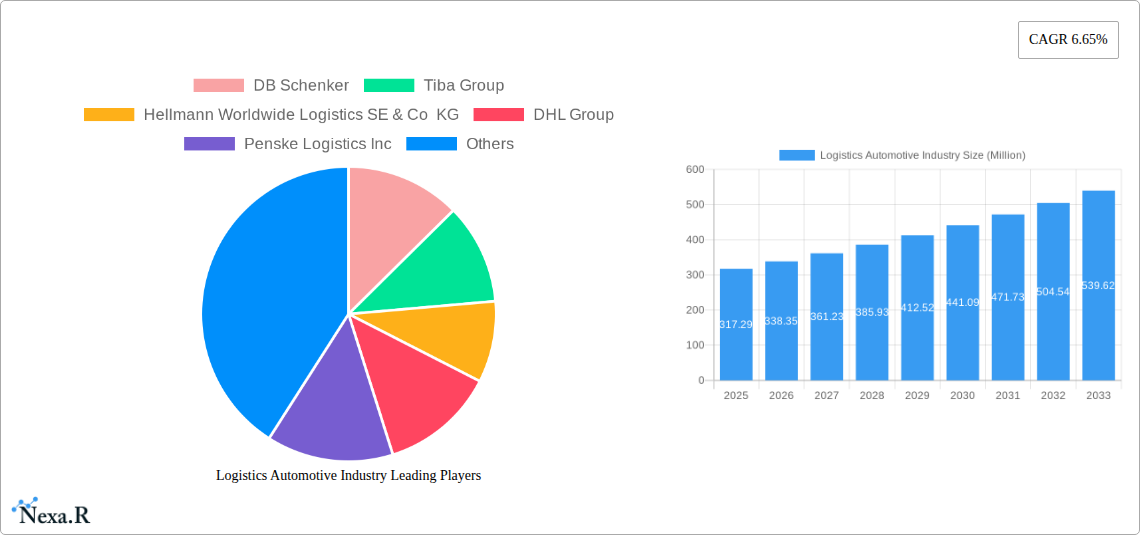
Logistics Automotive Industry Market Size (In Million)
The competitive landscape is highly fragmented, with a mix of global giants like DHL, Kuehne + Nagel, and DB Schenker, and regional players. These companies are focusing on strategic partnerships, technological innovation, and expansion into new markets to gain a competitive edge. The automotive logistics sector is also witnessing a surge in demand for specialized services catering to the unique handling requirements of electric vehicles (EVs) and their components, suggesting further growth potential in specialized segments. The forecast period (2025-2033) is likely to see continued market consolidation as larger players acquire smaller companies to increase their market share and expand their service offerings. Future growth will depend on effective adaptation to evolving technological advancements, regulatory changes, and the ongoing transformation of the automotive industry itself.
Logistics Automotive Industry Company Market Share
Logistics Automotive Industry Market Report: 2019-2033
This comprehensive report provides a detailed analysis of the global Logistics Automotive Industry market, encompassing historical data (2019-2024), current estimates (2025), and future forecasts (2025-2033). The report meticulously examines market dynamics, growth trends, key players, and emerging opportunities within this vital sector, offering invaluable insights for industry professionals, investors, and strategic decision-makers. The market is segmented by service (Transportation, Warehousing, Distribution, Inventory Management, Other Services) and by type (Finished Vehicle, Auto Components, Other Types). The total market size is expected to reach xx Million units by 2033.
Logistics Automotive Industry Market Dynamics & Structure
The automotive logistics market is characterized by a moderately concentrated landscape, with a handful of global giants and numerous regional players competing fiercely. Market share is dynamically shifting due to ongoing mergers and acquisitions (M&A) activities and rapid technological advancements. The industry is heavily regulated, influenced by factors like environmental regulations impacting transportation and warehousing practices. The rise of e-commerce and the increasing demand for just-in-time delivery are driving innovation. Substitute products or services are limited, primarily focusing on efficiency improvements within the existing logistics framework.
- Market Concentration: The top 5 players hold an estimated xx% market share in 2025.
- M&A Activity: An average of xx M&A deals occurred annually between 2019 and 2024.
- Technological Innovation: Autonomous vehicles, IoT, and AI are major drivers, although high implementation costs represent a barrier.
- Regulatory Framework: Stringent emission standards and safety regulations influence transportation choices.
- End-User Demographics: The market is driven by the global automotive industry’s production and distribution needs.
Logistics Automotive Industry Growth Trends & Insights
The global automotive logistics market exhibits robust growth, driven by the expanding automotive industry and increasing global trade. From 2019 to 2024, the market experienced a CAGR of xx%, reaching an estimated xx Million units in 2024. This growth trajectory is projected to continue, with a forecasted CAGR of xx% from 2025 to 2033, reaching xx Million units by 2033. Technological disruptions, such as the adoption of digital platforms and advanced analytics, significantly influence operational efficiency and customer expectations. Consumer demand for faster and more transparent logistics solutions is shaping industry practices.
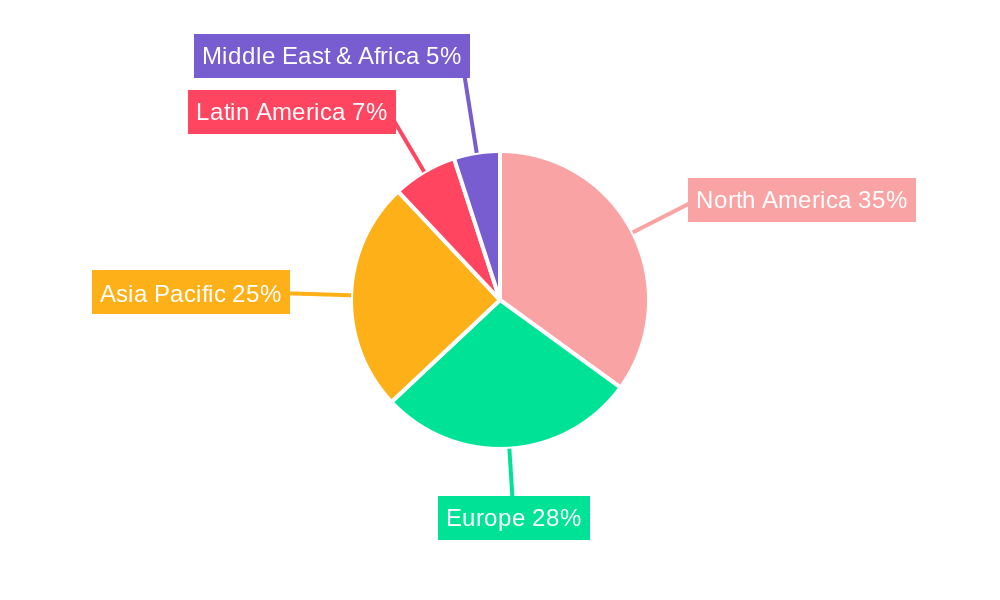
Dominant Regions, Countries, or Segments in Logistics Automotive Industry
North America and Europe currently dominate the automotive logistics market, primarily due to well-established automotive manufacturing hubs and robust infrastructure. However, Asia-Pacific is expected to experience the fastest growth rate in the forecast period, fueled by expanding automotive production in countries like China and India. Within the service segment, Transportation holds the largest share (xx%), followed by Warehousing (xx%). The Finished Vehicle segment dominates the market by type (xx%), reflecting the high volume of vehicle transportation globally.
- Key Drivers (Asia-Pacific): Government initiatives supporting infrastructure development, increasing FDI in the automotive sector, and rising disposable incomes.
- Dominance Factors (North America): Existing robust logistics networks, strong automotive manufacturing presence, and high consumer demand.
Logistics Automotive Industry Product Landscape
The automotive logistics sector is marked by increasing sophistication in technology, ranging from advanced tracking systems and real-time visibility platforms to automated warehousing solutions. The focus is on optimizing delivery times, reducing costs, and ensuring the integrity of shipped goods. Unique selling propositions involve customized solutions tailored to the specific needs of automotive manufacturers and suppliers, emphasizing end-to-end visibility and proactive risk management.
Key Drivers, Barriers & Challenges in Logistics Automotive Industry
Key Drivers:
- Increasing automotive production and sales globally.
- Growth in e-commerce and demand for faster delivery.
- Technological advancements like automation and AI.
Challenges:
- Supply chain disruptions and geopolitical instability (e.g., the impact of the xx conflict resulted in a xx% increase in transportation costs).
- Rising fuel costs and environmental regulations.
- Intense competition and pressure to reduce costs.
Emerging Opportunities in Logistics Automotive Industry
- Expansion into developing markets with growing automotive industries.
- Development of specialized logistics solutions for electric vehicles and autonomous vehicles.
- Increased focus on sustainable and eco-friendly logistics practices.
Growth Accelerators in the Logistics Automotive Industry
Technological innovation, strategic alliances between logistics providers and automotive manufacturers, and expansion into new markets are driving long-term growth. The adoption of blockchain technology for enhanced supply chain transparency and security represents a significant growth catalyst.
Key Players Shaping the Logistics Automotive Industry Market
- DB Schenker
- Tiba Group
- Hellmann Worldwide Logistics SE & Co KG
- DHL Group
- Penske Logistics Inc
- Kuehne + Nagel International AG
- BLG Logistics Group AG & Co KG
- CFR Rinkens
- CEVA Logistics
- Expeditors
- APL Logistics Ltd
- XPO Logistics Inc
- GEFCO SA
- Panalpina
- Bollore Logistics
- Kerry Logistics Network Ltd
- Ryder System Inc
- DSV Panalpina AS
Notable Milestones in Logistics Automotive Industry Sector
- December 2022: Delhivery acquires Algorhythm Tech Pvt Ltd for USD 17.99 Million, expanding its supply chain solutions.
- August 2022: Bolloré Logistics expands its Australian presence by acquiring Lynair Logistics.
In-Depth Logistics Automotive Industry Market Outlook
The automotive logistics market is poised for continued growth, driven by technological advancements, evolving consumer preferences, and the expansion of the global automotive industry. Strategic partnerships and investments in sustainable solutions will shape the future landscape, creating lucrative opportunities for innovative players. The focus on efficiency, transparency, and sustainability will be key differentiators in this dynamic market.
Logistics Automotive Industry Segmentation
-
1. Service
- 1.1. Transportation
- 1.2. Warehous
- 1.3. Other Services
-
2. Type
- 2.1. Finished Vehicle
- 2.2. Auto Components
- 2.3. Other Types
Logistics Automotive Industry Segmentation By Geography
-
1. Asia Pacific
- 1.1. China
- 1.2. Japan
- 1.3. India
- 1.4. South Korea
- 1.5. Rest of Asia Pacific
-
2. North America
- 2.1. United States
- 2.2. Canada
- 2.3. Mexico
-
3. Europe
- 3.1. United Kingdom
- 3.2. Germany
- 3.3. Italy
- 3.4. Russia
- 3.5. France
- 3.6. Rest of Europe
-
4. Latin America
- 4.1. Brazil
- 4.2. Argentina
- 4.3. Rest of Latin America
- 5. Middle East
-
6. South Africa
- 6.1. United Arab Emirates
- 6.2. Saudi Arabia
- 6.3. Rest of Middle East
Logistics Automotive Industry Regional Market Share
Geographic Coverage of Logistics Automotive Industry
Logistics Automotive Industry REPORT HIGHLIGHTS
| Aspects | Details |
|---|---|
| Study Period | 2020-2034 |
| Base Year | 2025 |
| Estimated Year | 2026 |
| Forecast Period | 2026-2034 |
| Historical Period | 2020-2025 |
| Growth Rate | CAGR of 6.65% from 2020-2034 |
| Segmentation |
|
Table of Contents
- 1. Introduction
- 1.1. Research Scope
- 1.2. Market Segmentation
- 1.3. Research Objective
- 1.4. Definitions and Assumptions
- 2. Executive Summary
- 2.1. Market Snapshot
- 3. Market Dynamics
- 3.1. Market Drivers
- 3.2. Market Restrains
- 3.3. Market Trends
- 3.4. Market Opportunities
- 4. Market Factor Analysis
- 4.1. Porters Five Forces
- 4.1.1. Bargaining Power of Suppliers
- 4.1.2. Bargaining Power of Buyers
- 4.1.3. Threat of New Entrants
- 4.1.4. Threat of Substitutes
- 4.1.5. Competitive Rivalry
- 4.2. PESTEL analysis
- 4.3. BCG Analysis
- 4.3.1. Stars (High Growth, High Market Share)
- 4.3.2. Cash Cows (Low Growth, High Market Share)
- 4.3.3. Question Mark (High Growth, Low Market Share)
- 4.3.4. Dogs (Low Growth, Low Market Share)
- 4.4. Ansoff Matrix Analysis
- 4.5. Supply Chain Analysis
- 4.6. Regulatory Landscape
- 4.7. Current Market Potential and Opportunity Assessment (TAM–SAM–SOM Framework)
- 4.8. NRP Analyst Note
- 4.1. Porters Five Forces
- 5. Market Analysis, Insights and Forecast 2021-2033
- 5.1. Market Analysis, Insights and Forecast - by Service
- 5.1.1. Transportation
- 5.1.2. Warehous
- 5.1.3. Other Services
- 5.2. Market Analysis, Insights and Forecast - by Type
- 5.2.1. Finished Vehicle
- 5.2.2. Auto Components
- 5.2.3. Other Types
- 5.3. Market Analysis, Insights and Forecast - by Region
- 5.3.1. Asia Pacific
- 5.3.2. North America
- 5.3.3. Europe
- 5.3.4. Latin America
- 5.3.5. Middle East
- 5.3.6. South Africa
- 5.1. Market Analysis, Insights and Forecast - by Service
- 6. Global Logistics Automotive Industry Analysis, Insights and Forecast, 2021-2033
- 6.1. Market Analysis, Insights and Forecast - by Service
- 6.1.1. Transportation
- 6.1.2. Warehous
- 6.1.3. Other Services
- 6.2. Market Analysis, Insights and Forecast - by Type
- 6.2.1. Finished Vehicle
- 6.2.2. Auto Components
- 6.2.3. Other Types
- 6.1. Market Analysis, Insights and Forecast - by Service
- 7. Asia Pacific Logistics Automotive Industry Analysis, Insights and Forecast, 2020-2032
- 7.1. Market Analysis, Insights and Forecast - by Service
- 7.1.1. Transportation
- 7.1.2. Warehous
- 7.1.3. Other Services
- 7.2. Market Analysis, Insights and Forecast - by Type
- 7.2.1. Finished Vehicle
- 7.2.2. Auto Components
- 7.2.3. Other Types
- 7.1. Market Analysis, Insights and Forecast - by Service
- 8. North America Logistics Automotive Industry Analysis, Insights and Forecast, 2020-2032
- 8.1. Market Analysis, Insights and Forecast - by Service
- 8.1.1. Transportation
- 8.1.2. Warehous
- 8.1.3. Other Services
- 8.2. Market Analysis, Insights and Forecast - by Type
- 8.2.1. Finished Vehicle
- 8.2.2. Auto Components
- 8.2.3. Other Types
- 8.1. Market Analysis, Insights and Forecast - by Service
- 9. Europe Logistics Automotive Industry Analysis, Insights and Forecast, 2020-2032
- 9.1. Market Analysis, Insights and Forecast - by Service
- 9.1.1. Transportation
- 9.1.2. Warehous
- 9.1.3. Other Services
- 9.2. Market Analysis, Insights and Forecast - by Type
- 9.2.1. Finished Vehicle
- 9.2.2. Auto Components
- 9.2.3. Other Types
- 9.1. Market Analysis, Insights and Forecast - by Service
- 10. Latin America Logistics Automotive Industry Analysis, Insights and Forecast, 2020-2032
- 10.1. Market Analysis, Insights and Forecast - by Service
- 10.1.1. Transportation
- 10.1.2. Warehous
- 10.1.3. Other Services
- 10.2. Market Analysis, Insights and Forecast - by Type
- 10.2.1. Finished Vehicle
- 10.2.2. Auto Components
- 10.2.3. Other Types
- 10.1. Market Analysis, Insights and Forecast - by Service
- 11. Middle East Logistics Automotive Industry Analysis, Insights and Forecast, 2020-2032
- 11.1. Market Analysis, Insights and Forecast - by Service
- 11.1.1. Transportation
- 11.1.2. Warehous
- 11.1.3. Other Services
- 11.2. Market Analysis, Insights and Forecast - by Type
- 11.2.1. Finished Vehicle
- 11.2.2. Auto Components
- 11.2.3. Other Types
- 11.1. Market Analysis, Insights and Forecast - by Service
- 12. South Africa Logistics Automotive Industry Analysis, Insights and Forecast, 2020-2032
- 12.1. Market Analysis, Insights and Forecast - by Service
- 12.1.1. Transportation
- 12.1.2. Warehous
- 12.1.3. Other Services
- 12.2. Market Analysis, Insights and Forecast - by Type
- 12.2.1. Finished Vehicle
- 12.2.2. Auto Components
- 12.2.3. Other Types
- 12.1. Market Analysis, Insights and Forecast - by Service
- 13. Competitive Analysis
- 13.1. Company Profiles
- 13.1.1 DB Schenker
- 13.1.1.1. Company Overview
- 13.1.1.2. Products
- 13.1.1.3. Company Financials
- 13.1.1.4. SWOT Analysis
- 13.1.2 Tiba Group
- 13.1.2.1. Company Overview
- 13.1.2.2. Products
- 13.1.2.3. Company Financials
- 13.1.2.4. SWOT Analysis
- 13.1.3 Hellmann Worldwide Logistics SE & Co KG
- 13.1.3.1. Company Overview
- 13.1.3.2. Products
- 13.1.3.3. Company Financials
- 13.1.3.4. SWOT Analysis
- 13.1.4 DHL Group
- 13.1.4.1. Company Overview
- 13.1.4.2. Products
- 13.1.4.3. Company Financials
- 13.1.4.4. SWOT Analysis
- 13.1.5 Penske Logistics Inc
- 13.1.5.1. Company Overview
- 13.1.5.2. Products
- 13.1.5.3. Company Financials
- 13.1.5.4. SWOT Analysis
- 13.1.6 Kuehne + Nagel International AG
- 13.1.6.1. Company Overview
- 13.1.6.2. Products
- 13.1.6.3. Company Financials
- 13.1.6.4. SWOT Analysis
- 13.1.7 BLG Logistics Group AG & Co KG
- 13.1.7.1. Company Overview
- 13.1.7.2. Products
- 13.1.7.3. Company Financials
- 13.1.7.4. SWOT Analysis
- 13.1.8 CFR Rinkens**List Not Exhaustive
- 13.1.8.1. Company Overview
- 13.1.8.2. Products
- 13.1.8.3. Company Financials
- 13.1.8.4. SWOT Analysis
- 13.1.9 CEVA Logistics
- 13.1.9.1. Company Overview
- 13.1.9.2. Products
- 13.1.9.3. Company Financials
- 13.1.9.4. SWOT Analysis
- 13.1.10 Expeditors
- 13.1.10.1. Company Overview
- 13.1.10.2. Products
- 13.1.10.3. Company Financials
- 13.1.10.4. SWOT Analysis
- 13.1.11 APL Logistics Ltd
- 13.1.11.1. Company Overview
- 13.1.11.2. Products
- 13.1.11.3. Company Financials
- 13.1.11.4. SWOT Analysis
- 13.1.12 XPO Logistics Inc
- 13.1.12.1. Company Overview
- 13.1.12.2. Products
- 13.1.12.3. Company Financials
- 13.1.12.4. SWOT Analysis
- 13.1.13 GEFCO SA
- 13.1.13.1. Company Overview
- 13.1.13.2. Products
- 13.1.13.3. Company Financials
- 13.1.13.4. SWOT Analysis
- 13.1.14 Panalpina
- 13.1.14.1. Company Overview
- 13.1.14.2. Products
- 13.1.14.3. Company Financials
- 13.1.14.4. SWOT Analysis
- 13.1.15 Bollore Logistics
- 13.1.15.1. Company Overview
- 13.1.15.2. Products
- 13.1.15.3. Company Financials
- 13.1.15.4. SWOT Analysis
- 13.1.16 Kerry Logistics Network Ltd
- 13.1.16.1. Company Overview
- 13.1.16.2. Products
- 13.1.16.3. Company Financials
- 13.1.16.4. SWOT Analysis
- 13.1.17 Ryder System Inc
- 13.1.17.1. Company Overview
- 13.1.17.2. Products
- 13.1.17.3. Company Financials
- 13.1.17.4. SWOT Analysis
- 13.1.18 DSV Panalpina AS
- 13.1.18.1. Company Overview
- 13.1.18.2. Products
- 13.1.18.3. Company Financials
- 13.1.18.4. SWOT Analysis
- 13.1.1 DB Schenker
- 13.2. Market Entropy
- 13.2.1 Company's Key Areas Served
- 13.2.2 Recent Developments
- 13.3. Company Market Share Analysis 2025
- 13.3.1 Top 5 Companies Market Share Analysis
- 13.3.2 Top 3 Companies Market Share Analysis
- 13.4. List of Potential Customers
- 14. Research Methodology
List of Figures
- Figure 1: Global Logistics Automotive Industry Revenue Breakdown (Million, %) by Region 2025 & 2033
- Figure 2: Asia Pacific Logistics Automotive Industry Revenue (Million), by Service 2025 & 2033
- Figure 3: Asia Pacific Logistics Automotive Industry Revenue Share (%), by Service 2025 & 2033
- Figure 4: Asia Pacific Logistics Automotive Industry Revenue (Million), by Type 2025 & 2033
- Figure 5: Asia Pacific Logistics Automotive Industry Revenue Share (%), by Type 2025 & 2033
- Figure 6: Asia Pacific Logistics Automotive Industry Revenue (Million), by Country 2025 & 2033
- Figure 7: Asia Pacific Logistics Automotive Industry Revenue Share (%), by Country 2025 & 2033
- Figure 8: North America Logistics Automotive Industry Revenue (Million), by Service 2025 & 2033
- Figure 9: North America Logistics Automotive Industry Revenue Share (%), by Service 2025 & 2033
- Figure 10: North America Logistics Automotive Industry Revenue (Million), by Type 2025 & 2033
- Figure 11: North America Logistics Automotive Industry Revenue Share (%), by Type 2025 & 2033
- Figure 12: North America Logistics Automotive Industry Revenue (Million), by Country 2025 & 2033
- Figure 13: North America Logistics Automotive Industry Revenue Share (%), by Country 2025 & 2033
- Figure 14: Europe Logistics Automotive Industry Revenue (Million), by Service 2025 & 2033
- Figure 15: Europe Logistics Automotive Industry Revenue Share (%), by Service 2025 & 2033
- Figure 16: Europe Logistics Automotive Industry Revenue (Million), by Type 2025 & 2033
- Figure 17: Europe Logistics Automotive Industry Revenue Share (%), by Type 2025 & 2033
- Figure 18: Europe Logistics Automotive Industry Revenue (Million), by Country 2025 & 2033
- Figure 19: Europe Logistics Automotive Industry Revenue Share (%), by Country 2025 & 2033
- Figure 20: Latin America Logistics Automotive Industry Revenue (Million), by Service 2025 & 2033
- Figure 21: Latin America Logistics Automotive Industry Revenue Share (%), by Service 2025 & 2033
- Figure 22: Latin America Logistics Automotive Industry Revenue (Million), by Type 2025 & 2033
- Figure 23: Latin America Logistics Automotive Industry Revenue Share (%), by Type 2025 & 2033
- Figure 24: Latin America Logistics Automotive Industry Revenue (Million), by Country 2025 & 2033
- Figure 25: Latin America Logistics Automotive Industry Revenue Share (%), by Country 2025 & 2033
- Figure 26: Middle East Logistics Automotive Industry Revenue (Million), by Service 2025 & 2033
- Figure 27: Middle East Logistics Automotive Industry Revenue Share (%), by Service 2025 & 2033
- Figure 28: Middle East Logistics Automotive Industry Revenue (Million), by Type 2025 & 2033
- Figure 29: Middle East Logistics Automotive Industry Revenue Share (%), by Type 2025 & 2033
- Figure 30: Middle East Logistics Automotive Industry Revenue (Million), by Country 2025 & 2033
- Figure 31: Middle East Logistics Automotive Industry Revenue Share (%), by Country 2025 & 2033
- Figure 32: South Africa Logistics Automotive Industry Revenue (Million), by Service 2025 & 2033
- Figure 33: South Africa Logistics Automotive Industry Revenue Share (%), by Service 2025 & 2033
- Figure 34: South Africa Logistics Automotive Industry Revenue (Million), by Type 2025 & 2033
- Figure 35: South Africa Logistics Automotive Industry Revenue Share (%), by Type 2025 & 2033
- Figure 36: South Africa Logistics Automotive Industry Revenue (Million), by Country 2025 & 2033
- Figure 37: South Africa Logistics Automotive Industry Revenue Share (%), by Country 2025 & 2033
List of Tables
- Table 1: Global Logistics Automotive Industry Revenue Million Forecast, by Service 2020 & 2033
- Table 2: Global Logistics Automotive Industry Revenue Million Forecast, by Type 2020 & 2033
- Table 3: Global Logistics Automotive Industry Revenue Million Forecast, by Region 2020 & 2033
- Table 4: Global Logistics Automotive Industry Revenue Million Forecast, by Service 2020 & 2033
- Table 5: Global Logistics Automotive Industry Revenue Million Forecast, by Type 2020 & 2033
- Table 6: Global Logistics Automotive Industry Revenue Million Forecast, by Country 2020 & 2033
- Table 7: China Logistics Automotive Industry Revenue (Million) Forecast, by Application 2020 & 2033
- Table 8: Japan Logistics Automotive Industry Revenue (Million) Forecast, by Application 2020 & 2033
- Table 9: India Logistics Automotive Industry Revenue (Million) Forecast, by Application 2020 & 2033
- Table 10: South Korea Logistics Automotive Industry Revenue (Million) Forecast, by Application 2020 & 2033
- Table 11: Rest of Asia Pacific Logistics Automotive Industry Revenue (Million) Forecast, by Application 2020 & 2033
- Table 12: Global Logistics Automotive Industry Revenue Million Forecast, by Service 2020 & 2033
- Table 13: Global Logistics Automotive Industry Revenue Million Forecast, by Type 2020 & 2033
- Table 14: Global Logistics Automotive Industry Revenue Million Forecast, by Country 2020 & 2033
- Table 15: United States Logistics Automotive Industry Revenue (Million) Forecast, by Application 2020 & 2033
- Table 16: Canada Logistics Automotive Industry Revenue (Million) Forecast, by Application 2020 & 2033
- Table 17: Mexico Logistics Automotive Industry Revenue (Million) Forecast, by Application 2020 & 2033
- Table 18: Global Logistics Automotive Industry Revenue Million Forecast, by Service 2020 & 2033
- Table 19: Global Logistics Automotive Industry Revenue Million Forecast, by Type 2020 & 2033
- Table 20: Global Logistics Automotive Industry Revenue Million Forecast, by Country 2020 & 2033
- Table 21: United Kingdom Logistics Automotive Industry Revenue (Million) Forecast, by Application 2020 & 2033
- Table 22: Germany Logistics Automotive Industry Revenue (Million) Forecast, by Application 2020 & 2033
- Table 23: Italy Logistics Automotive Industry Revenue (Million) Forecast, by Application 2020 & 2033
- Table 24: Russia Logistics Automotive Industry Revenue (Million) Forecast, by Application 2020 & 2033
- Table 25: France Logistics Automotive Industry Revenue (Million) Forecast, by Application 2020 & 2033
- Table 26: Rest of Europe Logistics Automotive Industry Revenue (Million) Forecast, by Application 2020 & 2033
- Table 27: Global Logistics Automotive Industry Revenue Million Forecast, by Service 2020 & 2033
- Table 28: Global Logistics Automotive Industry Revenue Million Forecast, by Type 2020 & 2033
- Table 29: Global Logistics Automotive Industry Revenue Million Forecast, by Country 2020 & 2033
- Table 30: Brazil Logistics Automotive Industry Revenue (Million) Forecast, by Application 2020 & 2033
- Table 31: Argentina Logistics Automotive Industry Revenue (Million) Forecast, by Application 2020 & 2033
- Table 32: Rest of Latin America Logistics Automotive Industry Revenue (Million) Forecast, by Application 2020 & 2033
- Table 33: Global Logistics Automotive Industry Revenue Million Forecast, by Service 2020 & 2033
- Table 34: Global Logistics Automotive Industry Revenue Million Forecast, by Type 2020 & 2033
- Table 35: Global Logistics Automotive Industry Revenue Million Forecast, by Country 2020 & 2033
- Table 36: Global Logistics Automotive Industry Revenue Million Forecast, by Service 2020 & 2033
- Table 37: Global Logistics Automotive Industry Revenue Million Forecast, by Type 2020 & 2033
- Table 38: Global Logistics Automotive Industry Revenue Million Forecast, by Country 2020 & 2033
- Table 39: United Arab Emirates Logistics Automotive Industry Revenue (Million) Forecast, by Application 2020 & 2033
- Table 40: Saudi Arabia Logistics Automotive Industry Revenue (Million) Forecast, by Application 2020 & 2033
- Table 41: Rest of Middle East Logistics Automotive Industry Revenue (Million) Forecast, by Application 2020 & 2033
Frequently Asked Questions
1. What is the projected Compound Annual Growth Rate (CAGR) of the Logistics Automotive Industry?
The projected CAGR is approximately 6.65%.
2. Which companies are prominent players in the Logistics Automotive Industry?
Key companies in the market include DB Schenker, Tiba Group, Hellmann Worldwide Logistics SE & Co KG, DHL Group, Penske Logistics Inc, Kuehne + Nagel International AG, BLG Logistics Group AG & Co KG, CFR Rinkens**List Not Exhaustive, CEVA Logistics, Expeditors, APL Logistics Ltd, XPO Logistics Inc, GEFCO SA, Panalpina, Bollore Logistics, Kerry Logistics Network Ltd, Ryder System Inc, DSV Panalpina AS.
3. What are the main segments of the Logistics Automotive Industry?
The market segments include Service, Type.
4. Can you provide details about the market size?
The market size is estimated to be USD 317.29 Million as of 2022.
5. What are some drivers contributing to market growth?
4.; Rise In Agriculture Sector and Food Industry4.; Rise In Pharmaceutical Industry.
6. What are the notable trends driving market growth?
Positive Outlook for the Automotive Sales and Production Demands Efficient Logistics Services.
7. Are there any restraints impacting market growth?
4.; Cost Constraints4.; Infrastructure Accessibility.
8. Can you provide examples of recent developments in the market?
December 2022: Delhivery, a provider of logistics services, announced the acquisition of Algorhythm Tech Pvt Ltd of Pune for INR 14.9 crores (USD 17.99 Million) in an all-cash purchase to expand its integrated supply chain solutions portfolio. By the end of January 2023, Delhivery anticipates the acquisition to be completed. At this point, Algorhythm Tech will function as a fully-owned subsidiary of the logistics company based in Gurugram.
9. What pricing options are available for accessing the report?
Pricing options include single-user, multi-user, and enterprise licenses priced at USD 4750, USD 5250, and USD 8750 respectively.
10. Is the market size provided in terms of value or volume?
The market size is provided in terms of value, measured in Million.
11. Are there any specific market keywords associated with the report?
Yes, the market keyword associated with the report is "Logistics Automotive Industry," which aids in identifying and referencing the specific market segment covered.
12. How do I determine which pricing option suits my needs best?
The pricing options vary based on user requirements and access needs. Individual users may opt for single-user licenses, while businesses requiring broader access may choose multi-user or enterprise licenses for cost-effective access to the report.
13. Are there any additional resources or data provided in the Logistics Automotive Industry report?
While the report offers comprehensive insights, it's advisable to review the specific contents or supplementary materials provided to ascertain if additional resources or data are available.
14. How can I stay updated on further developments or reports in the Logistics Automotive Industry?
To stay informed about further developments, trends, and reports in the Logistics Automotive Industry, consider subscribing to industry newsletters, following relevant companies and organizations, or regularly checking reputable industry news sources and publications.
Methodology
Step 1 - Identification of Relevant Samples Size from Population Database


Step 2 - Approaches for Defining Global Market Size (Value, Volume* & Price*)

Note*: In applicable scenarios
Step 3 - Data Sources
Primary Research
- Web Analytics
- Survey Reports
- Research Institute
- Latest Research Reports
- Opinion Leaders
Secondary Research
- Annual Reports
- White Paper
- Latest Press Release
- Industry Association
- Paid Database
- Investor Presentations

Step 4 - Data Triangulation
Involves using different sources of information in order to increase the validity of a study
These sources are likely to be stakeholders in a program - participants, other researchers, program staff, other community members, and so on.
Then we put all data in single framework & apply various statistical tools to find out the dynamic on the market.
During the analysis stage, feedback from the stakeholder groups would be compared to determine areas of agreement as well as areas of divergence