

Key Insights
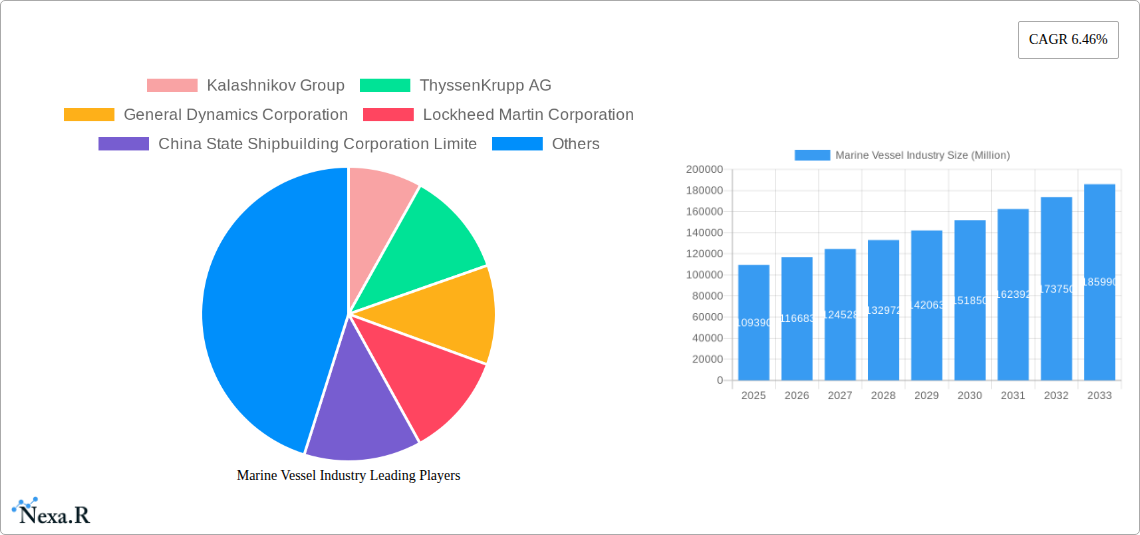
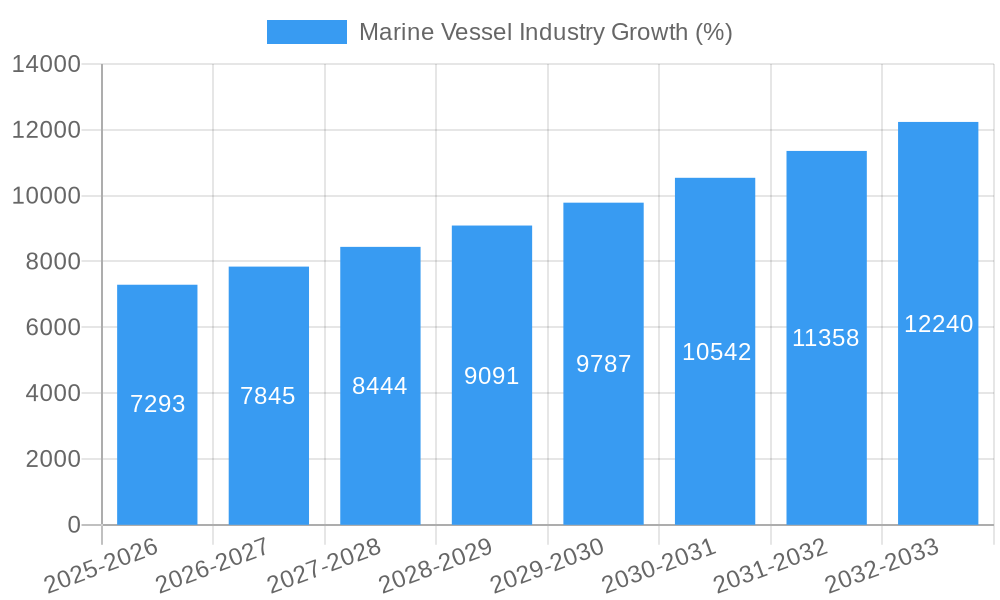
The global marine vessel industry, valued at $109.39 billion in 2025, is projected to experience robust growth, driven by increasing geopolitical instability leading to heightened naval modernization efforts, expanding global trade requiring larger and more sophisticated cargo vessels, and the rising demand for offshore energy exploration and development. The industry's Compound Annual Growth Rate (CAGR) of 6.46% from 2025 to 2033 indicates a significant expansion in market size over the forecast period. Key vessel types driving this growth include destroyers, frigates, submarines, and aircraft carriers, reflecting the emphasis on naval capabilities and defense spending. Furthermore, the growth is fueled by technological advancements in shipbuilding, including automation, AI-driven systems, and the development of environmentally friendly propulsion systems. The Asia-Pacific region, particularly China and India, is expected to dominate the market due to substantial investments in naval expansion and growing maritime trade. However, challenges such as fluctuating raw material prices, stringent environmental regulations, and supply chain disruptions could potentially restrain growth in certain segments.
Competition within the marine vessel industry is fierce, with major players like Huntington Ingalls Industries, Lockheed Martin, and BAE Systems vying for market share alongside significant international players. The market is segmented by vessel type, allowing companies to focus on specialized expertise and cater to specific customer demands. Regional variations in market growth are anticipated, with North America and Europe maintaining substantial market presence while the Asia-Pacific region experiences the most significant growth. The industry's long-term outlook remains positive, fueled by consistent investment in defense modernization and the expanding global maritime sector. However, companies must adapt to evolving technological trends and environmental regulations to remain competitive and ensure sustainable growth. Strategic partnerships, technological innovation, and a focus on efficiency are crucial elements for success in this dynamic market.
Marine Vessel Industry Market Report: 2019-2033
This comprehensive report provides an in-depth analysis of the global marine vessel industry, encompassing market dynamics, growth trends, regional dominance, product landscape, key players, and future outlook. With a study period spanning 2019-2033 (base year 2025, forecast period 2025-2033), this report is an essential resource for industry professionals, investors, and strategic decision-makers. The report segments the market by vessel type (destroyers, frigates, submarines, corvettes, aircraft carriers, and other vessel types), providing granular insights into each segment's performance and growth potential. Market values are presented in million units.
Marine Vessel Industry Market Dynamics & Structure
The marine vessel industry is characterized by a moderately concentrated market structure, with a few major players holding significant market share. Technological innovation, particularly in areas like autonomous systems and advanced materials, is a key driver. Stringent regulatory frameworks, including environmental regulations and safety standards, significantly influence industry operations. The market faces competition from alternative transportation methods, such as air freight and pipelines, particularly for certain cargo types. End-user demographics, encompassing both military and commercial sectors, impact demand patterns. The industry witnesses periodic M&A activity, driven by strategic expansion and technological synergy.
- Market Concentration: Top 5 players hold approximately xx% of the global market share in 2025 (estimated).
- Technological Innovation: Focus on automation, AI, and sustainable propulsion systems is driving innovation.
- Regulatory Landscape: Compliance with IMO standards and national regulations is crucial.
- M&A Activity: An average of xx M&A deals per year were observed during the historical period (2019-2024). This is expected to rise to xx in the forecast period.
- Innovation Barriers: High R&D costs and lengthy regulatory approval processes pose significant challenges.
Marine Vessel Industry Growth Trends & Insights
The global marine vessel market exhibited a CAGR of xx% during the historical period (2019-2024) and is projected to grow at a CAGR of xx% during the forecast period (2025-2033), reaching a market size of xx million units by 2033. This growth is fueled by increasing global trade, rising defense budgets in several countries, and the adoption of technologically advanced vessels. The market penetration rate for advanced features like autonomous navigation is expected to increase from xx% in 2025 to xx% by 2033. Consumer behavior is shifting towards more sustainable and technologically advanced vessels, impacting demand for traditional designs. Technological disruptions, particularly the advent of autonomous vessels, are reshaping industry dynamics.
Dominant Regions, Countries, or Segments in Marine Vessel Industry
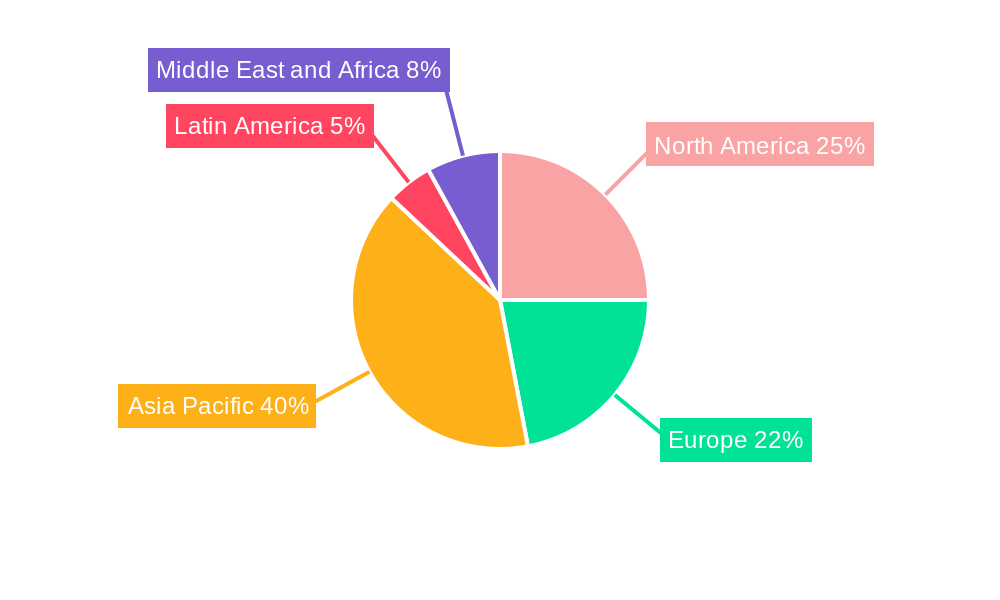
The Asia-Pacific region is expected to dominate the marine vessel market throughout the forecast period, driven by strong economic growth, significant investments in naval modernization, and a rapidly expanding commercial shipping sector. China and India are key contributors to this regional dominance. Within vessel types, the demand for frigates and corvettes is projected to experience the highest growth rates.
- Key Drivers (Asia-Pacific): Significant government spending on defense, expanding trade, and growing offshore energy exploration activities.
- Dominance Factors: Large shipbuilding capacity, lower manufacturing costs, and growing demand from both military and commercial sectors.
- Growth Potential: Strong focus on technological advancements and the development of next-generation vessels will further drive growth.
- Market Share (2025): Asia-Pacific: xx%; North America: xx%; Europe: xx%; Rest of the World: xx%.
Marine Vessel Industry Product Landscape
The marine vessel industry showcases continuous product innovation, with manufacturers focusing on enhanced fuel efficiency, improved operational capabilities, and advanced safety features. Autonomous navigation systems, advanced propulsion systems, and smart vessel management technologies are key technological advancements. Unique selling propositions include superior maneuverability, reduced operational costs, and enhanced cybersecurity features.
Key Drivers, Barriers & Challenges in Marine Vessel Industry
Key Drivers: Increasing global trade, rising defense budgets, technological advancements (automation, AI), and the growth of offshore energy exploration.
Key Challenges: High initial investment costs, stringent regulatory compliance requirements, volatile raw material prices, supply chain disruptions (experienced a xx% impact on production in 2022), and intense competition.
Emerging Opportunities in Marine Vessel Industry
Emerging opportunities lie in the development of autonomous vessels, sustainable propulsion technologies, and specialized vessels for offshore wind farm support and subsea exploration. The growing demand for high-speed ferries and cruise ships also presents significant growth potential. Untapped markets in developing economies and the increasing adoption of digital technologies offer further avenues for market expansion.
Growth Accelerators in the Marine Vessel Industry Industry
Technological breakthroughs, especially in artificial intelligence and autonomous systems, are poised to significantly accelerate market growth. Strategic partnerships between shipbuilders and technology providers will drive innovation and adoption of new technologies. Expansion into emerging markets, particularly in Africa and Latin America, will unlock further growth opportunities.
Key Players Shaping the Marine Vessel Industry Market
- Kalashnikov Group
- ThyssenKrupp AG
- General Dynamics Corporation
- Lockheed Martin Corporation
- China State Shipbuilding Corporation Limited
- Fr Lurssen Werft GmbH & Co KG
- Naval Group SA
- BAE Systems PLC
- Austal Limited
- Huntington Ingalls Industries Inc
- EDGE Group PJSC
- HD Korea Shipbuilding & Offshore Engineering Co Ltd
- Navantia SA SME
- Hanwha Ocean (Hanwha Group)
- FINCANTIERI SpA
- Damen Shipyards Group
- LARSEN & TOUBRO LIMITED
- PT PAL Indonesia
Notable Milestones in Marine Vessel Industry Sector
- April 2023: The UK Ministry of Defence awarded a USD 57 million contract to BAE Systems plc for C4I services for surface vessels.
- March 2023: The Indian Navy contracted Goa Shipyard (GSL) and Garden Reach Shipbuilders & Engineers (GRSE) to produce 11 offshore patrol vessels and six next-generation missile vessels.
In-Depth Marine Vessel Industry Market Outlook
The marine vessel industry is poised for continued growth, driven by technological advancements, expanding global trade, and increasing defense spending. Strategic partnerships, investments in research and development, and expansion into new markets will shape the industry's future. The focus on sustainability and automation will continue to influence product development and market dynamics, creating significant opportunities for innovative players.
Marine Vessel Industry Segmentation
-
1. Vessel Type
- 1.1. Destroyers
- 1.2. Frigates
- 1.3. Submarines
- 1.4. Corvettes
- 1.5. Aircraft Carriers
- 1.6. Other Vessel Types
Marine Vessel Industry Segmentation By Geography
-
1. North America
- 1.1. United States
- 1.2. Canada
-
2. Europe
- 2.1. Germany
- 2.2. United Kingdom
- 2.3. France
- 2.4. Russia
- 2.5. Spain
- 2.6. Rest of Europe
-
3. Asia Pacific
- 3.1. China
- 3.2. India
- 3.3. Japan
- 3.4. South Korea
- 3.5. Australia
- 3.6. Singapore
- 3.7. Rest of Asia Pacific
-
4. Latin America
- 4.1. Brazil
- 4.2. Mexico
- 4.3. Rest of Latin America
-
5. Middle East and Africa
- 5.1. United Arab Emirates
- 5.2. Saudi Arabia
- 5.3. South Africa
- 5.4. Rest of Middle East and Africa
Marine Vessel Industry REPORT HIGHLIGHTS
| Aspects | Details |
|---|---|
| Study Period | 2019-2033 |
| Base Year | 2024 |
| Estimated Year | 2025 |
| Forecast Period | 2025-2033 |
| Historical Period | 2019-2024 |
| Growth Rate | CAGR of 6.46% from 2019-2033 |
| Segmentation |
|
Table of Contents
- 1. Introduction
- 1.1. Research Scope
- 1.2. Market Segmentation
- 1.3. Research Methodology
- 1.4. Definitions and Assumptions
- 2. Executive Summary
- 2.1. Introduction
- 3. Market Dynamics
- 3.1. Introduction
- 3.2. Market Drivers
- 3.3. Market Restrains
- 3.4. Market Trends
- 3.4.1. Submarines Segment is Expected to Witness Significant Growth During the Forecast Period
- 4. Market Factor Analysis
- 4.1. Porters Five Forces
- 4.2. Supply/Value Chain
- 4.3. PESTEL analysis
- 4.4. Market Entropy
- 4.5. Patent/Trademark Analysis
- 5. Global Marine Vessel Industry Analysis, Insights and Forecast, 2019-2031
- 5.1. Market Analysis, Insights and Forecast - by Vessel Type
- 5.1.1. Destroyers
- 5.1.2. Frigates
- 5.1.3. Submarines
- 5.1.4. Corvettes
- 5.1.5. Aircraft Carriers
- 5.1.6. Other Vessel Types
- 5.2. Market Analysis, Insights and Forecast - by Region
- 5.2.1. North America
- 5.2.2. Europe
- 5.2.3. Asia Pacific
- 5.2.4. Latin America
- 5.2.5. Middle East and Africa
- 5.1. Market Analysis, Insights and Forecast - by Vessel Type
- 6. North America Marine Vessel Industry Analysis, Insights and Forecast, 2019-2031
- 6.1. Market Analysis, Insights and Forecast - by Vessel Type
- 6.1.1. Destroyers
- 6.1.2. Frigates
- 6.1.3. Submarines
- 6.1.4. Corvettes
- 6.1.5. Aircraft Carriers
- 6.1.6. Other Vessel Types
- 6.1. Market Analysis, Insights and Forecast - by Vessel Type
- 7. Europe Marine Vessel Industry Analysis, Insights and Forecast, 2019-2031
- 7.1. Market Analysis, Insights and Forecast - by Vessel Type
- 7.1.1. Destroyers
- 7.1.2. Frigates
- 7.1.3. Submarines
- 7.1.4. Corvettes
- 7.1.5. Aircraft Carriers
- 7.1.6. Other Vessel Types
- 7.1. Market Analysis, Insights and Forecast - by Vessel Type
- 8. Asia Pacific Marine Vessel Industry Analysis, Insights and Forecast, 2019-2031
- 8.1. Market Analysis, Insights and Forecast - by Vessel Type
- 8.1.1. Destroyers
- 8.1.2. Frigates
- 8.1.3. Submarines
- 8.1.4. Corvettes
- 8.1.5. Aircraft Carriers
- 8.1.6. Other Vessel Types
- 8.1. Market Analysis, Insights and Forecast - by Vessel Type
- 9. Latin America Marine Vessel Industry Analysis, Insights and Forecast, 2019-2031
- 9.1. Market Analysis, Insights and Forecast - by Vessel Type
- 9.1.1. Destroyers
- 9.1.2. Frigates
- 9.1.3. Submarines
- 9.1.4. Corvettes
- 9.1.5. Aircraft Carriers
- 9.1.6. Other Vessel Types
- 9.1. Market Analysis, Insights and Forecast - by Vessel Type
- 10. Middle East and Africa Marine Vessel Industry Analysis, Insights and Forecast, 2019-2031
- 10.1. Market Analysis, Insights and Forecast - by Vessel Type
- 10.1.1. Destroyers
- 10.1.2. Frigates
- 10.1.3. Submarines
- 10.1.4. Corvettes
- 10.1.5. Aircraft Carriers
- 10.1.6. Other Vessel Types
- 10.1. Market Analysis, Insights and Forecast - by Vessel Type
- 11. North America Marine Vessel Industry Analysis, Insights and Forecast, 2019-2031
- 11.1. Market Analysis, Insights and Forecast - By Country/Sub-region
- 11.1.1 United States
- 11.1.2 Canada
- 12. Europe Marine Vessel Industry Analysis, Insights and Forecast, 2019-2031
- 12.1. Market Analysis, Insights and Forecast - By Country/Sub-region
- 12.1.1 Germany
- 12.1.2 United Kingdom
- 12.1.3 France
- 12.1.4 Russia
- 12.1.5 Spain
- 12.1.6 Rest of Europe
- 13. Asia Pacific Marine Vessel Industry Analysis, Insights and Forecast, 2019-2031
- 13.1. Market Analysis, Insights and Forecast - By Country/Sub-region
- 13.1.1 China
- 13.1.2 India
- 13.1.3 Japan
- 13.1.4 South Korea
- 13.1.5 Australia
- 13.1.6 Singapore
- 13.1.7 Rest of Asia Pacific
- 14. Latin America Marine Vessel Industry Analysis, Insights and Forecast, 2019-2031
- 14.1. Market Analysis, Insights and Forecast - By Country/Sub-region
- 14.1.1 Brazil
- 14.1.2 Mexico
- 14.1.3 Rest of Latin America
- 15. Middle East and Africa Marine Vessel Industry Analysis, Insights and Forecast, 2019-2031
- 15.1. Market Analysis, Insights and Forecast - By Country/Sub-region
- 15.1.1 United Arab Emirates
- 15.1.2 Saudi Arabia
- 15.1.3 South Africa
- 15.1.4 Rest of Middle East and Africa
- 16. Competitive Analysis
- 16.1. Global Market Share Analysis 2024
- 16.2. Company Profiles
- 16.2.1 Kalashnikov Group
- 16.2.1.1. Overview
- 16.2.1.2. Products
- 16.2.1.3. SWOT Analysis
- 16.2.1.4. Recent Developments
- 16.2.1.5. Financials (Based on Availability)
- 16.2.2 ThyssenKrupp AG
- 16.2.2.1. Overview
- 16.2.2.2. Products
- 16.2.2.3. SWOT Analysis
- 16.2.2.4. Recent Developments
- 16.2.2.5. Financials (Based on Availability)
- 16.2.3 General Dynamics Corporation
- 16.2.3.1. Overview
- 16.2.3.2. Products
- 16.2.3.3. SWOT Analysis
- 16.2.3.4. Recent Developments
- 16.2.3.5. Financials (Based on Availability)
- 16.2.4 Lockheed Martin Corporation
- 16.2.4.1. Overview
- 16.2.4.2. Products
- 16.2.4.3. SWOT Analysis
- 16.2.4.4. Recent Developments
- 16.2.4.5. Financials (Based on Availability)
- 16.2.5 China State Shipbuilding Corporation Limite
- 16.2.5.1. Overview
- 16.2.5.2. Products
- 16.2.5.3. SWOT Analysis
- 16.2.5.4. Recent Developments
- 16.2.5.5. Financials (Based on Availability)
- 16.2.6 Fr Lurssen Werft Gmbh & Co KG
- 16.2.6.1. Overview
- 16.2.6.2. Products
- 16.2.6.3. SWOT Analysis
- 16.2.6.4. Recent Developments
- 16.2.6.5. Financials (Based on Availability)
- 16.2.7 Naval Group SA
- 16.2.7.1. Overview
- 16.2.7.2. Products
- 16.2.7.3. SWOT Analysis
- 16.2.7.4. Recent Developments
- 16.2.7.5. Financials (Based on Availability)
- 16.2.8 BAE Systems PLC
- 16.2.8.1. Overview
- 16.2.8.2. Products
- 16.2.8.3. SWOT Analysis
- 16.2.8.4. Recent Developments
- 16.2.8.5. Financials (Based on Availability)
- 16.2.9 Austal Limited
- 16.2.9.1. Overview
- 16.2.9.2. Products
- 16.2.9.3. SWOT Analysis
- 16.2.9.4. Recent Developments
- 16.2.9.5. Financials (Based on Availability)
- 16.2.10 Huntington Ingalls Industries Inc
- 16.2.10.1. Overview
- 16.2.10.2. Products
- 16.2.10.3. SWOT Analysis
- 16.2.10.4. Recent Developments
- 16.2.10.5. Financials (Based on Availability)
- 16.2.11 EDGE Group PJSC
- 16.2.11.1. Overview
- 16.2.11.2. Products
- 16.2.11.3. SWOT Analysis
- 16.2.11.4. Recent Developments
- 16.2.11.5. Financials (Based on Availability)
- 16.2.12 HD Korea Shipbuilding & Offshore Engineering Co Ltd
- 16.2.12.1. Overview
- 16.2.12.2. Products
- 16.2.12.3. SWOT Analysis
- 16.2.12.4. Recent Developments
- 16.2.12.5. Financials (Based on Availability)
- 16.2.13 Navantia SA SME
- 16.2.13.1. Overview
- 16.2.13.2. Products
- 16.2.13.3. SWOT Analysis
- 16.2.13.4. Recent Developments
- 16.2.13.5. Financials (Based on Availability)
- 16.2.14 Hanwha Ocean (Hanwha Group)
- 16.2.14.1. Overview
- 16.2.14.2. Products
- 16.2.14.3. SWOT Analysis
- 16.2.14.4. Recent Developments
- 16.2.14.5. Financials (Based on Availability)
- 16.2.15 FINCANTIERI SpA
- 16.2.15.1. Overview
- 16.2.15.2. Products
- 16.2.15.3. SWOT Analysis
- 16.2.15.4. Recent Developments
- 16.2.15.5. Financials (Based on Availability)
- 16.2.16 Damen Shipyards Group
- 16.2.16.1. Overview
- 16.2.16.2. Products
- 16.2.16.3. SWOT Analysis
- 16.2.16.4. Recent Developments
- 16.2.16.5. Financials (Based on Availability)
- 16.2.17 LARSEN & TOUBRO LIMITED6 3 Other Players
- 16.2.17.1. Overview
- 16.2.17.2. Products
- 16.2.17.3. SWOT Analysis
- 16.2.17.4. Recent Developments
- 16.2.17.5. Financials (Based on Availability)
- 16.2.18 PT PAL Indonesia
- 16.2.18.1. Overview
- 16.2.18.2. Products
- 16.2.18.3. SWOT Analysis
- 16.2.18.4. Recent Developments
- 16.2.18.5. Financials (Based on Availability)
- 16.2.1 Kalashnikov Group
List of Figures
- Figure 1: Global Marine Vessel Industry Revenue Breakdown (Million, %) by Region 2024 & 2032
- Figure 2: North America Marine Vessel Industry Revenue (Million), by Country 2024 & 2032
- Figure 3: North America Marine Vessel Industry Revenue Share (%), by Country 2024 & 2032
- Figure 4: Europe Marine Vessel Industry Revenue (Million), by Country 2024 & 2032
- Figure 5: Europe Marine Vessel Industry Revenue Share (%), by Country 2024 & 2032
- Figure 6: Asia Pacific Marine Vessel Industry Revenue (Million), by Country 2024 & 2032
- Figure 7: Asia Pacific Marine Vessel Industry Revenue Share (%), by Country 2024 & 2032
- Figure 8: Latin America Marine Vessel Industry Revenue (Million), by Country 2024 & 2032
- Figure 9: Latin America Marine Vessel Industry Revenue Share (%), by Country 2024 & 2032
- Figure 10: Middle East and Africa Marine Vessel Industry Revenue (Million), by Country 2024 & 2032
- Figure 11: Middle East and Africa Marine Vessel Industry Revenue Share (%), by Country 2024 & 2032
- Figure 12: North America Marine Vessel Industry Revenue (Million), by Vessel Type 2024 & 2032
- Figure 13: North America Marine Vessel Industry Revenue Share (%), by Vessel Type 2024 & 2032
- Figure 14: North America Marine Vessel Industry Revenue (Million), by Country 2024 & 2032
- Figure 15: North America Marine Vessel Industry Revenue Share (%), by Country 2024 & 2032
- Figure 16: Europe Marine Vessel Industry Revenue (Million), by Vessel Type 2024 & 2032
- Figure 17: Europe Marine Vessel Industry Revenue Share (%), by Vessel Type 2024 & 2032
- Figure 18: Europe Marine Vessel Industry Revenue (Million), by Country 2024 & 2032
- Figure 19: Europe Marine Vessel Industry Revenue Share (%), by Country 2024 & 2032
- Figure 20: Asia Pacific Marine Vessel Industry Revenue (Million), by Vessel Type 2024 & 2032
- Figure 21: Asia Pacific Marine Vessel Industry Revenue Share (%), by Vessel Type 2024 & 2032
- Figure 22: Asia Pacific Marine Vessel Industry Revenue (Million), by Country 2024 & 2032
- Figure 23: Asia Pacific Marine Vessel Industry Revenue Share (%), by Country 2024 & 2032
- Figure 24: Latin America Marine Vessel Industry Revenue (Million), by Vessel Type 2024 & 2032
- Figure 25: Latin America Marine Vessel Industry Revenue Share (%), by Vessel Type 2024 & 2032
- Figure 26: Latin America Marine Vessel Industry Revenue (Million), by Country 2024 & 2032
- Figure 27: Latin America Marine Vessel Industry Revenue Share (%), by Country 2024 & 2032
- Figure 28: Middle East and Africa Marine Vessel Industry Revenue (Million), by Vessel Type 2024 & 2032
- Figure 29: Middle East and Africa Marine Vessel Industry Revenue Share (%), by Vessel Type 2024 & 2032
- Figure 30: Middle East and Africa Marine Vessel Industry Revenue (Million), by Country 2024 & 2032
- Figure 31: Middle East and Africa Marine Vessel Industry Revenue Share (%), by Country 2024 & 2032
List of Tables
- Table 1: Global Marine Vessel Industry Revenue Million Forecast, by Region 2019 & 2032
- Table 2: Global Marine Vessel Industry Revenue Million Forecast, by Vessel Type 2019 & 2032
- Table 3: Global Marine Vessel Industry Revenue Million Forecast, by Region 2019 & 2032
- Table 4: Global Marine Vessel Industry Revenue Million Forecast, by Country 2019 & 2032
- Table 5: United States Marine Vessel Industry Revenue (Million) Forecast, by Application 2019 & 2032
- Table 6: Canada Marine Vessel Industry Revenue (Million) Forecast, by Application 2019 & 2032
- Table 7: Global Marine Vessel Industry Revenue Million Forecast, by Country 2019 & 2032
- Table 8: Germany Marine Vessel Industry Revenue (Million) Forecast, by Application 2019 & 2032
- Table 9: United Kingdom Marine Vessel Industry Revenue (Million) Forecast, by Application 2019 & 2032
- Table 10: France Marine Vessel Industry Revenue (Million) Forecast, by Application 2019 & 2032
- Table 11: Russia Marine Vessel Industry Revenue (Million) Forecast, by Application 2019 & 2032
- Table 12: Spain Marine Vessel Industry Revenue (Million) Forecast, by Application 2019 & 2032
- Table 13: Rest of Europe Marine Vessel Industry Revenue (Million) Forecast, by Application 2019 & 2032
- Table 14: Global Marine Vessel Industry Revenue Million Forecast, by Country 2019 & 2032
- Table 15: China Marine Vessel Industry Revenue (Million) Forecast, by Application 2019 & 2032
- Table 16: India Marine Vessel Industry Revenue (Million) Forecast, by Application 2019 & 2032
- Table 17: Japan Marine Vessel Industry Revenue (Million) Forecast, by Application 2019 & 2032
- Table 18: South Korea Marine Vessel Industry Revenue (Million) Forecast, by Application 2019 & 2032
- Table 19: Australia Marine Vessel Industry Revenue (Million) Forecast, by Application 2019 & 2032
- Table 20: Singapore Marine Vessel Industry Revenue (Million) Forecast, by Application 2019 & 2032
- Table 21: Rest of Asia Pacific Marine Vessel Industry Revenue (Million) Forecast, by Application 2019 & 2032
- Table 22: Global Marine Vessel Industry Revenue Million Forecast, by Country 2019 & 2032
- Table 23: Brazil Marine Vessel Industry Revenue (Million) Forecast, by Application 2019 & 2032
- Table 24: Mexico Marine Vessel Industry Revenue (Million) Forecast, by Application 2019 & 2032
- Table 25: Rest of Latin America Marine Vessel Industry Revenue (Million) Forecast, by Application 2019 & 2032
- Table 26: Global Marine Vessel Industry Revenue Million Forecast, by Country 2019 & 2032
- Table 27: United Arab Emirates Marine Vessel Industry Revenue (Million) Forecast, by Application 2019 & 2032
- Table 28: Saudi Arabia Marine Vessel Industry Revenue (Million) Forecast, by Application 2019 & 2032
- Table 29: South Africa Marine Vessel Industry Revenue (Million) Forecast, by Application 2019 & 2032
- Table 30: Rest of Middle East and Africa Marine Vessel Industry Revenue (Million) Forecast, by Application 2019 & 2032
- Table 31: Global Marine Vessel Industry Revenue Million Forecast, by Vessel Type 2019 & 2032
- Table 32: Global Marine Vessel Industry Revenue Million Forecast, by Country 2019 & 2032
- Table 33: United States Marine Vessel Industry Revenue (Million) Forecast, by Application 2019 & 2032
- Table 34: Canada Marine Vessel Industry Revenue (Million) Forecast, by Application 2019 & 2032
- Table 35: Global Marine Vessel Industry Revenue Million Forecast, by Vessel Type 2019 & 2032
- Table 36: Global Marine Vessel Industry Revenue Million Forecast, by Country 2019 & 2032
- Table 37: Germany Marine Vessel Industry Revenue (Million) Forecast, by Application 2019 & 2032
- Table 38: United Kingdom Marine Vessel Industry Revenue (Million) Forecast, by Application 2019 & 2032
- Table 39: France Marine Vessel Industry Revenue (Million) Forecast, by Application 2019 & 2032
- Table 40: Russia Marine Vessel Industry Revenue (Million) Forecast, by Application 2019 & 2032
- Table 41: Spain Marine Vessel Industry Revenue (Million) Forecast, by Application 2019 & 2032
- Table 42: Rest of Europe Marine Vessel Industry Revenue (Million) Forecast, by Application 2019 & 2032
- Table 43: Global Marine Vessel Industry Revenue Million Forecast, by Vessel Type 2019 & 2032
- Table 44: Global Marine Vessel Industry Revenue Million Forecast, by Country 2019 & 2032
- Table 45: China Marine Vessel Industry Revenue (Million) Forecast, by Application 2019 & 2032
- Table 46: India Marine Vessel Industry Revenue (Million) Forecast, by Application 2019 & 2032
- Table 47: Japan Marine Vessel Industry Revenue (Million) Forecast, by Application 2019 & 2032
- Table 48: South Korea Marine Vessel Industry Revenue (Million) Forecast, by Application 2019 & 2032
- Table 49: Australia Marine Vessel Industry Revenue (Million) Forecast, by Application 2019 & 2032
- Table 50: Singapore Marine Vessel Industry Revenue (Million) Forecast, by Application 2019 & 2032
- Table 51: Rest of Asia Pacific Marine Vessel Industry Revenue (Million) Forecast, by Application 2019 & 2032
- Table 52: Global Marine Vessel Industry Revenue Million Forecast, by Vessel Type 2019 & 2032
- Table 53: Global Marine Vessel Industry Revenue Million Forecast, by Country 2019 & 2032
- Table 54: Brazil Marine Vessel Industry Revenue (Million) Forecast, by Application 2019 & 2032
- Table 55: Mexico Marine Vessel Industry Revenue (Million) Forecast, by Application 2019 & 2032
- Table 56: Rest of Latin America Marine Vessel Industry Revenue (Million) Forecast, by Application 2019 & 2032
- Table 57: Global Marine Vessel Industry Revenue Million Forecast, by Vessel Type 2019 & 2032
- Table 58: Global Marine Vessel Industry Revenue Million Forecast, by Country 2019 & 2032
- Table 59: United Arab Emirates Marine Vessel Industry Revenue (Million) Forecast, by Application 2019 & 2032
- Table 60: Saudi Arabia Marine Vessel Industry Revenue (Million) Forecast, by Application 2019 & 2032
- Table 61: South Africa Marine Vessel Industry Revenue (Million) Forecast, by Application 2019 & 2032
- Table 62: Rest of Middle East and Africa Marine Vessel Industry Revenue (Million) Forecast, by Application 2019 & 2032
Frequently Asked Questions
1. What is the projected Compound Annual Growth Rate (CAGR) of the Marine Vessel Industry?
The projected CAGR is approximately 6.46%.
2. Which companies are prominent players in the Marine Vessel Industry?
Key companies in the market include Kalashnikov Group, ThyssenKrupp AG, General Dynamics Corporation, Lockheed Martin Corporation, China State Shipbuilding Corporation Limite, Fr Lurssen Werft Gmbh & Co KG, Naval Group SA, BAE Systems PLC, Austal Limited, Huntington Ingalls Industries Inc, EDGE Group PJSC, HD Korea Shipbuilding & Offshore Engineering Co Ltd, Navantia SA SME, Hanwha Ocean (Hanwha Group), FINCANTIERI SpA, Damen Shipyards Group, LARSEN & TOUBRO LIMITED6 3 Other Players, PT PAL Indonesia.
3. What are the main segments of the Marine Vessel Industry?
The market segments include Vessel Type.
4. Can you provide details about the market size?
The market size is estimated to be USD 109.39 Million as of 2022.
5. What are some drivers contributing to market growth?
N/A
6. What are the notable trends driving market growth?
Submarines Segment is Expected to Witness Significant Growth During the Forecast Period.
7. Are there any restraints impacting market growth?
N/A
8. Can you provide examples of recent developments in the market?
April 2023: The UK Ministry of Defence awarded a USD 57 million contract to BAE Systems plc to support communication, command, control, computer, and intelligence (C4I) services for surface vessels. According to the contract, BAE Systems will likely be able to help with C4I services and data deliverables throughout the five phases of shipboard integration.
9. What pricing options are available for accessing the report?
Pricing options include single-user, multi-user, and enterprise licenses priced at USD 4750, USD 5250, and USD 8750 respectively.
10. Is the market size provided in terms of value or volume?
The market size is provided in terms of value, measured in Million.
11. Are there any specific market keywords associated with the report?
Yes, the market keyword associated with the report is "Marine Vessel Industry," which aids in identifying and referencing the specific market segment covered.
12. How do I determine which pricing option suits my needs best?
The pricing options vary based on user requirements and access needs. Individual users may opt for single-user licenses, while businesses requiring broader access may choose multi-user or enterprise licenses for cost-effective access to the report.
13. Are there any additional resources or data provided in the Marine Vessel Industry report?
While the report offers comprehensive insights, it's advisable to review the specific contents or supplementary materials provided to ascertain if additional resources or data are available.
14. How can I stay updated on further developments or reports in the Marine Vessel Industry?
To stay informed about further developments, trends, and reports in the Marine Vessel Industry, consider subscribing to industry newsletters, following relevant companies and organizations, or regularly checking reputable industry news sources and publications.
Methodology
Step 1 - Identification of Relevant Samples Size from Population Database


Step 2 - Approaches for Defining Global Market Size (Value, Volume* & Price*)

Note*: In applicable scenarios
Step 3 - Data Sources
Primary Research
- Web Analytics
- Survey Reports
- Research Institute
- Latest Research Reports
- Opinion Leaders
Secondary Research
- Annual Reports
- White Paper
- Latest Press Release
- Industry Association
- Paid Database
- Investor Presentations

Step 4 - Data Triangulation
Involves using different sources of information in order to increase the validity of a study
These sources are likely to be stakeholders in a program - participants, other researchers, program staff, other community members, and so on.
Then we put all data in single framework & apply various statistical tools to find out the dynamic on the market.
During the analysis stage, feedback from the stakeholder groups would be compared to determine areas of agreement as well as areas of divergence
