

Key Insights
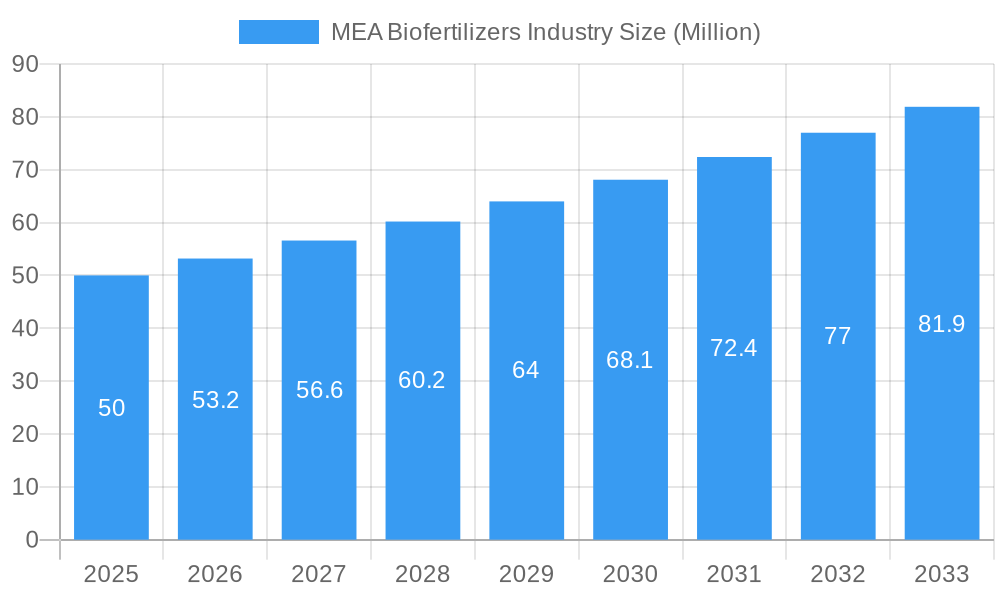
The Middle East and Africa (MEA) Biofertilizers Industry is poised for significant growth, with a projected market size reaching $50 million by 2025, growing at a Compound Annual Growth Rate (CAGR) of 6.40% through to 2033. The demand for biofertilizers in the MEA region is driven by the increasing adoption of sustainable agricultural practices and the need to improve soil health and crop yields. Key drivers include the growing awareness of environmental sustainability, government initiatives promoting organic farming, and the need to reduce dependency on chemical fertilizers. The market is segmented by crop type, microorganism type, technology type, and application, with grains and cereals being the dominant crop type due to their widespread cultivation in the region. Rhizobium and Phosphate Solubilizing Bacteria are the leading microorganisms used in biofertilizers, reflecting their efficacy in enhancing soil fertility.
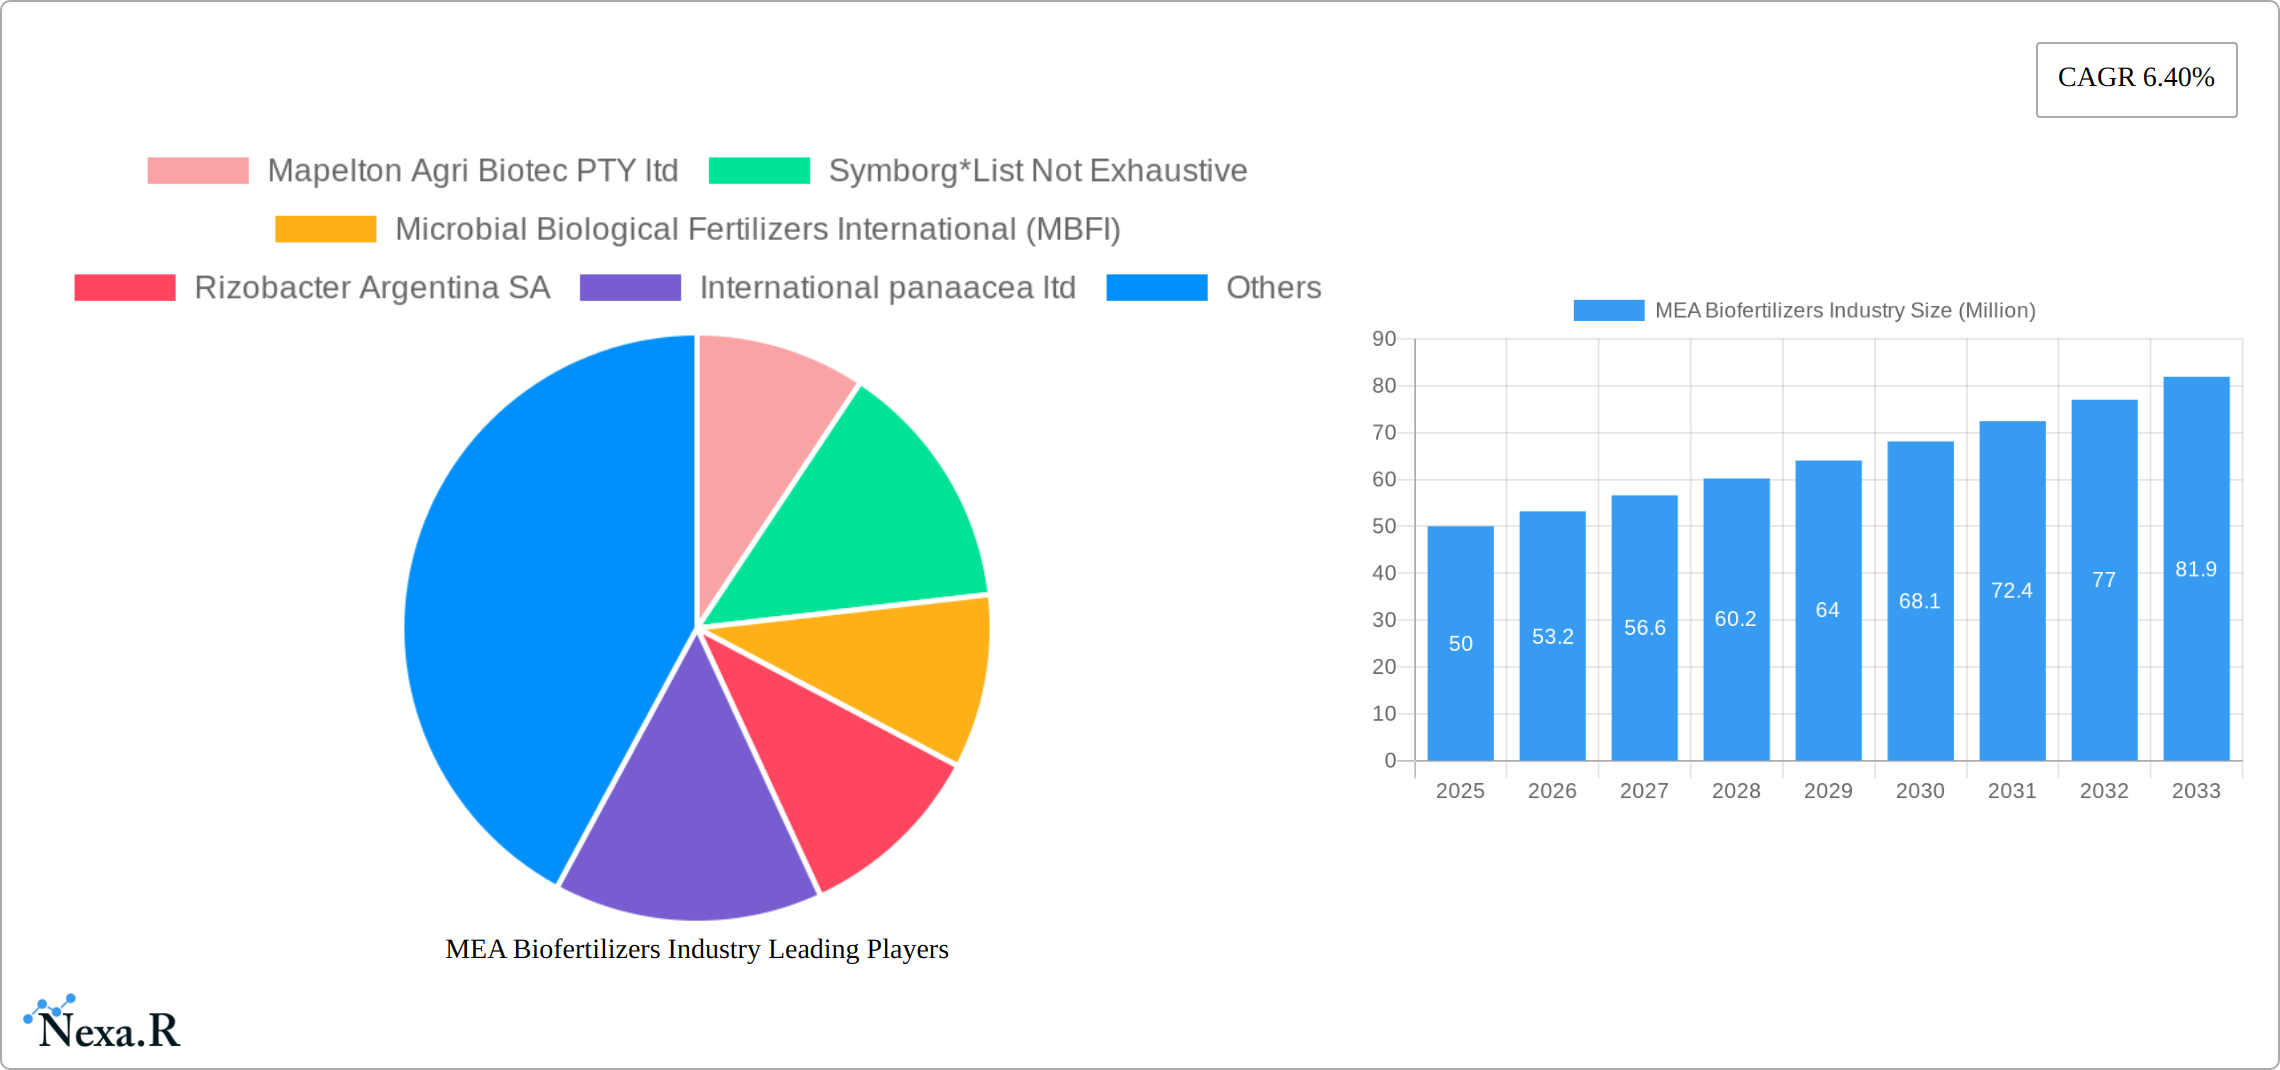
MEA Biofertilizers Industry Market Size (In Million)
In terms of regional market dynamics, the United Arab Emirates, Saudi Arabia, and South Africa are the leading contributors to the MEA Biofertilizers Industry. The UAE and Saudi Arabia are investing heavily in agricultural innovation to reduce food import dependency, while South Africa's focus on sustainable farming practices supports the growth of the biofertilizers market. The market is further segmented by technology, with carrier-enriched biofertilizers holding a significant share due to their stability and ease of application. Liquid biofertilizers are also gaining traction, driven by their convenience and effectiveness. Key players such as Mapelton Agri Biotec PTY Ltd, Symborg, and Microbial Biological Fertilizers International (MBFI) are at the forefront of market expansion, offering innovative solutions tailored to the region's agricultural needs. The forecast period from 2025 to 2033 is expected to witness continued growth, supported by ongoing research and development in biofertilizer technologies.
MEA Biofertilizers Industry Company Market Share
MEA Biofertilizers Industry Market Report: 2019-2033
This comprehensive report provides a detailed analysis of the Middle East and Africa (MEA) biofertilizers industry, covering market dynamics, growth trends, regional dominance, product landscape, key players, and future outlook. The study period spans from 2019 to 2033, with 2025 serving as the base and estimated year. This report is invaluable for industry professionals, investors, and strategic decision-makers seeking to navigate this rapidly evolving market.
Keywords: MEA Biofertilizers, Biofertilizers Market, Middle East Africa Biofertilizers, Biofertilizer Industry, Rhizobium, Azospirillum, Phosphate Solubilizing Bacteria, Carrier-enriched Biofertilizers, Liquid Biofertilizers, Grains and Cereals, Pulses and Oilseeds, Market Size, Market Growth, Market Share, CAGR, Market Analysis, Market Forecast, Industry Trends, Competitive Landscape.
MEA Biofertilizers Industry Market Dynamics & Structure
This section analyzes the MEA biofertilizers market's structure, competitive dynamics, and influencing factors. We delve into market concentration, examining the share held by key players like Mapelton Agri Biotec PTY ltd, Symborg, Microbial Biological Fertilizers International (MBFI), Rizobacter Argentina SA, International Panacea Ltd, and Agrilife (List Not Exhaustive). The report quantifies market share percentages and analyzes M&A activity (xx deals in the historical period), highlighting trends in consolidation. Technological innovation, including advancements in formulation and application methods (e.g., the shift towards liquid biofertilizers), and regulatory frameworks impacting market access are also explored. The analysis further considers the impact of competitive substitutes (e.g., chemical fertilizers) and evolving end-user demographics (e.g., increasing adoption by smallholder farmers). Innovation barriers, such as high R&D costs and the need for extensive field trials, are also discussed.
- Market Concentration: xx% held by top 5 players (2025).
- M&A Activity: xx deals (2019-2024), xx predicted (2025-2033).
- Regulatory Landscape: Analysis of key regulations and their impact on market entry and growth.
- Technological Innovation: Focus on advancements in carrier technologies and microorganism strains.
MEA Biofertilizers Industry Growth Trends & Insights
Leveraging extensive primary and secondary research, this section presents a detailed analysis of the MEA biofertilizers market's growth trajectory. We examine market size evolution (from xx million in 2019 to xx million in 2024 and projected to xx million in 2033), highlighting the CAGR (xx%) during the forecast period (2025-2033). The analysis explores the factors driving adoption rates, including increasing awareness of sustainable agriculture practices, government support for biofertilizer adoption, and the rising demand for food security. Technological disruptions, such as the development of advanced formulations and application technologies, and consumer behavior shifts towards environmentally friendly agricultural practices are thoroughly examined. The report offers granular insights into market penetration rates across different crop types and regions within the MEA.
- Market Size (2019): xx Million
- Market Size (2024): xx Million
- Market Size (2033): xx Million
- CAGR (2025-2033): xx%
Dominant Regions, Countries, or Segments in MEA Biofertilizers Industry
The MEA biofertilizers market is experiencing dynamic growth, with several key regions, countries, and segments leading the charge. This analysis identifies the dominant players based on a comprehensive assessment of market share, growth trajectories, and specific market drivers. For instance, the robust adoption of biofertilizers in the cultivation of grains and cereals, which held an [Insert Precise Percentage]% market share in 2025, is particularly notable in countries like Egypt and Kenya. This success stems from factors such as favorable government policies and the inherent suitability of these crops for biofertilizer application. Further analysis reveals the market dominance of specific microorganism types (e.g., Rhizobium, [Add another dominant type with percentage share if available]), driven by their efficacy in enhancing nutrient uptake. Similarly, liquid biofertilizers, currently holding a [Insert Percentage]% market share, represent a dominant technology type due to their ease of application and cost-effectiveness. The analysis also considers regional variations, factoring in economic policies supporting sustainable agriculture, infrastructure development (such as irrigation systems that influence application methods), and climatic conditions influencing crop suitability. These factors play a crucial role in shaping the unique characteristics of this diverse market.
- Leading Region: [Specific Region, e.g., North Africa] based on a projected [Insert Percentage]% market share and a [Insert Percentage]% growth rate in 2025. This dominance is attributed to [ Briefly explain reason, e.g., high agricultural output and government support for sustainable farming practices].
- Leading Country: [Specific Country, e.g., Egypt] based on a projected [Insert Percentage]% market share and a [Insert Percentage]% growth rate in 2025. This strong performance is driven by [ Briefly explain reason, e.g., significant investments in agricultural infrastructure and a growing awareness of environmentally friendly farming methods].
- Dominant Crop Type: [Specific Crop Type, e.g., Wheat] holding a [Insert Percentage]% market share. Growth is fueled by [ Briefly explain reason, e.g., high demand, suitability for biofertilizer application, and government incentives].
- Dominant Microorganism Type: [Specific Microorganism, e.g., Rhizobium] with a market share of [Insert Percentage]%. Its dominance stems from [ Briefly explain reason, e.g., proven efficacy in nitrogen fixation and compatibility with various crops].
- Dominant Technology Type: [Specific Technology, e.g., Liquid Biofertilizers] representing [Insert Percentage]% of the market. This is largely due to [ Briefly explain reason, e.g., ease of application, cost-effectiveness, and reduced storage requirements].
MEA Biofertilizers Industry Product Landscape
The MEA biofertilizers market offers diverse products, including carrier-enriched and liquid formulations tailored to specific crop types and microorganisms. This section highlights notable product innovations, focusing on unique selling propositions such as improved efficacy, ease of application, and shelf life. Technological advancements driving product differentiation (e.g., enhanced microbial strains, advanced carrier materials) are also discussed. The analysis covers performance metrics such as yield enhancement and cost-effectiveness, demonstrating the value proposition for end-users.
Key Drivers, Barriers & Challenges in MEA Biofertilizers Industry
Key Drivers: The MEA biofertilizers market is propelled by factors such as increasing awareness of sustainable agriculture, government initiatives promoting biofertilizer adoption (e.g., subsidies and awareness campaigns), and rising demand for food security. Technological advancements, such as improved formulations and application methods, further enhance market growth.
Key Barriers & Challenges: Supply chain limitations (e.g., inadequate storage and distribution infrastructure), regulatory hurdles (e.g., complex registration processes), and competitive pressures from established chemical fertilizer manufacturers present challenges. The lack of awareness among farmers, especially in rural areas, and the high initial investment cost of adopting biofertilizers are further obstacles. These challenges have resulted in a xx% reduction in market penetration in [Specific Region] during the historical period.
Emerging Opportunities in MEA Biofertilizers Industry
Emerging opportunities lie in untapped markets within the MEA region, particularly in less-developed agricultural sectors. Innovative applications of biofertilizers, such as in integrated pest management and soil remediation, offer significant potential. Evolving consumer preferences toward organic and sustainable food production create further market expansion opportunities. Specific opportunities include the development of customized biofertilizer solutions for specific crop types and regional climates.
Growth Accelerators in the MEA Biofertilizers Industry
Several factors are propelling the growth of the MEA biofertilizers industry. Significant technological advancements in microorganism strain development and formulation techniques are creating more effective and efficient biofertilizers. Strategic partnerships between biofertilizer producers, agricultural input suppliers, and farmers' organizations are streamlining distribution and enhancing market penetration. Crucially, targeted education and training programs are boosting farmer awareness and adoption rates, ensuring the long-term success of the industry. Furthermore, supportive government policies, including subsidies and incentives, are creating a favorable environment for growth.
Key Players Shaping the MEA Biofertilizers Industry Market
- Mapelton Agri Biotec PTY ltd
- Symborg
- Microbial Biological Fertilizers International (MBFI)
- Rizobacter Argentina SA
- International Panacea Ltd
- Agrilife
- [Add other key players with links if available]
Notable Milestones in MEA Biofertilizers Industry Sector
- 2020: Launch of a new liquid biofertilizer formulation by [Company Name] resulting in [quantifiable result, e.g., a 15% increase in sales].
- 2022: Government initiative in [Country, e.g., Morocco] providing subsidies for biofertilizer adoption, leading to [quantifiable result, e.g., a 20% increase in biofertilizer usage].
- 2023: Merger between [Company Name] and [Company Name], creating a larger market player with expanded distribution capabilities.
- 2024: Successful field trials demonstrating improved crop yields with a new biofertilizer product, showcasing a [quantifiable result, e.g., 10-15%] yield increase compared to control groups.
- [Add other notable milestones with quantifiable results where possible]
In-Depth MEA Biofertilizers Industry Market Outlook
The MEA biofertilizers market presents a compelling investment opportunity, driven by escalating awareness of sustainable agriculture practices, continuous technological advancements, and increasingly supportive government policies. Key strategic avenues for growth include developing customized biofertilizer solutions tailored to specific crops and regional climates. Expanding distribution networks to reach a wider farmer base is crucial, alongside substantial investments in research and development to further enhance product efficacy and broaden the range of applications. The market is projected to experience significant expansion throughout the forecast period, surpassing the growth rates of traditional chemical fertilizers, with an anticipated [Insert Projected Growth Rate]% increase [Insert Timeframe, e.g., by 2030]. This robust outlook underscores the vital role biofertilizers will play in ensuring food security and promoting environmentally sustainable agricultural practices across the MEA region.
MEA Biofertilizers Industry Segmentation
- 1. Production Analysis
- 2. Consumption Analysis
- 3. Import Market Analysis (Value & Volume)
- 4. Export Market Analysis (Value & Volume)
- 5. Price Trend Analysis
MEA Biofertilizers Industry Segmentation By Geography
-
1. North America
- 1.1. United States
- 1.2. Canada
- 1.3. Mexico
-
2. South America
- 2.1. Brazil
- 2.2. Argentina
- 2.3. Rest of South America
-
3. Europe
- 3.1. United Kingdom
- 3.2. Germany
- 3.3. France
- 3.4. Italy
- 3.5. Spain
- 3.6. Russia
- 3.7. Benelux
- 3.8. Nordics
- 3.9. Rest of Europe
-
4. Middle East & Africa
- 4.1. Turkey
- 4.2. Israel
- 4.3. GCC
- 4.4. North Africa
- 4.5. South Africa
- 4.6. Rest of Middle East & Africa
-
5. Asia Pacific
- 5.1. China
- 5.2. India
- 5.3. Japan
- 5.4. South Korea
- 5.5. ASEAN
- 5.6. Oceania
- 5.7. Rest of Asia Pacific
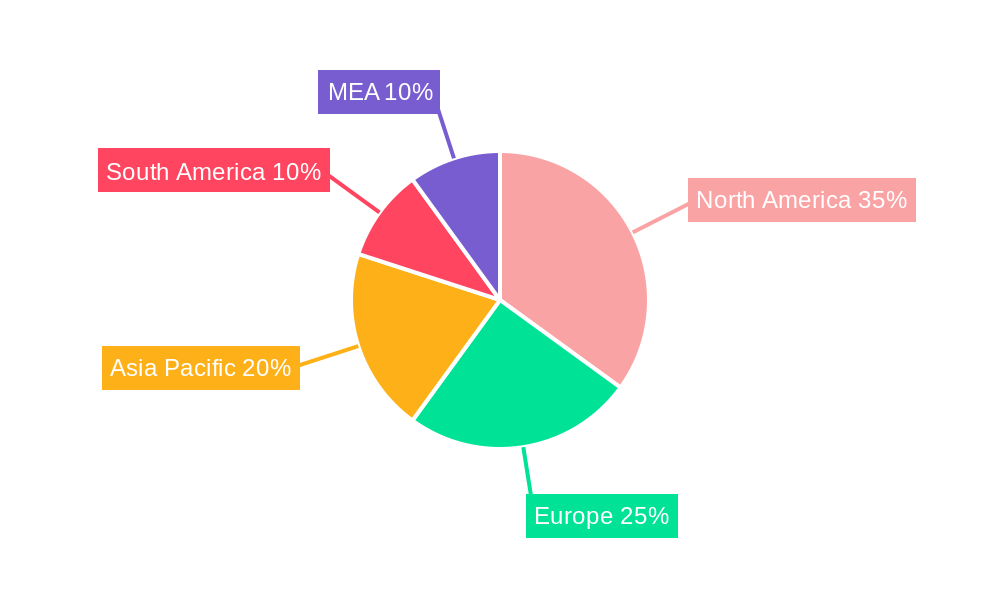
MEA Biofertilizers Industry Regional Market Share
Geographic Coverage of MEA Biofertilizers Industry
MEA Biofertilizers Industry REPORT HIGHLIGHTS
| Aspects | Details |
|---|---|
| Study Period | 2020-2034 |
| Base Year | 2025 |
| Estimated Year | 2026 |
| Forecast Period | 2026-2034 |
| Historical Period | 2020-2025 |
| Growth Rate | CAGR of 11.1% from 2020-2034 |
| Segmentation |
|
Table of Contents
- 1. Introduction
- 1.1. Research Scope
- 1.2. Market Segmentation
- 1.3. Research Methodology
- 1.4. Definitions and Assumptions
- 2. Executive Summary
- 2.1. Introduction
- 3. Market Dynamics
- 3.1. Introduction
- 3.2. Market Drivers
- 3.2.1. Seed Treatment As A Solution To Enhance Yield; Growing Awareness For Seed Treatment Among The Farmers; Rising Trend Of Organic Farming
- 3.3. Market Restrains
- 3.3.1. Limitations Across Farm-Level Seed Treatment; Rising Environmental Concerns
- 3.4. Market Trends
- 3.4.1. Increased Food Demand and Need for Sustainable Agricultural Development
- 4. Market Factor Analysis
- 4.1. Porters Five Forces
- 4.2. Supply/Value Chain
- 4.3. PESTEL analysis
- 4.4. Market Entropy
- 4.5. Patent/Trademark Analysis
- 5. Global MEA Biofertilizers Industry Analysis, Insights and Forecast, 2020-2032
- 5.1. Market Analysis, Insights and Forecast - by Production Analysis
- 5.2. Market Analysis, Insights and Forecast - by Consumption Analysis
- 5.3. Market Analysis, Insights and Forecast - by Import Market Analysis (Value & Volume)
- 5.4. Market Analysis, Insights and Forecast - by Export Market Analysis (Value & Volume)
- 5.5. Market Analysis, Insights and Forecast - by Price Trend Analysis
- 5.6. Market Analysis, Insights and Forecast - by Region
- 5.6.1. North America
- 5.6.2. South America
- 5.6.3. Europe
- 5.6.4. Middle East & Africa
- 5.6.5. Asia Pacific
- 5.1. Market Analysis, Insights and Forecast - by Production Analysis
- 6. North America MEA Biofertilizers Industry Analysis, Insights and Forecast, 2020-2032
- 6.1. Market Analysis, Insights and Forecast - by Production Analysis
- 6.2. Market Analysis, Insights and Forecast - by Consumption Analysis
- 6.3. Market Analysis, Insights and Forecast - by Import Market Analysis (Value & Volume)
- 6.4. Market Analysis, Insights and Forecast - by Export Market Analysis (Value & Volume)
- 6.5. Market Analysis, Insights and Forecast - by Price Trend Analysis
- 6.1. Market Analysis, Insights and Forecast - by Production Analysis
- 7. South America MEA Biofertilizers Industry Analysis, Insights and Forecast, 2020-2032
- 7.1. Market Analysis, Insights and Forecast - by Production Analysis
- 7.2. Market Analysis, Insights and Forecast - by Consumption Analysis
- 7.3. Market Analysis, Insights and Forecast - by Import Market Analysis (Value & Volume)
- 7.4. Market Analysis, Insights and Forecast - by Export Market Analysis (Value & Volume)
- 7.5. Market Analysis, Insights and Forecast - by Price Trend Analysis
- 7.1. Market Analysis, Insights and Forecast - by Production Analysis
- 8. Europe MEA Biofertilizers Industry Analysis, Insights and Forecast, 2020-2032
- 8.1. Market Analysis, Insights and Forecast - by Production Analysis
- 8.2. Market Analysis, Insights and Forecast - by Consumption Analysis
- 8.3. Market Analysis, Insights and Forecast - by Import Market Analysis (Value & Volume)
- 8.4. Market Analysis, Insights and Forecast - by Export Market Analysis (Value & Volume)
- 8.5. Market Analysis, Insights and Forecast - by Price Trend Analysis
- 8.1. Market Analysis, Insights and Forecast - by Production Analysis
- 9. Middle East & Africa MEA Biofertilizers Industry Analysis, Insights and Forecast, 2020-2032
- 9.1. Market Analysis, Insights and Forecast - by Production Analysis
- 9.2. Market Analysis, Insights and Forecast - by Consumption Analysis
- 9.3. Market Analysis, Insights and Forecast - by Import Market Analysis (Value & Volume)
- 9.4. Market Analysis, Insights and Forecast - by Export Market Analysis (Value & Volume)
- 9.5. Market Analysis, Insights and Forecast - by Price Trend Analysis
- 9.1. Market Analysis, Insights and Forecast - by Production Analysis
- 10. Asia Pacific MEA Biofertilizers Industry Analysis, Insights and Forecast, 2020-2032
- 10.1. Market Analysis, Insights and Forecast - by Production Analysis
- 10.2. Market Analysis, Insights and Forecast - by Consumption Analysis
- 10.3. Market Analysis, Insights and Forecast - by Import Market Analysis (Value & Volume)
- 10.4. Market Analysis, Insights and Forecast - by Export Market Analysis (Value & Volume)
- 10.5. Market Analysis, Insights and Forecast - by Price Trend Analysis
- 10.1. Market Analysis, Insights and Forecast - by Production Analysis
- 11. Competitive Analysis
- 11.1. Global Market Share Analysis 2025
- 11.2. Company Profiles
- 11.2.1 Mapelton Agri Biotec PTY ltd
- 11.2.1.1. Overview
- 11.2.1.2. Products
- 11.2.1.3. SWOT Analysis
- 11.2.1.4. Recent Developments
- 11.2.1.5. Financials (Based on Availability)
- 11.2.2 Symborg*List Not Exhaustive
- 11.2.2.1. Overview
- 11.2.2.2. Products
- 11.2.2.3. SWOT Analysis
- 11.2.2.4. Recent Developments
- 11.2.2.5. Financials (Based on Availability)
- 11.2.3 Microbial Biological Fertilizers International (MBFI)
- 11.2.3.1. Overview
- 11.2.3.2. Products
- 11.2.3.3. SWOT Analysis
- 11.2.3.4. Recent Developments
- 11.2.3.5. Financials (Based on Availability)
- 11.2.4 Rizobacter Argentina SA
- 11.2.4.1. Overview
- 11.2.4.2. Products
- 11.2.4.3. SWOT Analysis
- 11.2.4.4. Recent Developments
- 11.2.4.5. Financials (Based on Availability)
- 11.2.5 International panaacea ltd
- 11.2.5.1. Overview
- 11.2.5.2. Products
- 11.2.5.3. SWOT Analysis
- 11.2.5.4. Recent Developments
- 11.2.5.5. Financials (Based on Availability)
- 11.2.6 Agrilife
- 11.2.6.1. Overview
- 11.2.6.2. Products
- 11.2.6.3. SWOT Analysis
- 11.2.6.4. Recent Developments
- 11.2.6.5. Financials (Based on Availability)
- 11.2.1 Mapelton Agri Biotec PTY ltd
List of Figures
- Figure 1: Global MEA Biofertilizers Industry Revenue Breakdown (undefined, %) by Region 2025 & 2033
- Figure 2: North America MEA Biofertilizers Industry Revenue (undefined), by Production Analysis 2025 & 2033
- Figure 3: North America MEA Biofertilizers Industry Revenue Share (%), by Production Analysis 2025 & 2033
- Figure 4: North America MEA Biofertilizers Industry Revenue (undefined), by Consumption Analysis 2025 & 2033
- Figure 5: North America MEA Biofertilizers Industry Revenue Share (%), by Consumption Analysis 2025 & 2033
- Figure 6: North America MEA Biofertilizers Industry Revenue (undefined), by Import Market Analysis (Value & Volume) 2025 & 2033
- Figure 7: North America MEA Biofertilizers Industry Revenue Share (%), by Import Market Analysis (Value & Volume) 2025 & 2033
- Figure 8: North America MEA Biofertilizers Industry Revenue (undefined), by Export Market Analysis (Value & Volume) 2025 & 2033
- Figure 9: North America MEA Biofertilizers Industry Revenue Share (%), by Export Market Analysis (Value & Volume) 2025 & 2033
- Figure 10: North America MEA Biofertilizers Industry Revenue (undefined), by Price Trend Analysis 2025 & 2033
- Figure 11: North America MEA Biofertilizers Industry Revenue Share (%), by Price Trend Analysis 2025 & 2033
- Figure 12: North America MEA Biofertilizers Industry Revenue (undefined), by Country 2025 & 2033
- Figure 13: North America MEA Biofertilizers Industry Revenue Share (%), by Country 2025 & 2033
- Figure 14: South America MEA Biofertilizers Industry Revenue (undefined), by Production Analysis 2025 & 2033
- Figure 15: South America MEA Biofertilizers Industry Revenue Share (%), by Production Analysis 2025 & 2033
- Figure 16: South America MEA Biofertilizers Industry Revenue (undefined), by Consumption Analysis 2025 & 2033
- Figure 17: South America MEA Biofertilizers Industry Revenue Share (%), by Consumption Analysis 2025 & 2033
- Figure 18: South America MEA Biofertilizers Industry Revenue (undefined), by Import Market Analysis (Value & Volume) 2025 & 2033
- Figure 19: South America MEA Biofertilizers Industry Revenue Share (%), by Import Market Analysis (Value & Volume) 2025 & 2033
- Figure 20: South America MEA Biofertilizers Industry Revenue (undefined), by Export Market Analysis (Value & Volume) 2025 & 2033
- Figure 21: South America MEA Biofertilizers Industry Revenue Share (%), by Export Market Analysis (Value & Volume) 2025 & 2033
- Figure 22: South America MEA Biofertilizers Industry Revenue (undefined), by Price Trend Analysis 2025 & 2033
- Figure 23: South America MEA Biofertilizers Industry Revenue Share (%), by Price Trend Analysis 2025 & 2033
- Figure 24: South America MEA Biofertilizers Industry Revenue (undefined), by Country 2025 & 2033
- Figure 25: South America MEA Biofertilizers Industry Revenue Share (%), by Country 2025 & 2033
- Figure 26: Europe MEA Biofertilizers Industry Revenue (undefined), by Production Analysis 2025 & 2033
- Figure 27: Europe MEA Biofertilizers Industry Revenue Share (%), by Production Analysis 2025 & 2033
- Figure 28: Europe MEA Biofertilizers Industry Revenue (undefined), by Consumption Analysis 2025 & 2033
- Figure 29: Europe MEA Biofertilizers Industry Revenue Share (%), by Consumption Analysis 2025 & 2033
- Figure 30: Europe MEA Biofertilizers Industry Revenue (undefined), by Import Market Analysis (Value & Volume) 2025 & 2033
- Figure 31: Europe MEA Biofertilizers Industry Revenue Share (%), by Import Market Analysis (Value & Volume) 2025 & 2033
- Figure 32: Europe MEA Biofertilizers Industry Revenue (undefined), by Export Market Analysis (Value & Volume) 2025 & 2033
- Figure 33: Europe MEA Biofertilizers Industry Revenue Share (%), by Export Market Analysis (Value & Volume) 2025 & 2033
- Figure 34: Europe MEA Biofertilizers Industry Revenue (undefined), by Price Trend Analysis 2025 & 2033
- Figure 35: Europe MEA Biofertilizers Industry Revenue Share (%), by Price Trend Analysis 2025 & 2033
- Figure 36: Europe MEA Biofertilizers Industry Revenue (undefined), by Country 2025 & 2033
- Figure 37: Europe MEA Biofertilizers Industry Revenue Share (%), by Country 2025 & 2033
- Figure 38: Middle East & Africa MEA Biofertilizers Industry Revenue (undefined), by Production Analysis 2025 & 2033
- Figure 39: Middle East & Africa MEA Biofertilizers Industry Revenue Share (%), by Production Analysis 2025 & 2033
- Figure 40: Middle East & Africa MEA Biofertilizers Industry Revenue (undefined), by Consumption Analysis 2025 & 2033
- Figure 41: Middle East & Africa MEA Biofertilizers Industry Revenue Share (%), by Consumption Analysis 2025 & 2033
- Figure 42: Middle East & Africa MEA Biofertilizers Industry Revenue (undefined), by Import Market Analysis (Value & Volume) 2025 & 2033
- Figure 43: Middle East & Africa MEA Biofertilizers Industry Revenue Share (%), by Import Market Analysis (Value & Volume) 2025 & 2033
- Figure 44: Middle East & Africa MEA Biofertilizers Industry Revenue (undefined), by Export Market Analysis (Value & Volume) 2025 & 2033
- Figure 45: Middle East & Africa MEA Biofertilizers Industry Revenue Share (%), by Export Market Analysis (Value & Volume) 2025 & 2033
- Figure 46: Middle East & Africa MEA Biofertilizers Industry Revenue (undefined), by Price Trend Analysis 2025 & 2033
- Figure 47: Middle East & Africa MEA Biofertilizers Industry Revenue Share (%), by Price Trend Analysis 2025 & 2033
- Figure 48: Middle East & Africa MEA Biofertilizers Industry Revenue (undefined), by Country 2025 & 2033
- Figure 49: Middle East & Africa MEA Biofertilizers Industry Revenue Share (%), by Country 2025 & 2033
- Figure 50: Asia Pacific MEA Biofertilizers Industry Revenue (undefined), by Production Analysis 2025 & 2033
- Figure 51: Asia Pacific MEA Biofertilizers Industry Revenue Share (%), by Production Analysis 2025 & 2033
- Figure 52: Asia Pacific MEA Biofertilizers Industry Revenue (undefined), by Consumption Analysis 2025 & 2033
- Figure 53: Asia Pacific MEA Biofertilizers Industry Revenue Share (%), by Consumption Analysis 2025 & 2033
- Figure 54: Asia Pacific MEA Biofertilizers Industry Revenue (undefined), by Import Market Analysis (Value & Volume) 2025 & 2033
- Figure 55: Asia Pacific MEA Biofertilizers Industry Revenue Share (%), by Import Market Analysis (Value & Volume) 2025 & 2033
- Figure 56: Asia Pacific MEA Biofertilizers Industry Revenue (undefined), by Export Market Analysis (Value & Volume) 2025 & 2033
- Figure 57: Asia Pacific MEA Biofertilizers Industry Revenue Share (%), by Export Market Analysis (Value & Volume) 2025 & 2033
- Figure 58: Asia Pacific MEA Biofertilizers Industry Revenue (undefined), by Price Trend Analysis 2025 & 2033
- Figure 59: Asia Pacific MEA Biofertilizers Industry Revenue Share (%), by Price Trend Analysis 2025 & 2033
- Figure 60: Asia Pacific MEA Biofertilizers Industry Revenue (undefined), by Country 2025 & 2033
- Figure 61: Asia Pacific MEA Biofertilizers Industry Revenue Share (%), by Country 2025 & 2033
List of Tables
- Table 1: Global MEA Biofertilizers Industry Revenue undefined Forecast, by Production Analysis 2020 & 2033
- Table 2: Global MEA Biofertilizers Industry Revenue undefined Forecast, by Consumption Analysis 2020 & 2033
- Table 3: Global MEA Biofertilizers Industry Revenue undefined Forecast, by Import Market Analysis (Value & Volume) 2020 & 2033
- Table 4: Global MEA Biofertilizers Industry Revenue undefined Forecast, by Export Market Analysis (Value & Volume) 2020 & 2033
- Table 5: Global MEA Biofertilizers Industry Revenue undefined Forecast, by Price Trend Analysis 2020 & 2033
- Table 6: Global MEA Biofertilizers Industry Revenue undefined Forecast, by Region 2020 & 2033
- Table 7: Global MEA Biofertilizers Industry Revenue undefined Forecast, by Production Analysis 2020 & 2033
- Table 8: Global MEA Biofertilizers Industry Revenue undefined Forecast, by Consumption Analysis 2020 & 2033
- Table 9: Global MEA Biofertilizers Industry Revenue undefined Forecast, by Import Market Analysis (Value & Volume) 2020 & 2033
- Table 10: Global MEA Biofertilizers Industry Revenue undefined Forecast, by Export Market Analysis (Value & Volume) 2020 & 2033
- Table 11: Global MEA Biofertilizers Industry Revenue undefined Forecast, by Price Trend Analysis 2020 & 2033
- Table 12: Global MEA Biofertilizers Industry Revenue undefined Forecast, by Country 2020 & 2033
- Table 13: United States MEA Biofertilizers Industry Revenue (undefined) Forecast, by Application 2020 & 2033
- Table 14: Canada MEA Biofertilizers Industry Revenue (undefined) Forecast, by Application 2020 & 2033
- Table 15: Mexico MEA Biofertilizers Industry Revenue (undefined) Forecast, by Application 2020 & 2033
- Table 16: Global MEA Biofertilizers Industry Revenue undefined Forecast, by Production Analysis 2020 & 2033
- Table 17: Global MEA Biofertilizers Industry Revenue undefined Forecast, by Consumption Analysis 2020 & 2033
- Table 18: Global MEA Biofertilizers Industry Revenue undefined Forecast, by Import Market Analysis (Value & Volume) 2020 & 2033
- Table 19: Global MEA Biofertilizers Industry Revenue undefined Forecast, by Export Market Analysis (Value & Volume) 2020 & 2033
- Table 20: Global MEA Biofertilizers Industry Revenue undefined Forecast, by Price Trend Analysis 2020 & 2033
- Table 21: Global MEA Biofertilizers Industry Revenue undefined Forecast, by Country 2020 & 2033
- Table 22: Brazil MEA Biofertilizers Industry Revenue (undefined) Forecast, by Application 2020 & 2033
- Table 23: Argentina MEA Biofertilizers Industry Revenue (undefined) Forecast, by Application 2020 & 2033
- Table 24: Rest of South America MEA Biofertilizers Industry Revenue (undefined) Forecast, by Application 2020 & 2033
- Table 25: Global MEA Biofertilizers Industry Revenue undefined Forecast, by Production Analysis 2020 & 2033
- Table 26: Global MEA Biofertilizers Industry Revenue undefined Forecast, by Consumption Analysis 2020 & 2033
- Table 27: Global MEA Biofertilizers Industry Revenue undefined Forecast, by Import Market Analysis (Value & Volume) 2020 & 2033
- Table 28: Global MEA Biofertilizers Industry Revenue undefined Forecast, by Export Market Analysis (Value & Volume) 2020 & 2033
- Table 29: Global MEA Biofertilizers Industry Revenue undefined Forecast, by Price Trend Analysis 2020 & 2033
- Table 30: Global MEA Biofertilizers Industry Revenue undefined Forecast, by Country 2020 & 2033
- Table 31: United Kingdom MEA Biofertilizers Industry Revenue (undefined) Forecast, by Application 2020 & 2033
- Table 32: Germany MEA Biofertilizers Industry Revenue (undefined) Forecast, by Application 2020 & 2033
- Table 33: France MEA Biofertilizers Industry Revenue (undefined) Forecast, by Application 2020 & 2033
- Table 34: Italy MEA Biofertilizers Industry Revenue (undefined) Forecast, by Application 2020 & 2033
- Table 35: Spain MEA Biofertilizers Industry Revenue (undefined) Forecast, by Application 2020 & 2033
- Table 36: Russia MEA Biofertilizers Industry Revenue (undefined) Forecast, by Application 2020 & 2033
- Table 37: Benelux MEA Biofertilizers Industry Revenue (undefined) Forecast, by Application 2020 & 2033
- Table 38: Nordics MEA Biofertilizers Industry Revenue (undefined) Forecast, by Application 2020 & 2033
- Table 39: Rest of Europe MEA Biofertilizers Industry Revenue (undefined) Forecast, by Application 2020 & 2033
- Table 40: Global MEA Biofertilizers Industry Revenue undefined Forecast, by Production Analysis 2020 & 2033
- Table 41: Global MEA Biofertilizers Industry Revenue undefined Forecast, by Consumption Analysis 2020 & 2033
- Table 42: Global MEA Biofertilizers Industry Revenue undefined Forecast, by Import Market Analysis (Value & Volume) 2020 & 2033
- Table 43: Global MEA Biofertilizers Industry Revenue undefined Forecast, by Export Market Analysis (Value & Volume) 2020 & 2033
- Table 44: Global MEA Biofertilizers Industry Revenue undefined Forecast, by Price Trend Analysis 2020 & 2033
- Table 45: Global MEA Biofertilizers Industry Revenue undefined Forecast, by Country 2020 & 2033
- Table 46: Turkey MEA Biofertilizers Industry Revenue (undefined) Forecast, by Application 2020 & 2033
- Table 47: Israel MEA Biofertilizers Industry Revenue (undefined) Forecast, by Application 2020 & 2033
- Table 48: GCC MEA Biofertilizers Industry Revenue (undefined) Forecast, by Application 2020 & 2033
- Table 49: North Africa MEA Biofertilizers Industry Revenue (undefined) Forecast, by Application 2020 & 2033
- Table 50: South Africa MEA Biofertilizers Industry Revenue (undefined) Forecast, by Application 2020 & 2033
- Table 51: Rest of Middle East & Africa MEA Biofertilizers Industry Revenue (undefined) Forecast, by Application 2020 & 2033
- Table 52: Global MEA Biofertilizers Industry Revenue undefined Forecast, by Production Analysis 2020 & 2033
- Table 53: Global MEA Biofertilizers Industry Revenue undefined Forecast, by Consumption Analysis 2020 & 2033
- Table 54: Global MEA Biofertilizers Industry Revenue undefined Forecast, by Import Market Analysis (Value & Volume) 2020 & 2033
- Table 55: Global MEA Biofertilizers Industry Revenue undefined Forecast, by Export Market Analysis (Value & Volume) 2020 & 2033
- Table 56: Global MEA Biofertilizers Industry Revenue undefined Forecast, by Price Trend Analysis 2020 & 2033
- Table 57: Global MEA Biofertilizers Industry Revenue undefined Forecast, by Country 2020 & 2033
- Table 58: China MEA Biofertilizers Industry Revenue (undefined) Forecast, by Application 2020 & 2033
- Table 59: India MEA Biofertilizers Industry Revenue (undefined) Forecast, by Application 2020 & 2033
- Table 60: Japan MEA Biofertilizers Industry Revenue (undefined) Forecast, by Application 2020 & 2033
- Table 61: South Korea MEA Biofertilizers Industry Revenue (undefined) Forecast, by Application 2020 & 2033
- Table 62: ASEAN MEA Biofertilizers Industry Revenue (undefined) Forecast, by Application 2020 & 2033
- Table 63: Oceania MEA Biofertilizers Industry Revenue (undefined) Forecast, by Application 2020 & 2033
- Table 64: Rest of Asia Pacific MEA Biofertilizers Industry Revenue (undefined) Forecast, by Application 2020 & 2033
Frequently Asked Questions
1. What is the projected Compound Annual Growth Rate (CAGR) of the MEA Biofertilizers Industry?
The projected CAGR is approximately 11.1%.
2. Which companies are prominent players in the MEA Biofertilizers Industry?
Key companies in the market include Mapelton Agri Biotec PTY ltd, Symborg*List Not Exhaustive, Microbial Biological Fertilizers International (MBFI), Rizobacter Argentina SA, International panaacea ltd, Agrilife.
3. What are the main segments of the MEA Biofertilizers Industry?
The market segments include Production Analysis, Consumption Analysis, Import Market Analysis (Value & Volume), Export Market Analysis (Value & Volume), Price Trend Analysis.
4. Can you provide details about the market size?
The market size is estimated to be USD XXX N/A as of 2022.
5. What are some drivers contributing to market growth?
Seed Treatment As A Solution To Enhance Yield; Growing Awareness For Seed Treatment Among The Farmers; Rising Trend Of Organic Farming.
6. What are the notable trends driving market growth?
Increased Food Demand and Need for Sustainable Agricultural Development.
7. Are there any restraints impacting market growth?
Limitations Across Farm-Level Seed Treatment; Rising Environmental Concerns.
8. Can you provide examples of recent developments in the market?
N/A
9. What pricing options are available for accessing the report?
Pricing options include single-user, multi-user, and enterprise licenses priced at USD 4750, USD 5250, and USD 8750 respectively.
10. Is the market size provided in terms of value or volume?
The market size is provided in terms of value, measured in N/A.
11. Are there any specific market keywords associated with the report?
Yes, the market keyword associated with the report is "MEA Biofertilizers Industry," which aids in identifying and referencing the specific market segment covered.
12. How do I determine which pricing option suits my needs best?
The pricing options vary based on user requirements and access needs. Individual users may opt for single-user licenses, while businesses requiring broader access may choose multi-user or enterprise licenses for cost-effective access to the report.
13. Are there any additional resources or data provided in the MEA Biofertilizers Industry report?
While the report offers comprehensive insights, it's advisable to review the specific contents or supplementary materials provided to ascertain if additional resources or data are available.
14. How can I stay updated on further developments or reports in the MEA Biofertilizers Industry?
To stay informed about further developments, trends, and reports in the MEA Biofertilizers Industry, consider subscribing to industry newsletters, following relevant companies and organizations, or regularly checking reputable industry news sources and publications.
Methodology
Step 1 - Identification of Relevant Samples Size from Population Database


Step 2 - Approaches for Defining Global Market Size (Value, Volume* & Price*)

Note*: In applicable scenarios
Step 3 - Data Sources
Primary Research
- Web Analytics
- Survey Reports
- Research Institute
- Latest Research Reports
- Opinion Leaders
Secondary Research
- Annual Reports
- White Paper
- Latest Press Release
- Industry Association
- Paid Database
- Investor Presentations

Step 4 - Data Triangulation
Involves using different sources of information in order to increase the validity of a study
These sources are likely to be stakeholders in a program - participants, other researchers, program staff, other community members, and so on.
Then we put all data in single framework & apply various statistical tools to find out the dynamic on the market.
During the analysis stage, feedback from the stakeholder groups would be compared to determine areas of agreement as well as areas of divergence