

Key Insights
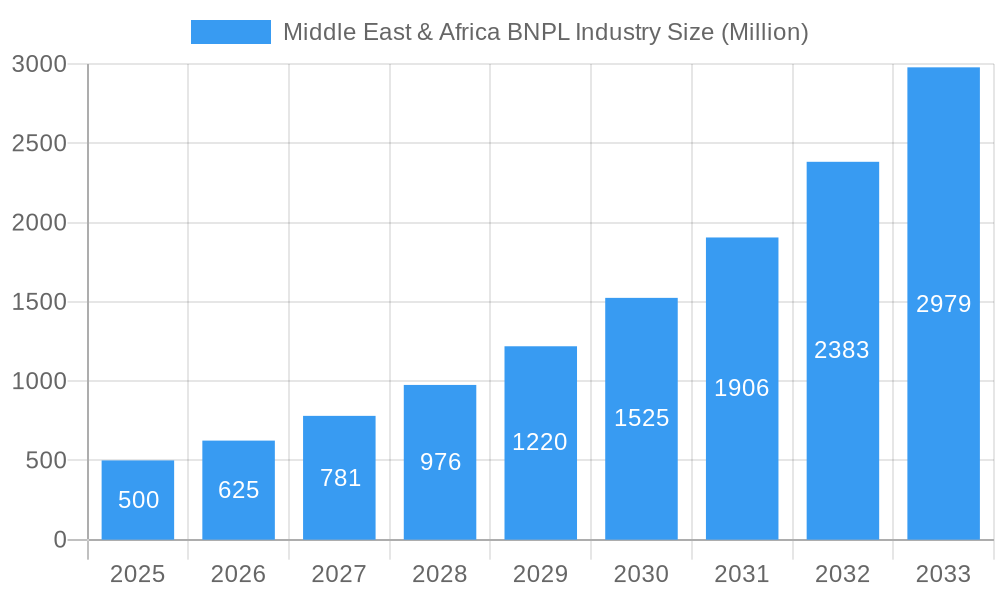
The Middle East & Africa Buy Now, Pay Later (BNPL) market is poised for significant expansion. The market size was valued at 44858.18 million in the base year 2025, with a projected Compound Annual Growth Rate (CAGR) of 20.7% from 2025 to 2033. This growth is fueled by escalating consumer demand for flexible payment solutions and the burgeoning e-commerce sector across the region. Key catalysts include the widespread adoption of digital payment technologies and the market entry of global BNPL providers, enhancing consumer access to deferred payment options. A youthful, digitally adept demographic prioritizing convenience and financial agility further supports this industry's ascent. Prominent companies like Payflex, Tamara, and Tabby are pioneering innovative BNPL solutions adapted for local market needs.

Middle East & Africa BNPL Industry Market Size (In Billion)
While the growth outlook is positive, the Middle East & Africa BNPL sector encounters challenges such as evolving regulatory frameworks and the necessity for consumer financial literacy regarding responsible credit utilization. Emerging trends, including the seamless integration of BNPL into mobile wallets and strategic collaborations with leading retailers, are redefining the market dynamics. Segments like fashion, electronics, and travel are witnessing increased BNPL adoption. The competitive environment is robust, featuring both domestic and international entities striving for market leadership through strategic partnerships and technological innovation. The forecast period of 2025-2033 indicates sustained growth, driven by the region's economic progress and ongoing digital transformation initiatives.
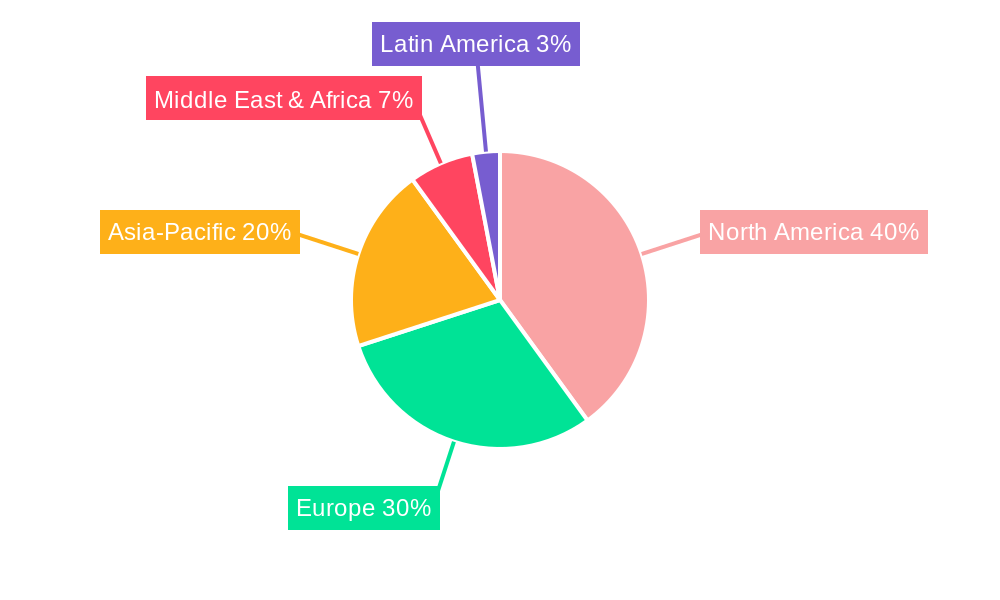
Middle East & Africa BNPL Industry Company Market Share
Middle East & Africa BNPL Industry Market Report: 2019-2033
This comprehensive report delivers an in-depth analysis of the burgeoning Buy Now, Pay Later (BNPL) industry in the Middle East and Africa, providing invaluable insights for investors, industry professionals, and strategic planners. With a focus on market dynamics, growth trends, and key players, this report offers a 360-degree view of this rapidly evolving sector. The study period spans 2019-2033, with 2025 serving as the base and estimated year.
Study Period: 2019–2033 Base Year: 2025 Estimated Year: 2025 Forecast Period: 2025–2033 Historical Period: 2019–2024
Middle East & Africa BNPL Industry Market Dynamics & Structure
The Middle East and Africa (MEA) Buy Now, Pay Later (BNPL) industry is experiencing rapid expansion, driven by a confluence of factors analyzed in this section. We delve into the competitive landscape, technological advancements, regulatory environment, and market segmentation to provide a comprehensive understanding of the MEA BNPL market's dynamics and structure. Our analysis includes a detailed examination of market concentration, identifying key players and their respective market shares, and pinpointing any dominant firms. We explore the influence of technological innovation, including mobile payment technologies, AI-driven risk assessment, and open banking integrations, on market growth and competitive advantage. Furthermore, we assess the impact of the regulatory landscape, considering licensing requirements, consumer protection regulations, and their variations across different MEA countries. The analysis also considers the presence and impact of competitive substitutes, such as credit cards and traditional installment plans, on BNPL adoption rates. A crucial aspect of our study is the examination of end-user demographics, including age, income, location, and purchasing behavior, to understand the factors influencing BNPL adoption across different consumer segments. We also provide a comprehensive overview of recent mergers and acquisitions (M&A) activity, including deal volumes and their implications for market consolidation. Our analysis combines quantitative data, such as market share percentages and M&A deal volumes (in millions of USD), with qualitative factors to provide a holistic view of market growth. We project the total market size for the MEA BNPL market to be XX million in 2025, with an expected expansion to XX million by 2033.
- Market Concentration: A detailed analysis of market share distribution amongst key players, including the market share held by the top 3 players and an assessment of the level of market concentration (e.g., highly concentrated, moderately concentrated, fragmented).
- Technological Innovation: A comprehensive assessment of the impact of mobile payment technologies, AI-driven risk assessment, open banking integrations, and other emerging technologies on the BNPL market, including their effects on efficiency, risk management, and customer experience.
- Regulatory Landscape: A thorough review of existing and upcoming regulations impacting BNPL operations across different MEA countries, including a comparative analysis of regulatory frameworks and their potential impact on market growth.
- Competitive Substitutes: A comparative analysis of BNPL services with alternative payment methods, highlighting the strengths and weaknesses of each option and identifying factors influencing consumer choice.
- End-User Demographics: A detailed profiling of the typical BNPL user in the MEA region, including age, income level, location, purchasing behavior, and other relevant demographic factors, with a focus on identifying key consumer segments and their adoption patterns.
- M&A Activity: A comprehensive review of recent mergers, acquisitions, and investment rounds in the MEA BNPL sector, including deal values, participating companies, and strategic implications for the market.
Middle East & Africa BNPL Industry Growth Trends & Insights
This section provides a detailed analysis of the MEA BNPL market's growth trajectory, leveraging both quantitative and qualitative data. We explore market size evolution from 2019 to 2024 and project future growth through 2033. The analysis incorporates key metrics such as Compound Annual Growth Rate (CAGR), market penetration rates, and adoption trends across different segments and countries. Furthermore, we investigate the influence of technological disruptions, changing consumer behaviors (e.g., increasing preference for digital payments, demand for flexible payment options), and economic factors on market expansion. The report will also analyze the impact of specific events, like the COVID-19 pandemic, on BNPL adoption.
Dominant Regions, Countries, or Segments in Middle East & Africa BNPL Industry
This section identifies the leading regions, countries, and segments driving the growth of the MEA BNPL industry. A detailed analysis will pinpoint the key factors contributing to the dominance of specific markets. This may include favorable economic policies promoting fintech adoption, robust digital infrastructure facilitating seamless transactions, high smartphone penetration rates, and a young, tech-savvy population. The report also assesses the growth potential of lesser-developed regions and segments within the MEA BNPL market. For instance, the analysis might reveal that X country has the highest market share due to factors such as Y and Z while region A is expected to experience faster growth due to W.
- Key Drivers: Detailed breakdown of factors driving market growth in dominant regions/countries/segments (e.g., favorable regulatory environment, high internet penetration, rising disposable incomes).
- Dominance Factors: Analysis of market share, growth rates, and contributing factors for leading regions and segments.
- Growth Potential: Assessment of future growth prospects for different regions, countries, and segments.
Middle East & Africa BNPL Industry Product Landscape
This section provides a concise overview of the existing BNPL products in the MEA region, highlighting product innovation, applications, and key performance indicators (KPIs). We will analyze the unique selling propositions (USPs) of different BNPL platforms and discuss technological advancements driving product improvement, such as advanced risk assessment models, personalized payment plans, and seamless integration with e-commerce platforms.
Key Drivers, Barriers & Challenges in Middle East & Africa BNPL Industry
This section identifies the key factors driving the growth of the MEA BNPL market and explores significant challenges hindering its expansion.
Key Drivers:
- Increased smartphone penetration and internet access
- Growing e-commerce adoption
- Rising consumer demand for flexible payment options
- Supportive regulatory frameworks (in some regions)
- Strategic partnerships between BNPL providers and merchants
Challenges and Restraints:
- Regulatory uncertainty and inconsistent regulatory frameworks across different countries
- Concerns regarding consumer debt and financial inclusion
- High operational costs and fraud risks
- Competition from established payment methods (e.g., credit cards)
- Limited financial literacy among consumers in some regions.
Emerging Opportunities in Middle East & Africa BNPL Industry
This section explores potential growth areas and untapped markets within the MEA BNPL industry. These could include: expansion into underserved populations, development of niche BNPL products targeting specific consumer segments, strategic partnerships to broaden merchant acceptance, and technological innovation to improve security and customer experience. Opportunities in underbanked populations and integration with loyalty programs are also discussed.
Growth Accelerators in the Middle East & Africa BNPL Industry Industry
Long-term growth in the MEA BNPL market is expected to be driven by continued technological advancements, expansion into new markets, and strategic partnerships. The increasing adoption of mobile payments, the development of more sophisticated risk assessment tools, and the growing integration of BNPL services with e-commerce platforms are key growth catalysts. Furthermore, strategic collaborations between BNPL providers and traditional financial institutions could significantly boost market expansion.
Key Players Shaping the Middle East & Africa BNPL Industry Market
- Payflex
- Tamara
- Spotti
- Tabby
- Postpay
- Shahry
- Lipa Later
- Sympl
- Chari
- ThankUCash
- List Not Exhaustive
Notable Milestones in Middle East & Africa BNPL Industry Sector
- January 2022: Lipa Later secures USD 12 million in pre-series A funding to expand across Africa.
- February 2022: Postpay strikes a debt financing agreement with the Commercial Bank of Dubai for product expansion.
In-Depth Middle East & Africa BNPL Industry Market Outlook
The MEA BNPL market shows immense potential for future growth, driven by increasing digital adoption, favorable demographic trends, and ongoing technological innovation. Strategic partnerships and expansion into untapped markets will play a critical role in shaping the industry's future. The market is poised to witness significant expansion, offering considerable opportunities for both established players and new entrants.
Middle East & Africa BNPL Industry Segmentation
-
1. Channel
- 1.1. Online
- 1.2. POS
-
2. Enterprises Size
- 2.1. Large Enterprises
- 2.2. Small & Medium Enterprises
-
3. End User
- 3.1. Consumer Electronics
- 3.2. Fashion & Garments
- 3.3. Healthcare
- 3.4. Leisure & Entertainment
- 3.5. Retail
- 3.6. Others
Middle East & Africa BNPL Industry Segmentation By Geography
-
1. Middle East
- 1.1. Saudi Arabia
- 1.2. United Arab Emirates
- 1.3. Israel
- 1.4. Qatar
- 1.5. Kuwait
- 1.6. Oman
- 1.7. Bahrain
- 1.8. Jordan
- 1.9. Lebanon
Middle East & Africa BNPL Industry Regional Market Share
Geographic Coverage of Middle East & Africa BNPL Industry
Middle East & Africa BNPL Industry REPORT HIGHLIGHTS
| Aspects | Details |
|---|---|
| Study Period | 2020-2034 |
| Base Year | 2025 |
| Estimated Year | 2026 |
| Forecast Period | 2026-2034 |
| Historical Period | 2020-2025 |
| Growth Rate | CAGR of 20.7% from 2020-2034 |
| Segmentation |
|
Table of Contents
- 1. Introduction
- 1.1. Research Scope
- 1.2. Market Segmentation
- 1.3. Research Objective
- 1.4. Definitions and Assumptions
- 2. Executive Summary
- 2.1. Market Snapshot
- 3. Market Dynamics
- 3.1. Market Drivers
- 3.2. Market Restrains
- 3.3. Market Trends
- 3.4. Market Opportunities
- 4. Market Factor Analysis
- 4.1. Porters Five Forces
- 4.1.1. Bargaining Power of Suppliers
- 4.1.2. Bargaining Power of Buyers
- 4.1.3. Threat of New Entrants
- 4.1.4. Threat of Substitutes
- 4.1.5. Competitive Rivalry
- 4.2. PESTEL analysis
- 4.3. BCG Analysis
- 4.3.1. Stars (High Growth, High Market Share)
- 4.3.2. Cash Cows (Low Growth, High Market Share)
- 4.3.3. Question Mark (High Growth, Low Market Share)
- 4.3.4. Dogs (Low Growth, Low Market Share)
- 4.4. Ansoff Matrix Analysis
- 4.5. Supply Chain Analysis
- 4.6. Regulatory Landscape
- 4.7. Current Market Potential and Opportunity Assessment (TAM–SAM–SOM Framework)
- 4.8. NRP Analyst Note
- 4.1. Porters Five Forces
- 5. Market Analysis, Insights and Forecast 2021-2033
- 5.1. Market Analysis, Insights and Forecast - by Channel
- 5.1.1. Online
- 5.1.2. POS
- 5.2. Market Analysis, Insights and Forecast - by Enterprises Size
- 5.2.1. Large Enterprises
- 5.2.2. Small & Medium Enterprises
- 5.3. Market Analysis, Insights and Forecast - by End User
- 5.3.1. Consumer Electronics
- 5.3.2. Fashion & Garments
- 5.3.3. Healthcare
- 5.3.4. Leisure & Entertainment
- 5.3.5. Retail
- 5.3.6. Others
- 5.4. Market Analysis, Insights and Forecast - by Region
- 5.4.1. Middle East
- 5.1. Market Analysis, Insights and Forecast - by Channel
- 6. Middle East & Africa BNPL Industry Analysis, Insights and Forecast, 2021-2033
- 6.1. Market Analysis, Insights and Forecast - by Channel
- 6.1.1. Online
- 6.1.2. POS
- 6.2. Market Analysis, Insights and Forecast - by Enterprises Size
- 6.2.1. Large Enterprises
- 6.2.2. Small & Medium Enterprises
- 6.3. Market Analysis, Insights and Forecast - by End User
- 6.3.1. Consumer Electronics
- 6.3.2. Fashion & Garments
- 6.3.3. Healthcare
- 6.3.4. Leisure & Entertainment
- 6.3.5. Retail
- 6.3.6. Others
- 6.1. Market Analysis, Insights and Forecast - by Channel
- 7. Competitive Analysis
- 7.1. Company Profiles
- 7.1.1 Payflex
- 7.1.1.1. Company Overview
- 7.1.1.2. Products
- 7.1.1.3. Company Financials
- 7.1.1.4. SWOT Analysis
- 7.1.2 Tamara
- 7.1.2.1. Company Overview
- 7.1.2.2. Products
- 7.1.2.3. Company Financials
- 7.1.2.4. SWOT Analysis
- 7.1.3 Spotti
- 7.1.3.1. Company Overview
- 7.1.3.2. Products
- 7.1.3.3. Company Financials
- 7.1.3.4. SWOT Analysis
- 7.1.4 Tabby
- 7.1.4.1. Company Overview
- 7.1.4.2. Products
- 7.1.4.3. Company Financials
- 7.1.4.4. SWOT Analysis
- 7.1.5 Postpay
- 7.1.5.1. Company Overview
- 7.1.5.2. Products
- 7.1.5.3. Company Financials
- 7.1.5.4. SWOT Analysis
- 7.1.6 Shahry
- 7.1.6.1. Company Overview
- 7.1.6.2. Products
- 7.1.6.3. Company Financials
- 7.1.6.4. SWOT Analysis
- 7.1.7 Lipa Later
- 7.1.7.1. Company Overview
- 7.1.7.2. Products
- 7.1.7.3. Company Financials
- 7.1.7.4. SWOT Analysis
- 7.1.8 Sympl
- 7.1.8.1. Company Overview
- 7.1.8.2. Products
- 7.1.8.3. Company Financials
- 7.1.8.4. SWOT Analysis
- 7.1.9 Chari
- 7.1.9.1. Company Overview
- 7.1.9.2. Products
- 7.1.9.3. Company Financials
- 7.1.9.4. SWOT Analysis
- 7.1.10 ThankUCash*List Not Exhaustive
- 7.1.10.1. Company Overview
- 7.1.10.2. Products
- 7.1.10.3. Company Financials
- 7.1.10.4. SWOT Analysis
- 7.1.1 Payflex
- 7.2. Market Entropy
- 7.2.1 Company's Key Areas Served
- 7.2.2 Recent Developments
- 7.3. Company Market Share Analysis 2025
- 7.3.1 Top 5 Companies Market Share Analysis
- 7.3.2 Top 3 Companies Market Share Analysis
- 7.4. List of Potential Customers
- 8. Research Methodology
List of Figures
- Figure 1: Middle East & Africa BNPL Industry Revenue Breakdown (million, %) by Product 2025 & 2033
- Figure 2: Middle East & Africa BNPL Industry Share (%) by Company 2025
List of Tables
- Table 1: Middle East & Africa BNPL Industry Revenue million Forecast, by Channel 2020 & 2033
- Table 2: Middle East & Africa BNPL Industry Revenue million Forecast, by Enterprises Size 2020 & 2033
- Table 3: Middle East & Africa BNPL Industry Revenue million Forecast, by End User 2020 & 2033
- Table 4: Middle East & Africa BNPL Industry Revenue million Forecast, by Region 2020 & 2033
- Table 5: Middle East & Africa BNPL Industry Revenue million Forecast, by Channel 2020 & 2033
- Table 6: Middle East & Africa BNPL Industry Revenue million Forecast, by Enterprises Size 2020 & 2033
- Table 7: Middle East & Africa BNPL Industry Revenue million Forecast, by End User 2020 & 2033
- Table 8: Middle East & Africa BNPL Industry Revenue million Forecast, by Country 2020 & 2033
- Table 9: Saudi Arabia Middle East & Africa BNPL Industry Revenue (million) Forecast, by Application 2020 & 2033
- Table 10: United Arab Emirates Middle East & Africa BNPL Industry Revenue (million) Forecast, by Application 2020 & 2033
- Table 11: Israel Middle East & Africa BNPL Industry Revenue (million) Forecast, by Application 2020 & 2033
- Table 12: Qatar Middle East & Africa BNPL Industry Revenue (million) Forecast, by Application 2020 & 2033
- Table 13: Kuwait Middle East & Africa BNPL Industry Revenue (million) Forecast, by Application 2020 & 2033
- Table 14: Oman Middle East & Africa BNPL Industry Revenue (million) Forecast, by Application 2020 & 2033
- Table 15: Bahrain Middle East & Africa BNPL Industry Revenue (million) Forecast, by Application 2020 & 2033
- Table 16: Jordan Middle East & Africa BNPL Industry Revenue (million) Forecast, by Application 2020 & 2033
- Table 17: Lebanon Middle East & Africa BNPL Industry Revenue (million) Forecast, by Application 2020 & 2033
Frequently Asked Questions
1. What is the projected Compound Annual Growth Rate (CAGR) of the Middle East & Africa BNPL Industry?
The projected CAGR is approximately 20.7%.
2. Which companies are prominent players in the Middle East & Africa BNPL Industry?
Key companies in the market include Payflex, Tamara, Spotti, Tabby, Postpay, Shahry, Lipa Later, Sympl, Chari, ThankUCash*List Not Exhaustive.
3. What are the main segments of the Middle East & Africa BNPL Industry?
The market segments include Channel, Enterprises Size, End User.
4. Can you provide details about the market size?
The market size is estimated to be USD 44858.18 million as of 2022.
5. What are some drivers contributing to market growth?
N/A
6. What are the notable trends driving market growth?
Growth in E-commerce in Middle East and Africa is increasing.
7. Are there any restraints impacting market growth?
N/A
8. Can you provide examples of recent developments in the market?
January 2022 - Lipa Later, a Kenyan BNPL startup, has secured USD 12 million in pre-series A funding to grow across Africa. This new capital, according to the firm, would allow them to supply their buy-now-pay-later services to their current pipeline of users, strengthen their presence in current markets (Kenya, Uganda, and Rwanda), and expand into new markets such as Nigeria, South Africa, Ghana, and Tanzania.
9. What pricing options are available for accessing the report?
Pricing options include single-user, multi-user, and enterprise licenses priced at USD 3800, USD 4500, and USD 5800 respectively.
10. Is the market size provided in terms of value or volume?
The market size is provided in terms of value, measured in million.
11. Are there any specific market keywords associated with the report?
Yes, the market keyword associated with the report is "Middle East & Africa BNPL Industry," which aids in identifying and referencing the specific market segment covered.
12. How do I determine which pricing option suits my needs best?
The pricing options vary based on user requirements and access needs. Individual users may opt for single-user licenses, while businesses requiring broader access may choose multi-user or enterprise licenses for cost-effective access to the report.
13. Are there any additional resources or data provided in the Middle East & Africa BNPL Industry report?
While the report offers comprehensive insights, it's advisable to review the specific contents or supplementary materials provided to ascertain if additional resources or data are available.
14. How can I stay updated on further developments or reports in the Middle East & Africa BNPL Industry?
To stay informed about further developments, trends, and reports in the Middle East & Africa BNPL Industry, consider subscribing to industry newsletters, following relevant companies and organizations, or regularly checking reputable industry news sources and publications.
Methodology
Step 1 - Identification of Relevant Samples Size from Population Database


Step 2 - Approaches for Defining Global Market Size (Value, Volume* & Price*)

Note*: In applicable scenarios
Step 3 - Data Sources
Primary Research
- Web Analytics
- Survey Reports
- Research Institute
- Latest Research Reports
- Opinion Leaders
Secondary Research
- Annual Reports
- White Paper
- Latest Press Release
- Industry Association
- Paid Database
- Investor Presentations

Step 4 - Data Triangulation
Involves using different sources of information in order to increase the validity of a study
These sources are likely to be stakeholders in a program - participants, other researchers, program staff, other community members, and so on.
Then we put all data in single framework & apply various statistical tools to find out the dynamic on the market.
During the analysis stage, feedback from the stakeholder groups would be compared to determine areas of agreement as well as areas of divergence