

Key Insights
The North American crop protection chemicals market, including fungicides, herbicides, and insecticides, is poised for robust expansion. Projected at a Compound Annual Growth Rate (CAGR) of 4.6% from 2024 to 2033, this growth is driven by escalating crop disease and pest pressures, alongside the increasing global demand for food. Supportive government initiatives and advancements in agricultural R&D further bolster market dynamics. Key segments include diverse application methods and crop types. Leading companies are actively innovating, developing biopesticides to address evolving farmer needs and stringent environmental regulations.
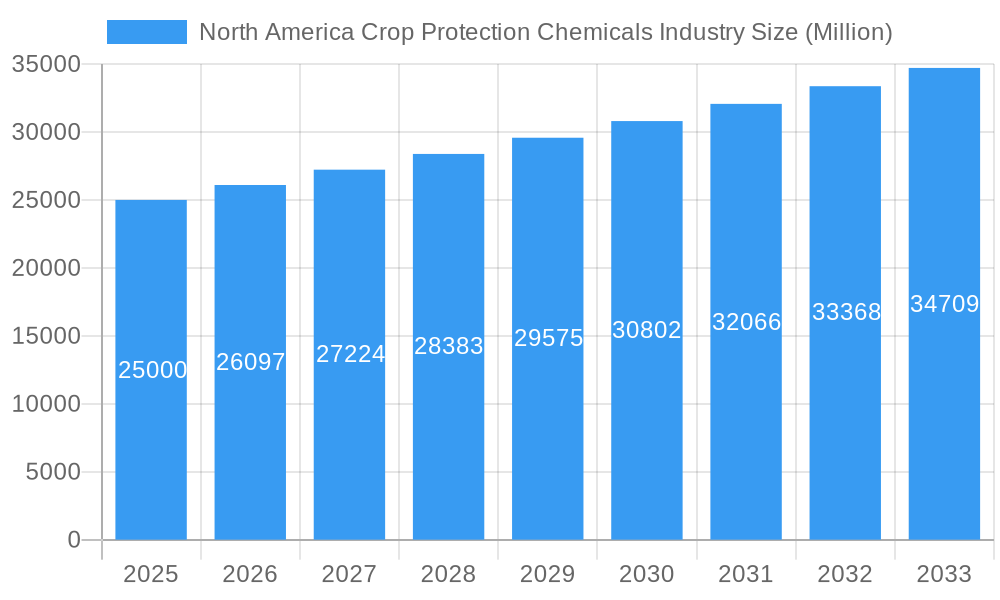
North America Crop Protection Chemicals Industry Market Size (In Billion)
Market growth faces headwinds from complex pesticide regulatory frameworks, commodity price volatility, unpredictable weather, and environmental concerns. Nevertheless, opportunities arise from the adoption of precision agriculture and sustainable practices like integrated pest management (IPM). These trends favor targeted, eco-friendly crop protection solutions. The United States will be the primary growth driver, with Canada and Mexico contributing significantly.
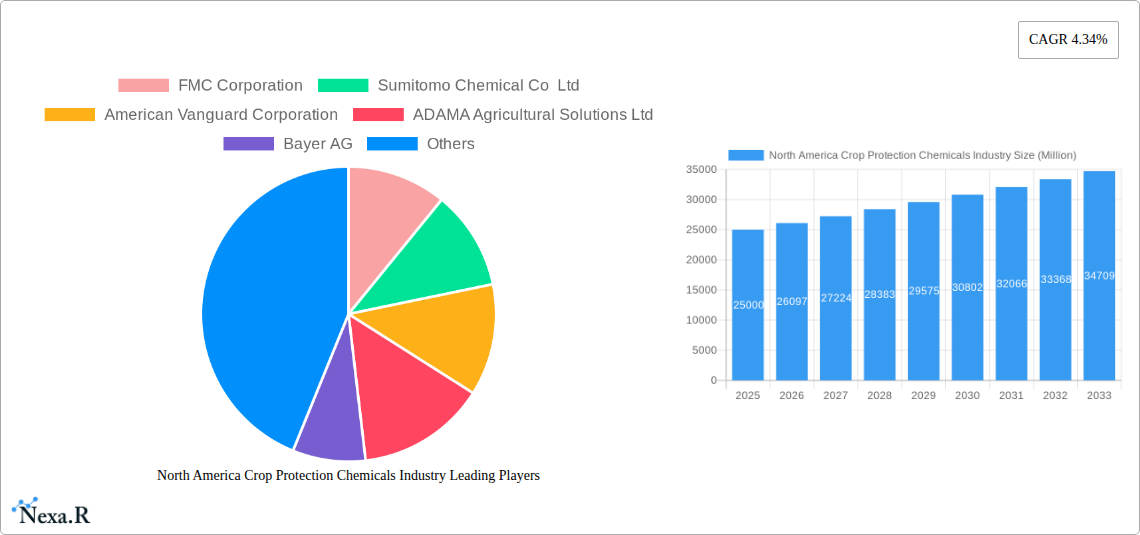
North America Crop Protection Chemicals Industry Company Market Share
North America Crop Protection Chemicals Market Analysis and Forecast (2024-2033)
This comprehensive report analyzes the North American crop protection chemicals industry. It covers market dynamics, growth trajectories, key stakeholders, and future outlook from 2024 to 2033. The market size is estimated at 76.18 billion in the base year 2024. The analysis details segments by function (fungicides, herbicides, insecticides), application mode (foliar, soil treatment, seed treatment), and crop type (fruits & vegetables, grains & cereals). Geographic scope encompasses the United States, Canada, and Mexico.
North America Crop Protection Chemicals Industry Market Dynamics & Structure
The North American crop protection chemicals market is characterized by a moderately concentrated structure, with a handful of multinational corporations holding significant market share. The industry is driven by technological innovation, particularly in the development of more targeted and environmentally friendly solutions. Stringent regulatory frameworks, including those governing pesticide registration and usage, significantly impact market dynamics. The availability of competitive product substitutes and the evolving end-user demographics (including the rise of large-scale commercial farming) also play crucial roles. Mergers and acquisitions (M&A) activity, though not exceptionally high, represents a strategy for key players to expand their product portfolios and geographic reach. In 2024, the M&A activity involved approximately xx deals, resulting in a market share consolidation of xx%.
- Market Concentration: Moderately concentrated, with top 10 players holding approximately xx% of market share in 2024.
- Technological Innovation: Focus on targeted delivery systems, biopesticides, and AI-driven precision agriculture. Innovation barriers include high R&D costs and lengthy regulatory approval processes.
- Regulatory Frameworks: Stringent regulations regarding pesticide registration and usage, varying across different North American jurisdictions.
- Competitive Substitutes: Biological controls, integrated pest management (IPM) strategies, and other sustainable practices pose competitive challenges.
- End-User Demographics: Shift towards larger-scale commercial farming operations, influencing demand for high-efficiency crop protection solutions.
- M&A Trends: Consolidation through acquisitions to expand product portfolios and geographic presence.
North America Crop Protection Chemicals Industry Growth Trends & Insights
The North American crop protection chemicals market experienced a Compound Annual Growth Rate (CAGR) of xx% during the historical period (2019-2024), reaching a market size of xx million units in 2024. This growth is primarily attributed to increasing crop yields, the expansion of cultivated land, and rising demand for food and feed. Technological disruptions, particularly in precision agriculture, are driving adoption rates of newer, more targeted crop protection solutions. Consumer behavior is shifting towards greater awareness of environmental sustainability, which influences demand for eco-friendly products. The forecast period (2025-2033) projects a CAGR of xx%, driven by factors such as growing global population, increased agricultural production, and the ongoing development of innovative crop protection technologies. Market penetration of biopesticides is expected to increase from xx% in 2024 to xx% by 2033.
Dominant Regions, Countries, or Segments in North America Crop Protection Chemicals Industry
The United States dominates the North American crop protection chemicals market, accounting for approximately xx% of the total market value in 2024. This dominance is driven by its large agricultural sector, extensive cultivated land, and advanced agricultural practices. Within the segments, herbicides represent the largest market share, followed by insecticides and fungicides. The foliar application mode holds the most significant share due to its wide applicability across various crops. Grains & Cereals and Fruits & Vegetables are the leading crop types driving market demand.
- Key Drivers: Large agricultural sector in the US, high crop yields, favorable climatic conditions, and government support for agricultural advancements.
- Dominance Factors: Extensive cultivated land area, high adoption of modern agricultural techniques, and a robust distribution network in the United States.
- Growth Potential: High growth potential is expected in the Canadian and Mexican markets driven by increasing investment in agricultural infrastructure and government initiatives to enhance crop productivity.
North America Crop Protection Chemicals Industry Product Landscape
The market offers a wide array of crop protection chemicals, categorized by function (herbicides, insecticides, fungicides, etc.), application mode (foliar, soil treatment, etc.), and target crop. Recent innovations focus on improving efficacy, reducing environmental impact, and enhancing targeted delivery. Biopesticides are gaining traction, driven by the growing demand for sustainable agriculture. Product differentiation is achieved through unique selling propositions like enhanced efficacy, reduced application rates, and improved environmental profiles. Technological advancements include the development of novel active ingredients and innovative formulation technologies.
Key Drivers, Barriers & Challenges in North America Crop Protection Chemicals Industry
Key Drivers:
- Increasing demand for food security due to population growth.
- Growing adoption of modern farming practices.
- Climate change and its impact on crop yields.
- Advancements in precision agriculture technologies.
Challenges and Restraints:
- Stringent regulations and approval processes for new product registrations.
- Concerns regarding the environmental impact of pesticides.
- Development of pest resistance to existing chemicals.
- Fluctuations in raw material prices affecting profitability. The increase in raw material prices by xx% in 2023 impacted profitability by xx%.
Emerging Opportunities in North America Crop Protection Chemicals Industry
- Growing demand for biopesticides and other sustainable solutions.
- Increased adoption of precision agriculture technologies for targeted application.
- Expanding market for crop protection solutions in emerging crops.
- Opportunities in developing innovative formulations for improved efficacy and reduced environmental impact.
Growth Accelerators in the North America Crop Protection Chemicals Industry
Long-term growth will be fueled by continuous technological innovation leading to the development of more effective and environmentally friendly crop protection solutions. Strategic partnerships between chemical companies and agricultural technology providers will accelerate the adoption of precision agriculture techniques. Market expansion into new geographic areas and crop types will create further growth opportunities.
Key Players Shaping the North America Crop Protection Chemicals Market
Notable Milestones in North America Crop Protection Chemicals Industry Sector
- July 2023: ADAMA introduced new products, Davai A Plus and Clearfield Broad-Spectrum Herbicide Solutions, expanding its offerings for imidazolinone-tolerant legumes.
- April 2023: Nufarm launched Tourney EZ, a liquid fungicide for turf and ornamental crops, strengthening its position in this segment.
- March 2023: AMVAC launched new herbicides (Impact Core and Sinate) to combat weed resistance in maize, addressing a key industry challenge.
In-Depth North America Crop Protection Chemicals Industry Market Outlook
The North American crop protection chemicals market is poised for robust growth in the coming years, driven by the factors previously mentioned. Strategic investments in R&D, sustainable product development, and partnerships will shape the industry landscape. Opportunities exist in developing targeted solutions for specific crop needs, leveraging data-driven insights for precise application, and exploring new market segments. The focus on sustainability and environmental stewardship will continue to be a significant driver of innovation and market expansion.
North America Crop Protection Chemicals Industry Segmentation
-
1. Function
- 1.1. Fungicide
- 1.2. Herbicide
- 1.3. Insecticide
- 1.4. Molluscicide
- 1.5. Nematicide
-
2. Application Mode
- 2.1. Chemigation
- 2.2. Foliar
- 2.3. Fumigation
- 2.4. Seed Treatment
- 2.5. Soil Treatment
-
3. Crop Type
- 3.1. Commercial Crops
- 3.2. Fruits & Vegetables
- 3.3. Grains & Cereals
- 3.4. Pulses & Oilseeds
- 3.5. Turf & Ornamental
-
4. Function
- 4.1. Fungicide
- 4.2. Herbicide
- 4.3. Insecticide
- 4.4. Molluscicide
- 4.5. Nematicide
-
5. Application Mode
- 5.1. Chemigation
- 5.2. Foliar
- 5.3. Fumigation
- 5.4. Seed Treatment
- 5.5. Soil Treatment
-
6. Crop Type
- 6.1. Commercial Crops
- 6.2. Fruits & Vegetables
- 6.3. Grains & Cereals
- 6.4. Pulses & Oilseeds
- 6.5. Turf & Ornamental
North America Crop Protection Chemicals Industry Segmentation By Geography
-
1. North America
- 1.1. United States
- 1.2. Canada
- 1.3. Mexico
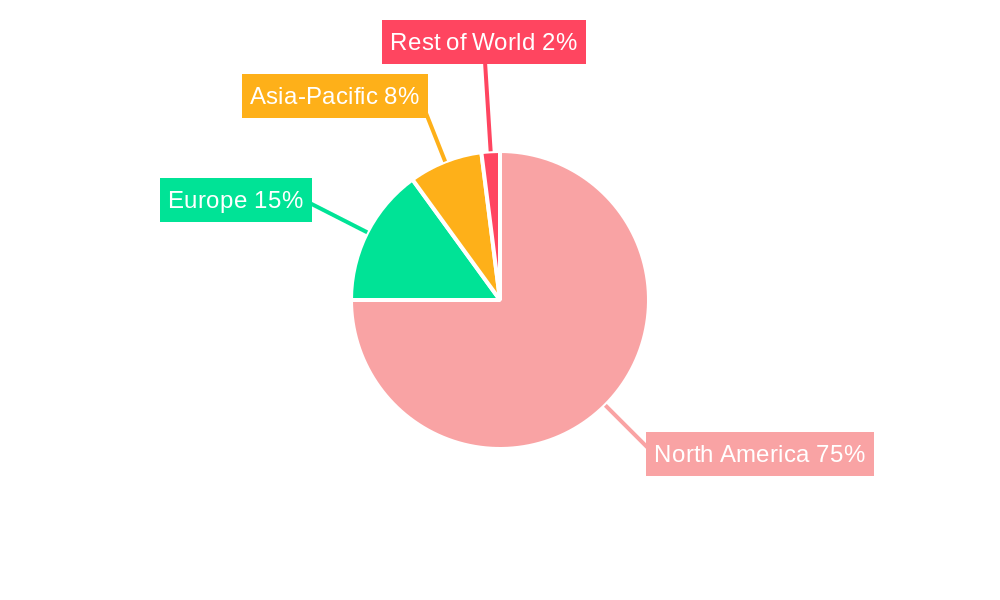
North America Crop Protection Chemicals Industry Regional Market Share
Geographic Coverage of North America Crop Protection Chemicals Industry
North America Crop Protection Chemicals Industry REPORT HIGHLIGHTS
| Aspects | Details |
|---|---|
| Study Period | 2020-2034 |
| Base Year | 2025 |
| Estimated Year | 2026 |
| Forecast Period | 2026-2034 |
| Historical Period | 2020-2025 |
| Growth Rate | CAGR of 4.6% from 2020-2034 |
| Segmentation |
|
Table of Contents
- 1. Introduction
- 1.1. Research Scope
- 1.2. Market Segmentation
- 1.3. Research Objective
- 1.4. Definitions and Assumptions
- 2. Executive Summary
- 2.1. Market Snapshot
- 3. Market Dynamics
- 3.1. Market Drivers
- 3.2. Market Restrains
- 3.3. Market Trends
- 3.4. Market Opportunities
- 4. Market Factor Analysis
- 4.1. Porters Five Forces
- 4.1.1. Bargaining Power of Suppliers
- 4.1.2. Bargaining Power of Buyers
- 4.1.3. Threat of New Entrants
- 4.1.4. Threat of Substitutes
- 4.1.5. Competitive Rivalry
- 4.2. PESTEL analysis
- 4.3. BCG Analysis
- 4.3.1. Stars (High Growth, High Market Share)
- 4.3.2. Cash Cows (Low Growth, High Market Share)
- 4.3.3. Question Mark (High Growth, Low Market Share)
- 4.3.4. Dogs (Low Growth, Low Market Share)
- 4.4. Ansoff Matrix Analysis
- 4.5. Supply Chain Analysis
- 4.6. Regulatory Landscape
- 4.7. Current Market Potential and Opportunity Assessment (TAM–SAM–SOM Framework)
- 4.8. NRP Analyst Note
- 4.1. Porters Five Forces
- 5. Market Analysis, Insights and Forecast 2021-2033
- 5.1. Market Analysis, Insights and Forecast - by Function
- 5.1.1. Fungicide
- 5.1.2. Herbicide
- 5.1.3. Insecticide
- 5.1.4. Molluscicide
- 5.1.5. Nematicide
- 5.2. Market Analysis, Insights and Forecast - by Application Mode
- 5.2.1. Chemigation
- 5.2.2. Foliar
- 5.2.3. Fumigation
- 5.2.4. Seed Treatment
- 5.2.5. Soil Treatment
- 5.3. Market Analysis, Insights and Forecast - by Crop Type
- 5.3.1. Commercial Crops
- 5.3.2. Fruits & Vegetables
- 5.3.3. Grains & Cereals
- 5.3.4. Pulses & Oilseeds
- 5.3.5. Turf & Ornamental
- 5.4. Market Analysis, Insights and Forecast - by Function
- 5.4.1. Fungicide
- 5.4.2. Herbicide
- 5.4.3. Insecticide
- 5.4.4. Molluscicide
- 5.4.5. Nematicide
- 5.5. Market Analysis, Insights and Forecast - by Application Mode
- 5.5.1. Chemigation
- 5.5.2. Foliar
- 5.5.3. Fumigation
- 5.5.4. Seed Treatment
- 5.5.5. Soil Treatment
- 5.6. Market Analysis, Insights and Forecast - by Crop Type
- 5.6.1. Commercial Crops
- 5.6.2. Fruits & Vegetables
- 5.6.3. Grains & Cereals
- 5.6.4. Pulses & Oilseeds
- 5.6.5. Turf & Ornamental
- 5.7. Market Analysis, Insights and Forecast - by Region
- 5.7.1. North America
- 5.1. Market Analysis, Insights and Forecast - by Function
- 6. North America Crop Protection Chemicals Industry Analysis, Insights and Forecast, 2021-2033
- 6.1. Market Analysis, Insights and Forecast - by Function
- 6.1.1. Fungicide
- 6.1.2. Herbicide
- 6.1.3. Insecticide
- 6.1.4. Molluscicide
- 6.1.5. Nematicide
- 6.2. Market Analysis, Insights and Forecast - by Application Mode
- 6.2.1. Chemigation
- 6.2.2. Foliar
- 6.2.3. Fumigation
- 6.2.4. Seed Treatment
- 6.2.5. Soil Treatment
- 6.3. Market Analysis, Insights and Forecast - by Crop Type
- 6.3.1. Commercial Crops
- 6.3.2. Fruits & Vegetables
- 6.3.3. Grains & Cereals
- 6.3.4. Pulses & Oilseeds
- 6.3.5. Turf & Ornamental
- 6.4. Market Analysis, Insights and Forecast - by Function
- 6.4.1. Fungicide
- 6.4.2. Herbicide
- 6.4.3. Insecticide
- 6.4.4. Molluscicide
- 6.4.5. Nematicide
- 6.5. Market Analysis, Insights and Forecast - by Application Mode
- 6.5.1. Chemigation
- 6.5.2. Foliar
- 6.5.3. Fumigation
- 6.5.4. Seed Treatment
- 6.5.5. Soil Treatment
- 6.6. Market Analysis, Insights and Forecast - by Crop Type
- 6.6.1. Commercial Crops
- 6.6.2. Fruits & Vegetables
- 6.6.3. Grains & Cereals
- 6.6.4. Pulses & Oilseeds
- 6.6.5. Turf & Ornamental
- 6.1. Market Analysis, Insights and Forecast - by Function
- 7. Competitive Analysis
- 7.1. Company Profiles
- 7.1.1 FMC Corporation
- 7.1.1.1. Company Overview
- 7.1.1.2. Products
- 7.1.1.3. Company Financials
- 7.1.1.4. SWOT Analysis
- 7.1.2 Sumitomo Chemical Co Ltd
- 7.1.2.1. Company Overview
- 7.1.2.2. Products
- 7.1.2.3. Company Financials
- 7.1.2.4. SWOT Analysis
- 7.1.3 American Vanguard Corporation
- 7.1.3.1. Company Overview
- 7.1.3.2. Products
- 7.1.3.3. Company Financials
- 7.1.3.4. SWOT Analysis
- 7.1.4 ADAMA Agricultural Solutions Ltd
- 7.1.4.1. Company Overview
- 7.1.4.2. Products
- 7.1.4.3. Company Financials
- 7.1.4.4. SWOT Analysis
- 7.1.5 Bayer AG
- 7.1.5.1. Company Overview
- 7.1.5.2. Products
- 7.1.5.3. Company Financials
- 7.1.5.4. SWOT Analysis
- 7.1.6 UPL Limite
- 7.1.6.1. Company Overview
- 7.1.6.2. Products
- 7.1.6.3. Company Financials
- 7.1.6.4. SWOT Analysis
- 7.1.7 Syngenta Group
- 7.1.7.1. Company Overview
- 7.1.7.2. Products
- 7.1.7.3. Company Financials
- 7.1.7.4. SWOT Analysis
- 7.1.8 Corteva Agriscience
- 7.1.8.1. Company Overview
- 7.1.8.2. Products
- 7.1.8.3. Company Financials
- 7.1.8.4. SWOT Analysis
- 7.1.9 Nufarm Ltd
- 7.1.9.1. Company Overview
- 7.1.9.2. Products
- 7.1.9.3. Company Financials
- 7.1.9.4. SWOT Analysis
- 7.1.10 BASF SE
- 7.1.10.1. Company Overview
- 7.1.10.2. Products
- 7.1.10.3. Company Financials
- 7.1.10.4. SWOT Analysis
- 7.1.1 FMC Corporation
- 7.2. Market Entropy
- 7.2.1 Company's Key Areas Served
- 7.2.2 Recent Developments
- 7.3. Company Market Share Analysis 2025
- 7.3.1 Top 5 Companies Market Share Analysis
- 7.3.2 Top 3 Companies Market Share Analysis
- 7.4. List of Potential Customers
- 8. Research Methodology
List of Figures
- Figure 1: North America Crop Protection Chemicals Industry Revenue Breakdown (billion, %) by Product 2025 & 2033
- Figure 2: North America Crop Protection Chemicals Industry Share (%) by Company 2025
List of Tables
- Table 1: North America Crop Protection Chemicals Industry Revenue billion Forecast, by Function 2020 & 2033
- Table 2: North America Crop Protection Chemicals Industry Volume Kiloton Forecast, by Function 2020 & 2033
- Table 3: North America Crop Protection Chemicals Industry Revenue billion Forecast, by Application Mode 2020 & 2033
- Table 4: North America Crop Protection Chemicals Industry Volume Kiloton Forecast, by Application Mode 2020 & 2033
- Table 5: North America Crop Protection Chemicals Industry Revenue billion Forecast, by Crop Type 2020 & 2033
- Table 6: North America Crop Protection Chemicals Industry Volume Kiloton Forecast, by Crop Type 2020 & 2033
- Table 7: North America Crop Protection Chemicals Industry Revenue billion Forecast, by Function 2020 & 2033
- Table 8: North America Crop Protection Chemicals Industry Volume Kiloton Forecast, by Function 2020 & 2033
- Table 9: North America Crop Protection Chemicals Industry Revenue billion Forecast, by Application Mode 2020 & 2033
- Table 10: North America Crop Protection Chemicals Industry Volume Kiloton Forecast, by Application Mode 2020 & 2033
- Table 11: North America Crop Protection Chemicals Industry Revenue billion Forecast, by Crop Type 2020 & 2033
- Table 12: North America Crop Protection Chemicals Industry Volume Kiloton Forecast, by Crop Type 2020 & 2033
- Table 13: North America Crop Protection Chemicals Industry Revenue billion Forecast, by Region 2020 & 2033
- Table 14: North America Crop Protection Chemicals Industry Volume Kiloton Forecast, by Region 2020 & 2033
- Table 15: North America Crop Protection Chemicals Industry Revenue billion Forecast, by Function 2020 & 2033
- Table 16: North America Crop Protection Chemicals Industry Volume Kiloton Forecast, by Function 2020 & 2033
- Table 17: North America Crop Protection Chemicals Industry Revenue billion Forecast, by Application Mode 2020 & 2033
- Table 18: North America Crop Protection Chemicals Industry Volume Kiloton Forecast, by Application Mode 2020 & 2033
- Table 19: North America Crop Protection Chemicals Industry Revenue billion Forecast, by Crop Type 2020 & 2033
- Table 20: North America Crop Protection Chemicals Industry Volume Kiloton Forecast, by Crop Type 2020 & 2033
- Table 21: North America Crop Protection Chemicals Industry Revenue billion Forecast, by Function 2020 & 2033
- Table 22: North America Crop Protection Chemicals Industry Volume Kiloton Forecast, by Function 2020 & 2033
- Table 23: North America Crop Protection Chemicals Industry Revenue billion Forecast, by Application Mode 2020 & 2033
- Table 24: North America Crop Protection Chemicals Industry Volume Kiloton Forecast, by Application Mode 2020 & 2033
- Table 25: North America Crop Protection Chemicals Industry Revenue billion Forecast, by Crop Type 2020 & 2033
- Table 26: North America Crop Protection Chemicals Industry Volume Kiloton Forecast, by Crop Type 2020 & 2033
- Table 27: North America Crop Protection Chemicals Industry Revenue billion Forecast, by Country 2020 & 2033
- Table 28: North America Crop Protection Chemicals Industry Volume Kiloton Forecast, by Country 2020 & 2033
- Table 29: United States North America Crop Protection Chemicals Industry Revenue (billion) Forecast, by Application 2020 & 2033
- Table 30: United States North America Crop Protection Chemicals Industry Volume (Kiloton) Forecast, by Application 2020 & 2033
- Table 31: Canada North America Crop Protection Chemicals Industry Revenue (billion) Forecast, by Application 2020 & 2033
- Table 32: Canada North America Crop Protection Chemicals Industry Volume (Kiloton) Forecast, by Application 2020 & 2033
- Table 33: Mexico North America Crop Protection Chemicals Industry Revenue (billion) Forecast, by Application 2020 & 2033
- Table 34: Mexico North America Crop Protection Chemicals Industry Volume (Kiloton) Forecast, by Application 2020 & 2033
Frequently Asked Questions
1. What is the projected Compound Annual Growth Rate (CAGR) of the North America Crop Protection Chemicals Industry?
The projected CAGR is approximately 4.6%.
2. Which companies are prominent players in the North America Crop Protection Chemicals Industry?
Key companies in the market include FMC Corporation, Sumitomo Chemical Co Ltd, American Vanguard Corporation, ADAMA Agricultural Solutions Ltd, Bayer AG, UPL Limite, Syngenta Group, Corteva Agriscience, Nufarm Ltd, BASF SE.
3. What are the main segments of the North America Crop Protection Chemicals Industry?
The market segments include Function, Application Mode, Crop Type, Function, Application Mode, Crop Type.
4. Can you provide details about the market size?
The market size is estimated to be USD 76.18 billion as of 2022.
5. What are some drivers contributing to market growth?
Seed Treatment As A Solution To Enhance Yield; Growing Awareness For Seed Treatment Among The Farmers; Rising Trend Of Organic Farming.
6. What are the notable trends driving market growth?
The United States dominated the market due to the increased demand to protect crops from pests and diseases.
7. Are there any restraints impacting market growth?
Limitations Across Farm-Level Seed Treatment; Rising Environmental Concerns.
8. Can you provide examples of recent developments in the market?
July 2023: ADAMA introduced new products, Davai A Plus and Clearfield Broad-Spectrum Herbicide Solutions, for imidazolinone-tolerant legumes like lentils, peas, and soybeans.April 2023: Nufarm launched a new liquid formulation fungicide, Tourney EZ, exclusively for turf and ornamental crops based on customer demand, which further strengthens the company's role in turf and ornamental crop protection.March 2023: AMVAC launched a portfolio of herbicides, including Impact Core and Sinate, to combat weed resistance in maize.
9. What pricing options are available for accessing the report?
Pricing options include single-user, multi-user, and enterprise licenses priced at USD 3800, USD 4500, and USD 5800 respectively.
10. Is the market size provided in terms of value or volume?
The market size is provided in terms of value, measured in billion and volume, measured in Kiloton.
11. Are there any specific market keywords associated with the report?
Yes, the market keyword associated with the report is "North America Crop Protection Chemicals Industry," which aids in identifying and referencing the specific market segment covered.
12. How do I determine which pricing option suits my needs best?
The pricing options vary based on user requirements and access needs. Individual users may opt for single-user licenses, while businesses requiring broader access may choose multi-user or enterprise licenses for cost-effective access to the report.
13. Are there any additional resources or data provided in the North America Crop Protection Chemicals Industry report?
While the report offers comprehensive insights, it's advisable to review the specific contents or supplementary materials provided to ascertain if additional resources or data are available.
14. How can I stay updated on further developments or reports in the North America Crop Protection Chemicals Industry?
To stay informed about further developments, trends, and reports in the North America Crop Protection Chemicals Industry, consider subscribing to industry newsletters, following relevant companies and organizations, or regularly checking reputable industry news sources and publications.
Methodology
Step 1 - Identification of Relevant Samples Size from Population Database


Step 2 - Approaches for Defining Global Market Size (Value, Volume* & Price*)

Note*: In applicable scenarios
Step 3 - Data Sources
Primary Research
- Web Analytics
- Survey Reports
- Research Institute
- Latest Research Reports
- Opinion Leaders
Secondary Research
- Annual Reports
- White Paper
- Latest Press Release
- Industry Association
- Paid Database
- Investor Presentations

Step 4 - Data Triangulation
Involves using different sources of information in order to increase the validity of a study
These sources are likely to be stakeholders in a program - participants, other researchers, program staff, other community members, and so on.
Then we put all data in single framework & apply various statistical tools to find out the dynamic on the market.
During the analysis stage, feedback from the stakeholder groups would be compared to determine areas of agreement as well as areas of divergence