

Key Insights
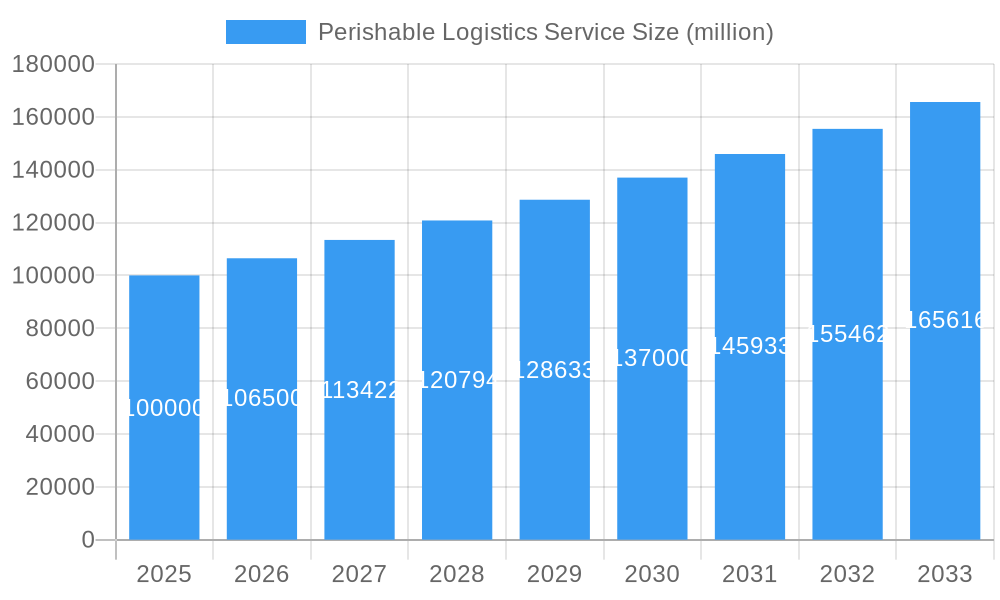
The global Perishable Logistics Service market is projected for substantial growth, with an estimated market size of approximately $100 billion in 2025, and is expected to expand at a Compound Annual Growth Rate (CAGR) of around 6.5% through 2033. This robust expansion is fueled by the increasing global demand for fresh produce, a growing e-commerce sector for groceries and pharmaceuticals, and advancements in cold chain technology. Key drivers include the rising consumer preference for convenient access to a wider variety of fresh foods, the expansion of international trade in perishable goods, and the critical need for efficient temperature-controlled transportation to minimize spoilage and waste. The Meats and Seafood segment, along with Fresh Fruits and Vegetables, represent the largest application areas, reflecting the significant volume of these goods requiring specialized logistics. Land freight currently dominates the market due to its cost-effectiveness for shorter distances, but sea and air freight are witnessing increased adoption for longer-haul and time-sensitive shipments, driven by globalization and the demand for faster delivery.
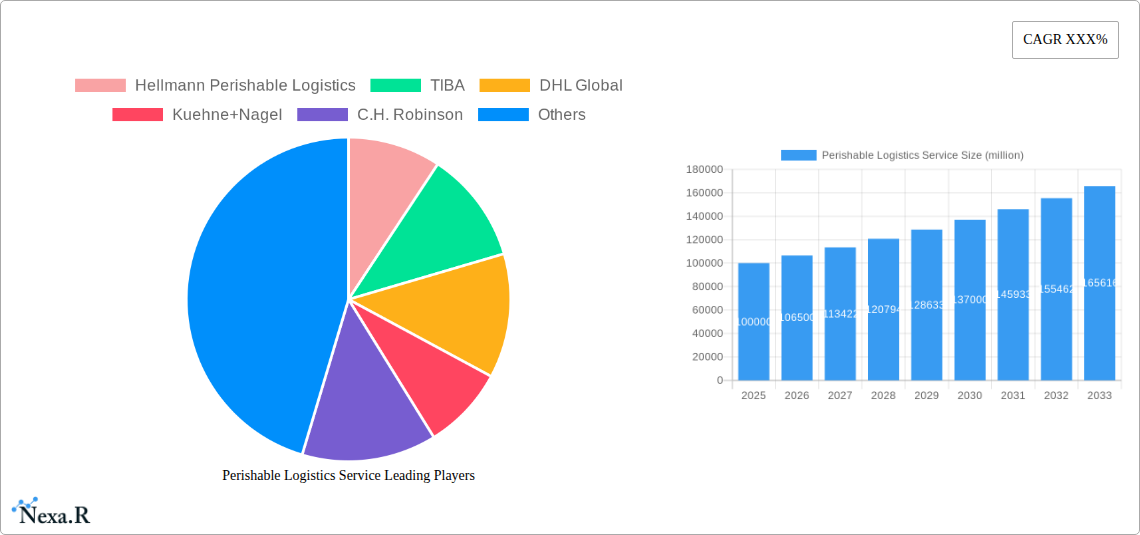
Perishable Logistics Service Market Size (In Billion)
Despite the positive growth trajectory, the market faces certain restraints. These include the high operational costs associated with maintaining strict temperature control across the supply chain, potential infrastructure limitations in developing regions, and the complexities of navigating diverse international regulations for perishable goods. However, ongoing technological innovations, such as advanced tracking systems, smart packaging, and improved reefer container technology, are mitigating these challenges and enhancing overall efficiency. The market is characterized by intense competition among established global players like DHL Global, Kuehne+Nagel, and DB Schenker, alongside specialized providers. Emerging trends like the integration of IoT for real-time monitoring, a growing emphasis on sustainability in cold chain operations, and the rise of specialized logistics providers catering to niche perishable categories are shaping the future landscape of perishable logistics. The Asia Pacific region, particularly China and India, is expected to emerge as a significant growth engine, driven by rapid urbanization, a burgeoning middle class, and increasing disposable incomes, leading to higher consumption of perishable products.
Perishable Logistics Service Company Market Share
Sure, here is a compelling, SEO-optimized report description for Perishable Logistics Services, integrating high-traffic keywords and adhering to your specified structure and constraints.
Perishable Logistics Service Market Dynamics & Structure
The global perishable logistics market is characterized by a moderately concentrated structure, with key players like DHL Global, Kuehne+Nagel, and DB Schenker holding significant market shares. Technological innovation is a primary driver, with advancements in cold chain technology, real-time tracking, and AI-powered route optimization enhancing efficiency and reducing spoilage. Regulatory frameworks, particularly those concerning food safety and international trade of perishable goods, influence operational strategies and compliance costs. Competitive product substitutes, such as improved packaging solutions and shorter supply chains, are emerging but the core logistics services remain dominant. End-user demographics are shifting towards a greater demand for fresh, high-quality, and sustainably sourced products, driving growth in specialized logistics segments. Mergers and acquisitions (M&A) are notable, with companies seeking to expand their global reach and service portfolios.
- Market Concentration: Dominated by a few large global players, but with increasing participation from regional specialists.
- Technological Drivers: IoT for real-time monitoring, advanced refrigeration systems, blockchain for traceability, and AI for predictive analytics.
- Regulatory Influence: Strict adherence to HACCP, FSMA, and other food safety standards, alongside customs and import/export regulations.
- End-User Shifts: Growing demand for organic, specialty, and ethically sourced perishables, necessitating sophisticated cold chain management.
- M&A Trends: Consolidation for economies of scale, acquisition of specialized cold chain providers, and expansion into emerging markets.
Perishable Logistics Service Growth Trends & Insights
The perishable logistics service market is experiencing robust growth, fueled by increasing global trade, evolving consumer preferences for fresh produce year-round, and the expansion of e-commerce for groceries and specialty foods. The market size has seen a consistent upward trajectory, with a projected Compound Annual Growth Rate (CAGR) of approximately XX% from 2019 to 2033. Base year projections for 2025 estimate the market value at around XXXX million units, with a further expansion to an estimated XXXX million units by the end of the forecast period in 2033. Adoption rates for advanced cold chain technologies are accelerating, driven by the need to minimize waste and maintain product integrity. Technological disruptions, such as autonomous reefer containers and drone delivery for last-mile logistics of high-value perishables, are beginning to emerge, promising further efficiency gains. Consumer behavior shifts are pivotal, with a growing emphasis on health, wellness, and convenience leading to higher demand for a wider variety of fresh fruits, vegetables, and specialized dairy products. The expansion of the online grocery sector has been a significant catalyst, directly translating into increased demand for specialized last-mile perishable logistics. This trend is particularly pronounced in urban centers and developed economies. Furthermore, the globalization of food supply chains, while complex, has also opened new avenues for perishable logistics providers to connect producers with consumers across continents. The report leverages advanced market modeling techniques to present these insights, considering factors such as disposable income levels, population growth, and the penetration of cold storage facilities globally. The integration of data analytics and machine learning in optimizing routes and managing inventory is becoming standard practice, allowing for proactive problem-solving and improved customer satisfaction.
Dominant Regions, Countries, or Segments in Perishable Logistics Service
The Meats and Seafood application segment is a dominant force driving growth in the perishable logistics service market, projected to account for approximately XX% of the global market value by 2025. This dominance is attributed to the high value, stringent temperature control requirements, and increasing global demand for protein-rich diets. Countries within North America and Europe, particularly the United States, Canada, Germany, and France, are leading the market due to advanced infrastructure, high consumer spending power, and established trade networks. The Air Freight type of transportation is crucial for the high-value and time-sensitive Meats and Seafood segment, especially for long-haul international routes.
Meats and Seafood Segment Drivers:
- Rising global meat and seafood consumption, particularly in emerging economies.
- Strict quality and safety regulations necessitating robust cold chain management.
- Increasing consumer preference for premium and sustainably sourced products.
- Technological advancements in specialized packaging and temperature monitoring.
- Significant market share of approximately XX% of the total perishable logistics market.
Dominant Regions & Countries:
- North America: High disposable income, strong demand for diverse protein sources, and extensive cold chain infrastructure.
- Europe: Well-developed logistics networks, stringent food safety standards, and a mature market for imported and exported perishables.
- Key Countries: United States (estimated XX% of regional market), Germany (estimated XX% of regional market).
Air Freight Dominance:
- Essential for rapid delivery of high-value, short-shelf-life products like fresh seafood and certain types of meat.
- Accounts for an estimated XX% of the total logistics cost for premium perishable goods.
- Facilitates global trade of products that would otherwise perish during transit.
Perishable Logistics Service Product Landscape
The perishable logistics service product landscape is defined by an array of specialized solutions designed to maintain product integrity from origin to destination. Innovations focus on advanced temperature-controlled warehousing, sophisticated reefer container technology, and real-time monitoring systems. Unique selling propositions include end-to-end cold chain visibility, minimized spoilage rates, and compliance with international food safety standards. Technological advancements like dynamic temperature control, humidity management, and specialized handling for sensitive products such as flowers and pharmaceutical perishables are key differentiators. The performance metrics emphasize reduced transit times, optimized energy consumption for refrigeration, and enhanced traceability throughout the supply chain.
Key Drivers, Barriers & Challenges in Perishable Logistics Service
Key Drivers:
- Growing Global Demand for Fresh Produce: Increasing consumer focus on health and wellness fuels demand for a year-round supply of fruits, vegetables, and other fresh goods.
- E-commerce Expansion: The surge in online grocery shopping necessitates efficient and reliable cold chain logistics for last-mile delivery.
- Technological Advancements: Innovations in refrigeration, tracking, and data analytics enhance efficiency, reduce spoilage, and improve traceability.
- Globalization of Food Supply Chains: Increased international trade of perishable items requires sophisticated cross-border logistics solutions.
Barriers & Challenges:
- High Infrastructure Costs: Establishing and maintaining a robust cold chain requires significant investment in specialized vehicles, warehouses, and technology.
- Regulatory Complexity: Navigating diverse international food safety regulations, customs procedures, and import/export requirements presents substantial hurdles.
- Supply Chain Disruptions: Geopolitical events, extreme weather, and port congestion can severely impact the timely delivery of perishable goods, leading to substantial losses.
- Talent Shortage: A lack of skilled personnel trained in cold chain management and specialized logistics operations.
- Fuel Price Volatility: Fluctuations in fuel prices directly impact the operational costs of refrigerated transportation, affecting profit margins. The estimated impact of fuel price volatility can range from XX% to XX% on operational expenses.
Emerging Opportunities in Perishable Logistics Service
Emerging opportunities lie in the expansion of specialized cold chain solutions for niche markets like plant-based foods and ethically sourced produce. The growing demand for ready-to-eat meals and meal kits also presents a significant growth area for efficient, temperature-controlled delivery. Furthermore, the integration of blockchain technology for enhanced traceability and transparency in the supply chain offers a competitive advantage. Untapped markets in developing economies with increasing disposable incomes and a growing middle class also represent substantial future potential for perishable logistics providers. The development of sustainable cold chain solutions, utilizing renewable energy sources and eco-friendly refrigerants, is also gaining traction.
Growth Accelerators in the Perishable Logistics Service Industry
Growth accelerators in the perishable logistics service industry are primarily driven by technological breakthroughs in cold chain automation and AI-powered logistics management. Strategic partnerships between logistics providers, technology firms, and food producers are crucial for developing integrated supply chain solutions. Market expansion into emerging economies, where demand for fresh and processed foods is rapidly increasing, offers substantial growth potential. The development of more resilient and agile supply chains, capable of withstanding disruptions, will also be a key accelerator. Furthermore, investments in sustainable logistics practices are becoming a differentiator and growth driver as consumer and regulatory pressures mount.
Key Players Shaping the Perishable Logistics Service Market
- Hellmann Perishable Logistics
- TIBA
- DHL Global
- Kuehne+Nagel
- C.H. Robinson
- Asiana
- Kensa Logistics
- RH Shipping
- Able Freight
- DB Schenker
- AIT Worldwide Logistics
- DSV Skyservices
- Delta Global Solutions
- Across Logistics
- Yusen Logistics
- cargo-partner
- Globelink Ünimar
Notable Milestones in Perishable Logistics Service Sector
- 2019: Launch of advanced IoT-enabled cold chain monitoring systems by major providers, enhancing real-time visibility.
- 2020: Significant surge in demand for last-mile cold chain logistics due to the rapid growth of online grocery sales.
- 2021: Increased adoption of specialized active reefer containers with improved temperature control and energy efficiency.
- 2022: Growing investments in AI and machine learning for route optimization and predictive spoilage analysis.
- 2023: Greater emphasis on sustainability in cold chain operations, with pilots of electric refrigerated vehicles and alternative refrigerants.
- 2024: Expansion of cold chain infrastructure in emerging markets to cater to rising consumer demand.
In-Depth Perishable Logistics Service Market Outlook
The future market outlook for perishable logistics services is exceptionally positive, driven by sustained growth in global food consumption and the increasing demand for a diverse range of fresh products. Growth accelerators like technological innovation in cold chain automation, AI-driven logistics, and the expansion into underserved emerging markets will propel the industry forward. Strategic partnerships and a focus on building resilient, sustainable supply chains will be paramount for success. The industry is poised for significant expansion as e-commerce continues to transform food distribution and consumer preferences evolve towards higher quality, traceable, and ethically produced goods. The ability to adapt to evolving regulatory landscapes and mitigate supply chain risks will define market leaders.
Perishable Logistics Service Segmentation
-
1. Application
- 1.1. Meats and Seafood
- 1.2. Fresh Fruits and Vegetables
- 1.3. Dairy
- 1.4. Flowers and Plants
- 1.5. Other
-
2. Type
- 2.1. Land Freight
- 2.2. Sea Freight
- 2.3. Air Freight
Perishable Logistics Service Segmentation By Geography
-
1. North America
- 1.1. United States
- 1.2. Canada
- 1.3. Mexico
-
2. South America
- 2.1. Brazil
- 2.2. Argentina
- 2.3. Rest of South America
-
3. Europe
- 3.1. United Kingdom
- 3.2. Germany
- 3.3. France
- 3.4. Italy
- 3.5. Spain
- 3.6. Russia
- 3.7. Benelux
- 3.8. Nordics
- 3.9. Rest of Europe
-
4. Middle East & Africa
- 4.1. Turkey
- 4.2. Israel
- 4.3. GCC
- 4.4. North Africa
- 4.5. South Africa
- 4.6. Rest of Middle East & Africa
-
5. Asia Pacific
- 5.1. China
- 5.2. India
- 5.3. Japan
- 5.4. South Korea
- 5.5. ASEAN
- 5.6. Oceania
- 5.7. Rest of Asia Pacific
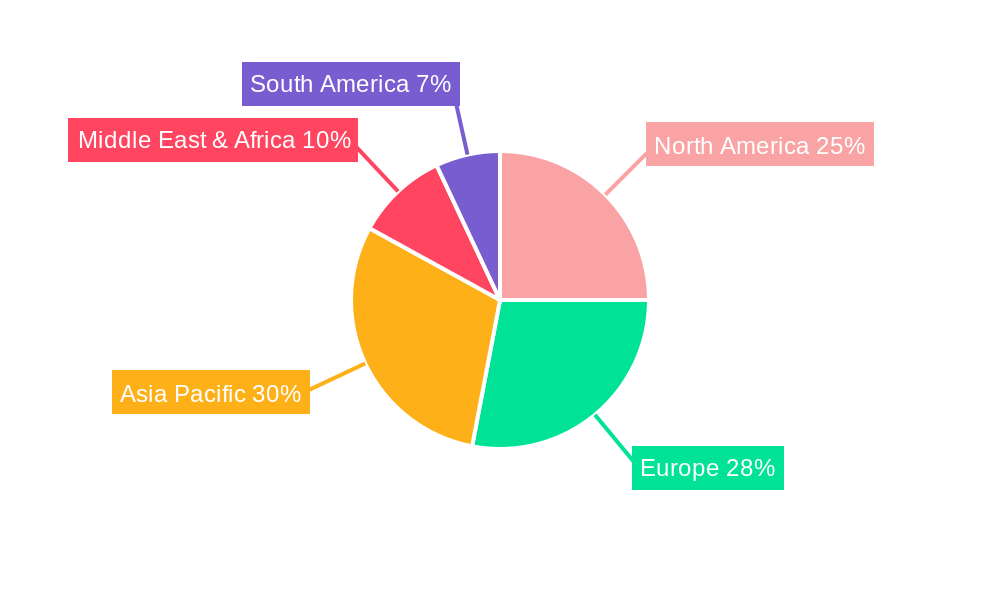
Perishable Logistics Service Regional Market Share
Geographic Coverage of Perishable Logistics Service
Perishable Logistics Service REPORT HIGHLIGHTS
| Aspects | Details |
|---|---|
| Study Period | 2020-2034 |
| Base Year | 2025 |
| Estimated Year | 2026 |
| Forecast Period | 2026-2034 |
| Historical Period | 2020-2025 |
| Growth Rate | CAGR of 7.5% from 2020-2034 |
| Segmentation |
|
Table of Contents
- 1. Introduction
- 1.1. Research Scope
- 1.2. Market Segmentation
- 1.3. Research Objective
- 1.4. Definitions and Assumptions
- 2. Executive Summary
- 2.1. Market Snapshot
- 3. Market Dynamics
- 3.1. Market Drivers
- 3.2. Market Restrains
- 3.3. Market Trends
- 3.4. Market Opportunities
- 4. Market Factor Analysis
- 4.1. Porters Five Forces
- 4.1.1. Bargaining Power of Suppliers
- 4.1.2. Bargaining Power of Buyers
- 4.1.3. Threat of New Entrants
- 4.1.4. Threat of Substitutes
- 4.1.5. Competitive Rivalry
- 4.2. PESTEL analysis
- 4.3. BCG Analysis
- 4.3.1. Stars (High Growth, High Market Share)
- 4.3.2. Cash Cows (Low Growth, High Market Share)
- 4.3.3. Question Mark (High Growth, Low Market Share)
- 4.3.4. Dogs (Low Growth, Low Market Share)
- 4.4. Ansoff Matrix Analysis
- 4.5. Supply Chain Analysis
- 4.6. Regulatory Landscape
- 4.7. Current Market Potential and Opportunity Assessment (TAM–SAM–SOM Framework)
- 4.8. NRP Analyst Note
- 4.1. Porters Five Forces
- 5. Market Analysis, Insights and Forecast 2021-2033
- 5.1. Market Analysis, Insights and Forecast - by Application
- 5.1.1. Meats and Seafood
- 5.1.2. Fresh Fruits and Vegetables
- 5.1.3. Dairy
- 5.1.4. Flowers and Plants
- 5.1.5. Other
- 5.2. Market Analysis, Insights and Forecast - by Type
- 5.2.1. Land Freight
- 5.2.2. Sea Freight
- 5.2.3. Air Freight
- 5.3. Market Analysis, Insights and Forecast - by Region
- 5.3.1. North America
- 5.3.2. South America
- 5.3.3. Europe
- 5.3.4. Middle East & Africa
- 5.3.5. Asia Pacific
- 5.1. Market Analysis, Insights and Forecast - by Application
- 6. Global Perishable Logistics Service Analysis, Insights and Forecast, 2021-2033
- 6.1. Market Analysis, Insights and Forecast - by Application
- 6.1.1. Meats and Seafood
- 6.1.2. Fresh Fruits and Vegetables
- 6.1.3. Dairy
- 6.1.4. Flowers and Plants
- 6.1.5. Other
- 6.2. Market Analysis, Insights and Forecast - by Type
- 6.2.1. Land Freight
- 6.2.2. Sea Freight
- 6.2.3. Air Freight
- 6.1. Market Analysis, Insights and Forecast - by Application
- 7. North America Perishable Logistics Service Analysis, Insights and Forecast, 2020-2032
- 7.1. Market Analysis, Insights and Forecast - by Application
- 7.1.1. Meats and Seafood
- 7.1.2. Fresh Fruits and Vegetables
- 7.1.3. Dairy
- 7.1.4. Flowers and Plants
- 7.1.5. Other
- 7.2. Market Analysis, Insights and Forecast - by Type
- 7.2.1. Land Freight
- 7.2.2. Sea Freight
- 7.2.3. Air Freight
- 7.1. Market Analysis, Insights and Forecast - by Application
- 8. South America Perishable Logistics Service Analysis, Insights and Forecast, 2020-2032
- 8.1. Market Analysis, Insights and Forecast - by Application
- 8.1.1. Meats and Seafood
- 8.1.2. Fresh Fruits and Vegetables
- 8.1.3. Dairy
- 8.1.4. Flowers and Plants
- 8.1.5. Other
- 8.2. Market Analysis, Insights and Forecast - by Type
- 8.2.1. Land Freight
- 8.2.2. Sea Freight
- 8.2.3. Air Freight
- 8.1. Market Analysis, Insights and Forecast - by Application
- 9. Europe Perishable Logistics Service Analysis, Insights and Forecast, 2020-2032
- 9.1. Market Analysis, Insights and Forecast - by Application
- 9.1.1. Meats and Seafood
- 9.1.2. Fresh Fruits and Vegetables
- 9.1.3. Dairy
- 9.1.4. Flowers and Plants
- 9.1.5. Other
- 9.2. Market Analysis, Insights and Forecast - by Type
- 9.2.1. Land Freight
- 9.2.2. Sea Freight
- 9.2.3. Air Freight
- 9.1. Market Analysis, Insights and Forecast - by Application
- 10. Middle East & Africa Perishable Logistics Service Analysis, Insights and Forecast, 2020-2032
- 10.1. Market Analysis, Insights and Forecast - by Application
- 10.1.1. Meats and Seafood
- 10.1.2. Fresh Fruits and Vegetables
- 10.1.3. Dairy
- 10.1.4. Flowers and Plants
- 10.1.5. Other
- 10.2. Market Analysis, Insights and Forecast - by Type
- 10.2.1. Land Freight
- 10.2.2. Sea Freight
- 10.2.3. Air Freight
- 10.1. Market Analysis, Insights and Forecast - by Application
- 11. Asia Pacific Perishable Logistics Service Analysis, Insights and Forecast, 2020-2032
- 11.1. Market Analysis, Insights and Forecast - by Application
- 11.1.1. Meats and Seafood
- 11.1.2. Fresh Fruits and Vegetables
- 11.1.3. Dairy
- 11.1.4. Flowers and Plants
- 11.1.5. Other
- 11.2. Market Analysis, Insights and Forecast - by Type
- 11.2.1. Land Freight
- 11.2.2. Sea Freight
- 11.2.3. Air Freight
- 11.1. Market Analysis, Insights and Forecast - by Application
- 12. Competitive Analysis
- 12.1. Company Profiles
- 12.1.1 Hellmann Perishable Logistics
- 12.1.1.1. Company Overview
- 12.1.1.2. Products
- 12.1.1.3. Company Financials
- 12.1.1.4. SWOT Analysis
- 12.1.2 TIBA
- 12.1.2.1. Company Overview
- 12.1.2.2. Products
- 12.1.2.3. Company Financials
- 12.1.2.4. SWOT Analysis
- 12.1.3 DHL Global
- 12.1.3.1. Company Overview
- 12.1.3.2. Products
- 12.1.3.3. Company Financials
- 12.1.3.4. SWOT Analysis
- 12.1.4 Kuehne+Nagel
- 12.1.4.1. Company Overview
- 12.1.4.2. Products
- 12.1.4.3. Company Financials
- 12.1.4.4. SWOT Analysis
- 12.1.5 C.H. Robinson
- 12.1.5.1. Company Overview
- 12.1.5.2. Products
- 12.1.5.3. Company Financials
- 12.1.5.4. SWOT Analysis
- 12.1.6 Asiana
- 12.1.6.1. Company Overview
- 12.1.6.2. Products
- 12.1.6.3. Company Financials
- 12.1.6.4. SWOT Analysis
- 12.1.7 Kensa Logistics
- 12.1.7.1. Company Overview
- 12.1.7.2. Products
- 12.1.7.3. Company Financials
- 12.1.7.4. SWOT Analysis
- 12.1.8 RH Shipping
- 12.1.8.1. Company Overview
- 12.1.8.2. Products
- 12.1.8.3. Company Financials
- 12.1.8.4. SWOT Analysis
- 12.1.9 Able Freight
- 12.1.9.1. Company Overview
- 12.1.9.2. Products
- 12.1.9.3. Company Financials
- 12.1.9.4. SWOT Analysis
- 12.1.10 DB Schenker
- 12.1.10.1. Company Overview
- 12.1.10.2. Products
- 12.1.10.3. Company Financials
- 12.1.10.4. SWOT Analysis
- 12.1.11 AIT Worldwide Logistics
- 12.1.11.1. Company Overview
- 12.1.11.2. Products
- 12.1.11.3. Company Financials
- 12.1.11.4. SWOT Analysis
- 12.1.12 DSV Skyservices
- 12.1.12.1. Company Overview
- 12.1.12.2. Products
- 12.1.12.3. Company Financials
- 12.1.12.4. SWOT Analysis
- 12.1.13 Delta Global Solutions
- 12.1.13.1. Company Overview
- 12.1.13.2. Products
- 12.1.13.3. Company Financials
- 12.1.13.4. SWOT Analysis
- 12.1.14 Across Logistics
- 12.1.14.1. Company Overview
- 12.1.14.2. Products
- 12.1.14.3. Company Financials
- 12.1.14.4. SWOT Analysis
- 12.1.15 Yusen Logistics
- 12.1.15.1. Company Overview
- 12.1.15.2. Products
- 12.1.15.3. Company Financials
- 12.1.15.4. SWOT Analysis
- 12.1.16 cargo-partner
- 12.1.16.1. Company Overview
- 12.1.16.2. Products
- 12.1.16.3. Company Financials
- 12.1.16.4. SWOT Analysis
- 12.1.17 Globelink Ünimar
- 12.1.17.1. Company Overview
- 12.1.17.2. Products
- 12.1.17.3. Company Financials
- 12.1.17.4. SWOT Analysis
- 12.1.1 Hellmann Perishable Logistics
- 12.2. Market Entropy
- 12.2.1 Company's Key Areas Served
- 12.2.2 Recent Developments
- 12.3. Company Market Share Analysis 2025
- 12.3.1 Top 5 Companies Market Share Analysis
- 12.3.2 Top 3 Companies Market Share Analysis
- 12.4. List of Potential Customers
- 13. Research Methodology
List of Figures
- Figure 1: Global Perishable Logistics Service Revenue Breakdown (billion, %) by Region 2025 & 2033
- Figure 2: North America Perishable Logistics Service Revenue (billion), by Application 2025 & 2033
- Figure 3: North America Perishable Logistics Service Revenue Share (%), by Application 2025 & 2033
- Figure 4: North America Perishable Logistics Service Revenue (billion), by Type 2025 & 2033
- Figure 5: North America Perishable Logistics Service Revenue Share (%), by Type 2025 & 2033
- Figure 6: North America Perishable Logistics Service Revenue (billion), by Country 2025 & 2033
- Figure 7: North America Perishable Logistics Service Revenue Share (%), by Country 2025 & 2033
- Figure 8: South America Perishable Logistics Service Revenue (billion), by Application 2025 & 2033
- Figure 9: South America Perishable Logistics Service Revenue Share (%), by Application 2025 & 2033
- Figure 10: South America Perishable Logistics Service Revenue (billion), by Type 2025 & 2033
- Figure 11: South America Perishable Logistics Service Revenue Share (%), by Type 2025 & 2033
- Figure 12: South America Perishable Logistics Service Revenue (billion), by Country 2025 & 2033
- Figure 13: South America Perishable Logistics Service Revenue Share (%), by Country 2025 & 2033
- Figure 14: Europe Perishable Logistics Service Revenue (billion), by Application 2025 & 2033
- Figure 15: Europe Perishable Logistics Service Revenue Share (%), by Application 2025 & 2033
- Figure 16: Europe Perishable Logistics Service Revenue (billion), by Type 2025 & 2033
- Figure 17: Europe Perishable Logistics Service Revenue Share (%), by Type 2025 & 2033
- Figure 18: Europe Perishable Logistics Service Revenue (billion), by Country 2025 & 2033
- Figure 19: Europe Perishable Logistics Service Revenue Share (%), by Country 2025 & 2033
- Figure 20: Middle East & Africa Perishable Logistics Service Revenue (billion), by Application 2025 & 2033
- Figure 21: Middle East & Africa Perishable Logistics Service Revenue Share (%), by Application 2025 & 2033
- Figure 22: Middle East & Africa Perishable Logistics Service Revenue (billion), by Type 2025 & 2033
- Figure 23: Middle East & Africa Perishable Logistics Service Revenue Share (%), by Type 2025 & 2033
- Figure 24: Middle East & Africa Perishable Logistics Service Revenue (billion), by Country 2025 & 2033
- Figure 25: Middle East & Africa Perishable Logistics Service Revenue Share (%), by Country 2025 & 2033
- Figure 26: Asia Pacific Perishable Logistics Service Revenue (billion), by Application 2025 & 2033
- Figure 27: Asia Pacific Perishable Logistics Service Revenue Share (%), by Application 2025 & 2033
- Figure 28: Asia Pacific Perishable Logistics Service Revenue (billion), by Type 2025 & 2033
- Figure 29: Asia Pacific Perishable Logistics Service Revenue Share (%), by Type 2025 & 2033
- Figure 30: Asia Pacific Perishable Logistics Service Revenue (billion), by Country 2025 & 2033
- Figure 31: Asia Pacific Perishable Logistics Service Revenue Share (%), by Country 2025 & 2033
List of Tables
- Table 1: Global Perishable Logistics Service Revenue billion Forecast, by Application 2020 & 2033
- Table 2: Global Perishable Logistics Service Revenue billion Forecast, by Type 2020 & 2033
- Table 3: Global Perishable Logistics Service Revenue billion Forecast, by Region 2020 & 2033
- Table 4: Global Perishable Logistics Service Revenue billion Forecast, by Application 2020 & 2033
- Table 5: Global Perishable Logistics Service Revenue billion Forecast, by Type 2020 & 2033
- Table 6: Global Perishable Logistics Service Revenue billion Forecast, by Country 2020 & 2033
- Table 7: United States Perishable Logistics Service Revenue (billion) Forecast, by Application 2020 & 2033
- Table 8: Canada Perishable Logistics Service Revenue (billion) Forecast, by Application 2020 & 2033
- Table 9: Mexico Perishable Logistics Service Revenue (billion) Forecast, by Application 2020 & 2033
- Table 10: Global Perishable Logistics Service Revenue billion Forecast, by Application 2020 & 2033
- Table 11: Global Perishable Logistics Service Revenue billion Forecast, by Type 2020 & 2033
- Table 12: Global Perishable Logistics Service Revenue billion Forecast, by Country 2020 & 2033
- Table 13: Brazil Perishable Logistics Service Revenue (billion) Forecast, by Application 2020 & 2033
- Table 14: Argentina Perishable Logistics Service Revenue (billion) Forecast, by Application 2020 & 2033
- Table 15: Rest of South America Perishable Logistics Service Revenue (billion) Forecast, by Application 2020 & 2033
- Table 16: Global Perishable Logistics Service Revenue billion Forecast, by Application 2020 & 2033
- Table 17: Global Perishable Logistics Service Revenue billion Forecast, by Type 2020 & 2033
- Table 18: Global Perishable Logistics Service Revenue billion Forecast, by Country 2020 & 2033
- Table 19: United Kingdom Perishable Logistics Service Revenue (billion) Forecast, by Application 2020 & 2033
- Table 20: Germany Perishable Logistics Service Revenue (billion) Forecast, by Application 2020 & 2033
- Table 21: France Perishable Logistics Service Revenue (billion) Forecast, by Application 2020 & 2033
- Table 22: Italy Perishable Logistics Service Revenue (billion) Forecast, by Application 2020 & 2033
- Table 23: Spain Perishable Logistics Service Revenue (billion) Forecast, by Application 2020 & 2033
- Table 24: Russia Perishable Logistics Service Revenue (billion) Forecast, by Application 2020 & 2033
- Table 25: Benelux Perishable Logistics Service Revenue (billion) Forecast, by Application 2020 & 2033
- Table 26: Nordics Perishable Logistics Service Revenue (billion) Forecast, by Application 2020 & 2033
- Table 27: Rest of Europe Perishable Logistics Service Revenue (billion) Forecast, by Application 2020 & 2033
- Table 28: Global Perishable Logistics Service Revenue billion Forecast, by Application 2020 & 2033
- Table 29: Global Perishable Logistics Service Revenue billion Forecast, by Type 2020 & 2033
- Table 30: Global Perishable Logistics Service Revenue billion Forecast, by Country 2020 & 2033
- Table 31: Turkey Perishable Logistics Service Revenue (billion) Forecast, by Application 2020 & 2033
- Table 32: Israel Perishable Logistics Service Revenue (billion) Forecast, by Application 2020 & 2033
- Table 33: GCC Perishable Logistics Service Revenue (billion) Forecast, by Application 2020 & 2033
- Table 34: North Africa Perishable Logistics Service Revenue (billion) Forecast, by Application 2020 & 2033
- Table 35: South Africa Perishable Logistics Service Revenue (billion) Forecast, by Application 2020 & 2033
- Table 36: Rest of Middle East & Africa Perishable Logistics Service Revenue (billion) Forecast, by Application 2020 & 2033
- Table 37: Global Perishable Logistics Service Revenue billion Forecast, by Application 2020 & 2033
- Table 38: Global Perishable Logistics Service Revenue billion Forecast, by Type 2020 & 2033
- Table 39: Global Perishable Logistics Service Revenue billion Forecast, by Country 2020 & 2033
- Table 40: China Perishable Logistics Service Revenue (billion) Forecast, by Application 2020 & 2033
- Table 41: India Perishable Logistics Service Revenue (billion) Forecast, by Application 2020 & 2033
- Table 42: Japan Perishable Logistics Service Revenue (billion) Forecast, by Application 2020 & 2033
- Table 43: South Korea Perishable Logistics Service Revenue (billion) Forecast, by Application 2020 & 2033
- Table 44: ASEAN Perishable Logistics Service Revenue (billion) Forecast, by Application 2020 & 2033
- Table 45: Oceania Perishable Logistics Service Revenue (billion) Forecast, by Application 2020 & 2033
- Table 46: Rest of Asia Pacific Perishable Logistics Service Revenue (billion) Forecast, by Application 2020 & 2033
Frequently Asked Questions
1. What is the projected Compound Annual Growth Rate (CAGR) of the Perishable Logistics Service?
The projected CAGR is approximately 7.5%.
2. Which companies are prominent players in the Perishable Logistics Service?
Key companies in the market include Hellmann Perishable Logistics, TIBA, DHL Global, Kuehne+Nagel, C.H. Robinson, Asiana, Kensa Logistics, RH Shipping, Able Freight, DB Schenker, AIT Worldwide Logistics, DSV Skyservices, Delta Global Solutions, Across Logistics, Yusen Logistics, cargo-partner, Globelink Ünimar.
3. What are the main segments of the Perishable Logistics Service?
The market segments include Application, Type.
4. Can you provide details about the market size?
The market size is estimated to be USD 12.3 billion as of 2022.
5. What are some drivers contributing to market growth?
N/A
6. What are the notable trends driving market growth?
N/A
7. Are there any restraints impacting market growth?
N/A
8. Can you provide examples of recent developments in the market?
N/A
9. What pricing options are available for accessing the report?
Pricing options include single-user, multi-user, and enterprise licenses priced at USD 3950.00, USD 5925.00, and USD 7900.00 respectively.
10. Is the market size provided in terms of value or volume?
The market size is provided in terms of value, measured in billion.
11. Are there any specific market keywords associated with the report?
Yes, the market keyword associated with the report is "Perishable Logistics Service," which aids in identifying and referencing the specific market segment covered.
12. How do I determine which pricing option suits my needs best?
The pricing options vary based on user requirements and access needs. Individual users may opt for single-user licenses, while businesses requiring broader access may choose multi-user or enterprise licenses for cost-effective access to the report.
13. Are there any additional resources or data provided in the Perishable Logistics Service report?
While the report offers comprehensive insights, it's advisable to review the specific contents or supplementary materials provided to ascertain if additional resources or data are available.
14. How can I stay updated on further developments or reports in the Perishable Logistics Service?
To stay informed about further developments, trends, and reports in the Perishable Logistics Service, consider subscribing to industry newsletters, following relevant companies and organizations, or regularly checking reputable industry news sources and publications.
Methodology
Step 1 - Identification of Relevant Samples Size from Population Database


Step 2 - Approaches for Defining Global Market Size (Value, Volume* & Price*)

Note*: In applicable scenarios
Step 3 - Data Sources
Primary Research
- Web Analytics
- Survey Reports
- Research Institute
- Latest Research Reports
- Opinion Leaders
Secondary Research
- Annual Reports
- White Paper
- Latest Press Release
- Industry Association
- Paid Database
- Investor Presentations

Step 4 - Data Triangulation
Involves using different sources of information in order to increase the validity of a study
These sources are likely to be stakeholders in a program - participants, other researchers, program staff, other community members, and so on.
Then we put all data in single framework & apply various statistical tools to find out the dynamic on the market.
During the analysis stage, feedback from the stakeholder groups would be compared to determine areas of agreement as well as areas of divergence