

Key Insights
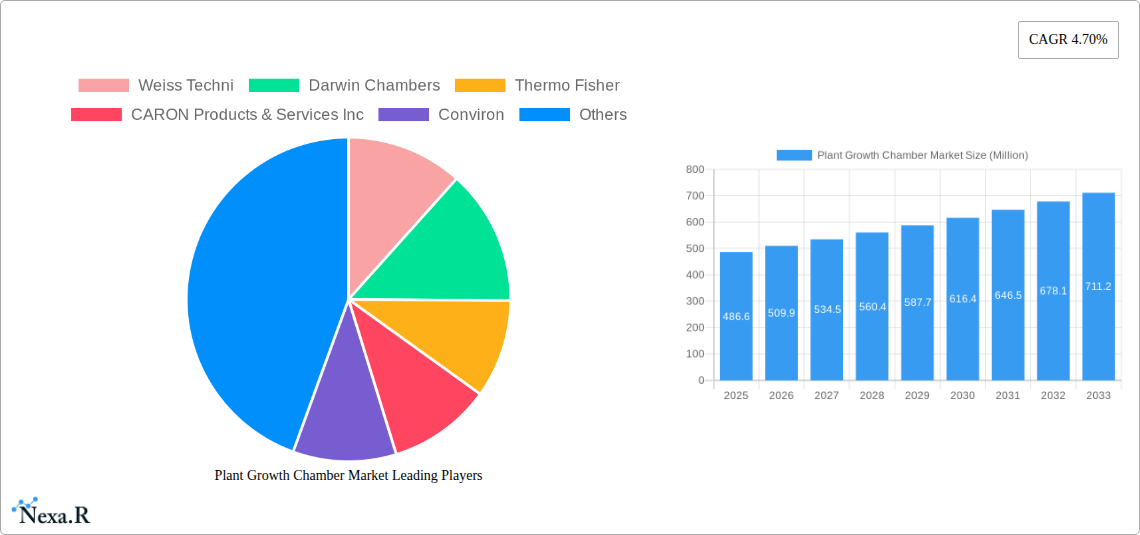
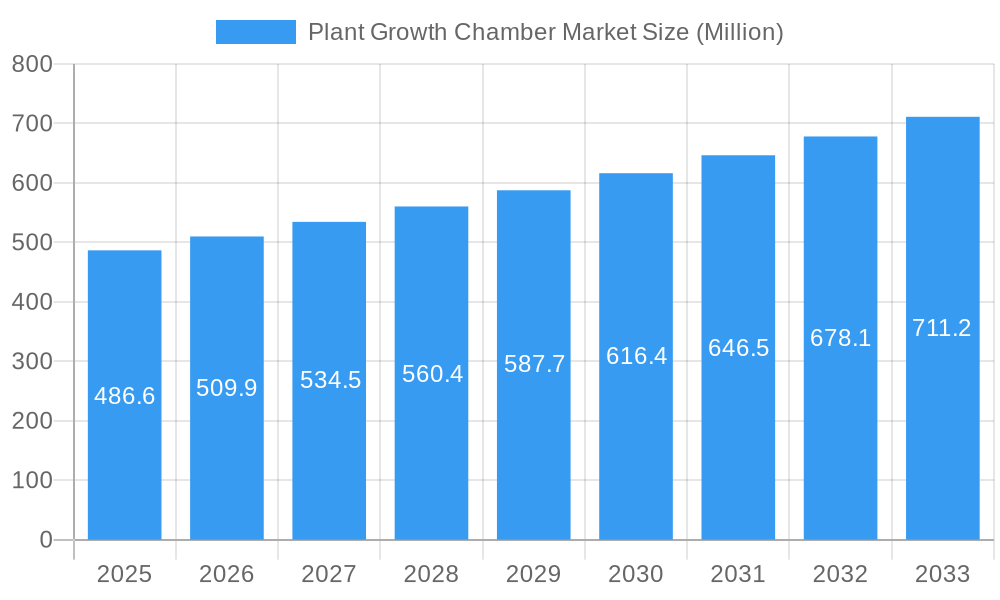
The global plant growth chamber market, valued at $486.60 million in 2025, is projected to experience robust growth, driven by advancements in agricultural technology and the increasing demand for controlled-environment agriculture (CEA). The market's Compound Annual Growth Rate (CAGR) of 4.70% from 2025 to 2033 indicates a significant expansion, fueled by several key factors. The rising adoption of precision agriculture techniques, particularly in research and development, necessitates the use of sophisticated plant growth chambers for optimizing crop yields and studying plant responses to various environmental conditions. Furthermore, the growing need for year-round food production, particularly in regions with limited arable land or extreme climatic conditions, significantly boosts market demand. Specific segments within the market, such as walk-in chambers for larger-scale research and tissue culture applications, are expected to demonstrate particularly strong growth due to their increased efficiency and capacity. The market's regional distribution will likely see continued dominance by North America and Europe, but with significant growth potential in Asia-Pacific regions, driven by increasing agricultural investments and technological advancements.
Plant Growth Chamber Market Market Size (In Million)
Competition in the plant growth chamber market is intense, with established players like Weiss Technik, Darwin Chambers, Thermo Fisher, and Conviron competing with emerging companies. The market is characterized by ongoing innovation in chamber design, including improved environmental control systems, automation features, and data analytics capabilities. The future growth trajectory hinges on several factors including the continued adoption of CEA, advancements in sensor technology, and the development of energy-efficient chamber designs. Factors such as the high initial investment cost of sophisticated chambers and the need for specialized expertise in their operation could act as potential restraints. However, the overall market outlook remains positive, driven by the increasing need for food security, the growing popularity of vertical farming, and the continuous advancement in plant science research.
Plant Growth Chamber Market Company Market Share
Plant Growth Chamber Market: A Comprehensive Report (2019-2033)
This comprehensive report provides an in-depth analysis of the Plant Growth Chamber market, encompassing market dynamics, growth trends, regional segmentation, product landscape, key players, and future outlook. The report covers the period from 2019 to 2033, with 2025 as the base year and a forecast period spanning 2025-2033. The market is segmented by equipment type (reach-in, walk-in), application (short plants, tall plants), and function (plant growth, seed germination, environment optimization, tissue culture). This detailed analysis is invaluable for industry professionals, investors, and researchers seeking to understand this dynamic market. The total market size is projected to reach xx Million by 2033.
Plant Growth Chamber Market Dynamics & Structure
The Plant Growth Chamber market is characterized by a moderately concentrated landscape with key players holding significant market share. Technological innovation, particularly in areas such as LED lighting and environmental control systems, is a major driver of growth. Regulatory frameworks concerning environmental safety and energy efficiency influence market trends. Competitive substitutes include open-field cultivation and simpler greenhouse structures, though the advantages of controlled environments drive market growth. The end-user demographic primarily comprises research institutions, universities, pharmaceutical companies, and agricultural businesses. Recent years have witnessed several mergers and acquisitions (M&A) activities, indicating market consolidation.
- Market Concentration: The top 5 players hold approximately xx% of the market share in 2025.
- Technological Innovation: Advancements in LED lighting and precise environmental control are key drivers.
- Regulatory Frameworks: Stringent environmental regulations are shaping product design and adoption.
- M&A Activity: The number of M&A deals in the past five years totaled approximately xx, leading to consolidation.
- Innovation Barriers: High R&D costs and stringent regulatory compliance requirements pose challenges for new entrants.
Plant Growth Chamber Market Growth Trends & Insights
The Plant Growth Chamber market has experienced steady growth over the historical period (2019-2024), driven by increasing demand for controlled environment agriculture and research applications. The market size was valued at xx Million in 2024 and is projected to grow at a Compound Annual Growth Rate (CAGR) of xx% during the forecast period (2025-2033), reaching xx Million by 2033. Adoption rates are significantly influenced by advancements in automation and data analytics, increasing efficiency and yield. Technological disruptions, such as the introduction of advanced sensor technologies and AI-driven systems for environmental management, are accelerating market growth. Consumer behavior shifts towards more sustainable agricultural practices also favor market expansion. The market penetration rate currently stands at xx% and is expected to reach xx% by 2033.
Dominant Regions, Countries, or Segments in Plant Growth Chamber Market
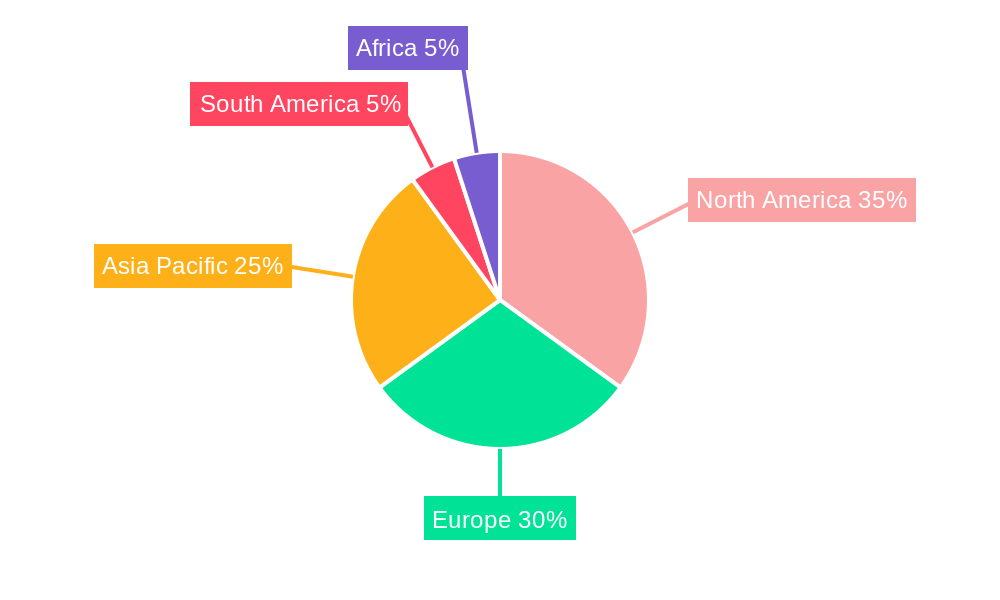
North America currently holds the largest market share in the plant growth chamber market, driven by substantial R&D investment in agricultural technology and increasing adoption of controlled environment agriculture. Europe follows closely, fueled by strong demand from research institutions and the pharmaceutical industry. Within the segments, the walk-in chamber segment holds the largest market share due to its capacity to accommodate larger-scale experiments and production needs. The application segment focused on tall plants demonstrates significant growth potential owing to increasing research activities in the development of high-yield crops. The plant growth function segment dominates the market, while seed germination and tissue culture segments are witnessing increased growth.
- Key Drivers in North America: Strong government funding for agricultural research, advanced technological infrastructure, and a thriving biotech sector.
- Key Drivers in Europe: Significant investments in research and development, stringent quality regulations supporting controlled environments, and high adoption in pharmaceutical research.
- Walk-in segment dominance: Facilitates larger scale experimentation, high-volume crop production, and robust environmental control.
- Tall Plants application growth: Rising interest in high-yield varieties and vertical farming techniques.
Plant Growth Chamber Market Product Landscape
Plant growth chambers are evolving, incorporating advanced features such as precise climate control, programmable lighting systems (including LED), automated irrigation systems, and real-time data monitoring. The latest innovations focus on energy efficiency, improved environmental uniformity, and user-friendly interfaces. Unique selling propositions include customizable chamber designs, integrated data analysis software, and remote monitoring capabilities. Recent advancements emphasize reducing energy consumption and improving the accuracy of environmental simulations.
Key Drivers, Barriers & Challenges in Plant Growth Chamber Market
Key Drivers: The growing need for year-round crop production, advancements in controlled environment agriculture (CEA) technologies, rising demand for high-quality agricultural products, and increasing investments in research and development are key drivers. Government support for agricultural research and technological advancements further fuel market growth.
Key Challenges: High initial investment costs, complexities in maintaining and operating the chambers, the potential for equipment malfunctions, and the need for skilled personnel can impede market growth. Furthermore, competition from other technologies and stringent regulatory requirements pose significant challenges.
Emerging Opportunities in Plant Growth Chamber Market
The increasing adoption of vertical farming and urban agriculture is opening up new avenues for plant growth chambers. Expansion into emerging markets with a growing agricultural sector presents lucrative opportunities. The development of smart growth chambers with AI-driven environmental control systems and remote monitoring capabilities offers considerable potential. Personalized chamber designs tailored to specific plant species and research needs also provide growth opportunities.
Growth Accelerators in the Plant Growth Chamber Market Industry
Technological advancements, such as the development of more energy-efficient lighting systems and improved environmental control technologies, are accelerating market growth. Strategic partnerships between technology providers and agricultural businesses foster innovation and market expansion. Government policies and initiatives aimed at promoting sustainable agriculture and technological advancements in the sector are further boosting market growth.
Key Players Shaping the Plant Growth Chamber Market Market
- Weiss Techni
- Darwin Chambers
- Thermo Fisher
- CARON Products & Services Inc
- Conviron
- Aralab
- Percival Scientific Inc
- Brs Bvba
- BINDER GmbH
- Hettich Benelux BV
- Saveer Biotech Limited
- Freezers India
Notable Milestones in Plant Growth Chamber Market Sector
- January 2022: Conviron launched the new EVO series of plant growth chambers, enhancing spatial uniformity and suitability for various plant heights.
- August 2021: Caron's acquisition of Bigneat broadened its product portfolio in laboratory equipment.
- May 2021: The merger of Weiss Umwelttechnik GmbH and Vötsch Industrietechnik GmbH strengthened their presence in environmental simulation.
In-Depth Plant Growth Chamber Market Market Outlook
The Plant Growth Chamber market is poised for continued growth, driven by technological advancements, increasing demand for controlled environment agriculture, and expansion into new markets. Strategic partnerships, product diversification, and focus on energy efficiency will be key factors shaping market dynamics. The market presents significant opportunities for companies to innovate and capture market share in this expanding sector.
Plant Growth Chamber Market Segmentation
- 1. Production Analysis
- 2. Consumption Analysis
- 3. Import Market Analysis (Value & Volume)
- 4. Export Market Analysis (Value & Volume)
- 5. Price Trend Analysis
Plant Growth Chamber Market Segmentation By Geography
-
1. North America
- 1.1. United States
- 1.2. Canada
- 1.3. Mexico
-
2. South America
- 2.1. Brazil
- 2.2. Argentina
- 2.3. Rest of South America
-
3. Europe
- 3.1. United Kingdom
- 3.2. Germany
- 3.3. France
- 3.4. Italy
- 3.5. Spain
- 3.6. Russia
- 3.7. Benelux
- 3.8. Nordics
- 3.9. Rest of Europe
-
4. Middle East & Africa
- 4.1. Turkey
- 4.2. Israel
- 4.3. GCC
- 4.4. North Africa
- 4.5. South Africa
- 4.6. Rest of Middle East & Africa
-
5. Asia Pacific
- 5.1. China
- 5.2. India
- 5.3. Japan
- 5.4. South Korea
- 5.5. ASEAN
- 5.6. Oceania
- 5.7. Rest of Asia Pacific
Plant Growth Chamber Market Regional Market Share
Geographic Coverage of Plant Growth Chamber Market
Plant Growth Chamber Market REPORT HIGHLIGHTS
| Aspects | Details |
|---|---|
| Study Period | 2020-2034 |
| Base Year | 2025 |
| Estimated Year | 2026 |
| Forecast Period | 2026-2034 |
| Historical Period | 2020-2025 |
| Growth Rate | CAGR of 4.70% from 2020-2034 |
| Segmentation |
|
Table of Contents
- 1. Introduction
- 1.1. Research Scope
- 1.2. Market Segmentation
- 1.3. Research Objective
- 1.4. Definitions and Assumptions
- 2. Executive Summary
- 2.1. Market Snapshot
- 3. Market Dynamics
- 3.1. Market Drivers
- 3.2. Market Restrains
- 3.3. Market Trends
- 3.4. Market Opportunities
- 4. Market Factor Analysis
- 4.1. Porters Five Forces
- 4.1.1. Bargaining Power of Suppliers
- 4.1.2. Bargaining Power of Buyers
- 4.1.3. Threat of New Entrants
- 4.1.4. Threat of Substitutes
- 4.1.5. Competitive Rivalry
- 4.2. PESTEL analysis
- 4.3. BCG Analysis
- 4.3.1. Stars (High Growth, High Market Share)
- 4.3.2. Cash Cows (Low Growth, High Market Share)
- 4.3.3. Question Mark (High Growth, Low Market Share)
- 4.3.4. Dogs (Low Growth, Low Market Share)
- 4.4. Ansoff Matrix Analysis
- 4.5. Supply Chain Analysis
- 4.6. Regulatory Landscape
- 4.7. Current Market Potential and Opportunity Assessment (TAM–SAM–SOM Framework)
- 4.8. NRP Analyst Note
- 4.1. Porters Five Forces
- 5. Market Analysis, Insights and Forecast 2021-2033
- 5.1. Market Analysis, Insights and Forecast - by Production Analysis
- 5.2. Market Analysis, Insights and Forecast - by Consumption Analysis
- 5.3. Market Analysis, Insights and Forecast - by Import Market Analysis (Value & Volume)
- 5.4. Market Analysis, Insights and Forecast - by Export Market Analysis (Value & Volume)
- 5.5. Market Analysis, Insights and Forecast - by Price Trend Analysis
- 5.6. Market Analysis, Insights and Forecast - by Region
- 5.6.1. North America
- 5.6.2. South America
- 5.6.3. Europe
- 5.6.4. Middle East & Africa
- 5.6.5. Asia Pacific
- 6. Global Plant Growth Chamber Market Analysis, Insights and Forecast, 2021-2033
- 6.1. Market Analysis, Insights and Forecast - by Production Analysis
- 6.2. Market Analysis, Insights and Forecast - by Consumption Analysis
- 6.3. Market Analysis, Insights and Forecast - by Import Market Analysis (Value & Volume)
- 6.4. Market Analysis, Insights and Forecast - by Export Market Analysis (Value & Volume)
- 6.5. Market Analysis, Insights and Forecast - by Price Trend Analysis
- 7. North America Plant Growth Chamber Market Analysis, Insights and Forecast, 2020-2032
- 7.1. Market Analysis, Insights and Forecast - by Production Analysis
- 7.2. Market Analysis, Insights and Forecast - by Consumption Analysis
- 7.3. Market Analysis, Insights and Forecast - by Import Market Analysis (Value & Volume)
- 7.4. Market Analysis, Insights and Forecast - by Export Market Analysis (Value & Volume)
- 7.5. Market Analysis, Insights and Forecast - by Price Trend Analysis
- 8. South America Plant Growth Chamber Market Analysis, Insights and Forecast, 2020-2032
- 8.1. Market Analysis, Insights and Forecast - by Production Analysis
- 8.2. Market Analysis, Insights and Forecast - by Consumption Analysis
- 8.3. Market Analysis, Insights and Forecast - by Import Market Analysis (Value & Volume)
- 8.4. Market Analysis, Insights and Forecast - by Export Market Analysis (Value & Volume)
- 8.5. Market Analysis, Insights and Forecast - by Price Trend Analysis
- 9. Europe Plant Growth Chamber Market Analysis, Insights and Forecast, 2020-2032
- 9.1. Market Analysis, Insights and Forecast - by Production Analysis
- 9.2. Market Analysis, Insights and Forecast - by Consumption Analysis
- 9.3. Market Analysis, Insights and Forecast - by Import Market Analysis (Value & Volume)
- 9.4. Market Analysis, Insights and Forecast - by Export Market Analysis (Value & Volume)
- 9.5. Market Analysis, Insights and Forecast - by Price Trend Analysis
- 10. Middle East & Africa Plant Growth Chamber Market Analysis, Insights and Forecast, 2020-2032
- 10.1. Market Analysis, Insights and Forecast - by Production Analysis
- 10.2. Market Analysis, Insights and Forecast - by Consumption Analysis
- 10.3. Market Analysis, Insights and Forecast - by Import Market Analysis (Value & Volume)
- 10.4. Market Analysis, Insights and Forecast - by Export Market Analysis (Value & Volume)
- 10.5. Market Analysis, Insights and Forecast - by Price Trend Analysis
- 11. Asia Pacific Plant Growth Chamber Market Analysis, Insights and Forecast, 2020-2032
- 11.1. Market Analysis, Insights and Forecast - by Production Analysis
- 11.2. Market Analysis, Insights and Forecast - by Consumption Analysis
- 11.3. Market Analysis, Insights and Forecast - by Import Market Analysis (Value & Volume)
- 11.4. Market Analysis, Insights and Forecast - by Export Market Analysis (Value & Volume)
- 11.5. Market Analysis, Insights and Forecast - by Price Trend Analysis
- 12. Competitive Analysis
- 12.1. Company Profiles
- 12.1.1 Weiss Techni
- 12.1.1.1. Company Overview
- 12.1.1.2. Products
- 12.1.1.3. Company Financials
- 12.1.1.4. SWOT Analysis
- 12.1.2 Darwin Chambers
- 12.1.2.1. Company Overview
- 12.1.2.2. Products
- 12.1.2.3. Company Financials
- 12.1.2.4. SWOT Analysis
- 12.1.3 Thermo Fisher
- 12.1.3.1. Company Overview
- 12.1.3.2. Products
- 12.1.3.3. Company Financials
- 12.1.3.4. SWOT Analysis
- 12.1.4 CARON Products & Services Inc
- 12.1.4.1. Company Overview
- 12.1.4.2. Products
- 12.1.4.3. Company Financials
- 12.1.4.4. SWOT Analysis
- 12.1.5 Conviron
- 12.1.5.1. Company Overview
- 12.1.5.2. Products
- 12.1.5.3. Company Financials
- 12.1.5.4. SWOT Analysis
- 12.1.6 Aralab
- 12.1.6.1. Company Overview
- 12.1.6.2. Products
- 12.1.6.3. Company Financials
- 12.1.6.4. SWOT Analysis
- 12.1.7 Percival Scientific Inc
- 12.1.7.1. Company Overview
- 12.1.7.2. Products
- 12.1.7.3. Company Financials
- 12.1.7.4. SWOT Analysis
- 12.1.8 Brs Bvba
- 12.1.8.1. Company Overview
- 12.1.8.2. Products
- 12.1.8.3. Company Financials
- 12.1.8.4. SWOT Analysis
- 12.1.9 BINDER GmbH
- 12.1.9.1. Company Overview
- 12.1.9.2. Products
- 12.1.9.3. Company Financials
- 12.1.9.4. SWOT Analysis
- 12.1.10 Hettich Benelux BV
- 12.1.10.1. Company Overview
- 12.1.10.2. Products
- 12.1.10.3. Company Financials
- 12.1.10.4. SWOT Analysis
- 12.1.11 Saveer Biotech Limited
- 12.1.11.1. Company Overview
- 12.1.11.2. Products
- 12.1.11.3. Company Financials
- 12.1.11.4. SWOT Analysis
- 12.1.12 Freezers India
- 12.1.12.1. Company Overview
- 12.1.12.2. Products
- 12.1.12.3. Company Financials
- 12.1.12.4. SWOT Analysis
- 12.1.1 Weiss Techni
- 12.2. Market Entropy
- 12.2.1 Company's Key Areas Served
- 12.2.2 Recent Developments
- 12.3. Company Market Share Analysis 2025
- 12.3.1 Top 5 Companies Market Share Analysis
- 12.3.2 Top 3 Companies Market Share Analysis
- 12.4. List of Potential Customers
- 13. Research Methodology
List of Figures
- Figure 1: Global Plant Growth Chamber Market Revenue Breakdown (Million, %) by Region 2025 & 2033
- Figure 2: North America Plant Growth Chamber Market Revenue (Million), by Production Analysis 2025 & 2033
- Figure 3: North America Plant Growth Chamber Market Revenue Share (%), by Production Analysis 2025 & 2033
- Figure 4: North America Plant Growth Chamber Market Revenue (Million), by Consumption Analysis 2025 & 2033
- Figure 5: North America Plant Growth Chamber Market Revenue Share (%), by Consumption Analysis 2025 & 2033
- Figure 6: North America Plant Growth Chamber Market Revenue (Million), by Import Market Analysis (Value & Volume) 2025 & 2033
- Figure 7: North America Plant Growth Chamber Market Revenue Share (%), by Import Market Analysis (Value & Volume) 2025 & 2033
- Figure 8: North America Plant Growth Chamber Market Revenue (Million), by Export Market Analysis (Value & Volume) 2025 & 2033
- Figure 9: North America Plant Growth Chamber Market Revenue Share (%), by Export Market Analysis (Value & Volume) 2025 & 2033
- Figure 10: North America Plant Growth Chamber Market Revenue (Million), by Price Trend Analysis 2025 & 2033
- Figure 11: North America Plant Growth Chamber Market Revenue Share (%), by Price Trend Analysis 2025 & 2033
- Figure 12: North America Plant Growth Chamber Market Revenue (Million), by Country 2025 & 2033
- Figure 13: North America Plant Growth Chamber Market Revenue Share (%), by Country 2025 & 2033
- Figure 14: South America Plant Growth Chamber Market Revenue (Million), by Production Analysis 2025 & 2033
- Figure 15: South America Plant Growth Chamber Market Revenue Share (%), by Production Analysis 2025 & 2033
- Figure 16: South America Plant Growth Chamber Market Revenue (Million), by Consumption Analysis 2025 & 2033
- Figure 17: South America Plant Growth Chamber Market Revenue Share (%), by Consumption Analysis 2025 & 2033
- Figure 18: South America Plant Growth Chamber Market Revenue (Million), by Import Market Analysis (Value & Volume) 2025 & 2033
- Figure 19: South America Plant Growth Chamber Market Revenue Share (%), by Import Market Analysis (Value & Volume) 2025 & 2033
- Figure 20: South America Plant Growth Chamber Market Revenue (Million), by Export Market Analysis (Value & Volume) 2025 & 2033
- Figure 21: South America Plant Growth Chamber Market Revenue Share (%), by Export Market Analysis (Value & Volume) 2025 & 2033
- Figure 22: South America Plant Growth Chamber Market Revenue (Million), by Price Trend Analysis 2025 & 2033
- Figure 23: South America Plant Growth Chamber Market Revenue Share (%), by Price Trend Analysis 2025 & 2033
- Figure 24: South America Plant Growth Chamber Market Revenue (Million), by Country 2025 & 2033
- Figure 25: South America Plant Growth Chamber Market Revenue Share (%), by Country 2025 & 2033
- Figure 26: Europe Plant Growth Chamber Market Revenue (Million), by Production Analysis 2025 & 2033
- Figure 27: Europe Plant Growth Chamber Market Revenue Share (%), by Production Analysis 2025 & 2033
- Figure 28: Europe Plant Growth Chamber Market Revenue (Million), by Consumption Analysis 2025 & 2033
- Figure 29: Europe Plant Growth Chamber Market Revenue Share (%), by Consumption Analysis 2025 & 2033
- Figure 30: Europe Plant Growth Chamber Market Revenue (Million), by Import Market Analysis (Value & Volume) 2025 & 2033
- Figure 31: Europe Plant Growth Chamber Market Revenue Share (%), by Import Market Analysis (Value & Volume) 2025 & 2033
- Figure 32: Europe Plant Growth Chamber Market Revenue (Million), by Export Market Analysis (Value & Volume) 2025 & 2033
- Figure 33: Europe Plant Growth Chamber Market Revenue Share (%), by Export Market Analysis (Value & Volume) 2025 & 2033
- Figure 34: Europe Plant Growth Chamber Market Revenue (Million), by Price Trend Analysis 2025 & 2033
- Figure 35: Europe Plant Growth Chamber Market Revenue Share (%), by Price Trend Analysis 2025 & 2033
- Figure 36: Europe Plant Growth Chamber Market Revenue (Million), by Country 2025 & 2033
- Figure 37: Europe Plant Growth Chamber Market Revenue Share (%), by Country 2025 & 2033
- Figure 38: Middle East & Africa Plant Growth Chamber Market Revenue (Million), by Production Analysis 2025 & 2033
- Figure 39: Middle East & Africa Plant Growth Chamber Market Revenue Share (%), by Production Analysis 2025 & 2033
- Figure 40: Middle East & Africa Plant Growth Chamber Market Revenue (Million), by Consumption Analysis 2025 & 2033
- Figure 41: Middle East & Africa Plant Growth Chamber Market Revenue Share (%), by Consumption Analysis 2025 & 2033
- Figure 42: Middle East & Africa Plant Growth Chamber Market Revenue (Million), by Import Market Analysis (Value & Volume) 2025 & 2033
- Figure 43: Middle East & Africa Plant Growth Chamber Market Revenue Share (%), by Import Market Analysis (Value & Volume) 2025 & 2033
- Figure 44: Middle East & Africa Plant Growth Chamber Market Revenue (Million), by Export Market Analysis (Value & Volume) 2025 & 2033
- Figure 45: Middle East & Africa Plant Growth Chamber Market Revenue Share (%), by Export Market Analysis (Value & Volume) 2025 & 2033
- Figure 46: Middle East & Africa Plant Growth Chamber Market Revenue (Million), by Price Trend Analysis 2025 & 2033
- Figure 47: Middle East & Africa Plant Growth Chamber Market Revenue Share (%), by Price Trend Analysis 2025 & 2033
- Figure 48: Middle East & Africa Plant Growth Chamber Market Revenue (Million), by Country 2025 & 2033
- Figure 49: Middle East & Africa Plant Growth Chamber Market Revenue Share (%), by Country 2025 & 2033
- Figure 50: Asia Pacific Plant Growth Chamber Market Revenue (Million), by Production Analysis 2025 & 2033
- Figure 51: Asia Pacific Plant Growth Chamber Market Revenue Share (%), by Production Analysis 2025 & 2033
- Figure 52: Asia Pacific Plant Growth Chamber Market Revenue (Million), by Consumption Analysis 2025 & 2033
- Figure 53: Asia Pacific Plant Growth Chamber Market Revenue Share (%), by Consumption Analysis 2025 & 2033
- Figure 54: Asia Pacific Plant Growth Chamber Market Revenue (Million), by Import Market Analysis (Value & Volume) 2025 & 2033
- Figure 55: Asia Pacific Plant Growth Chamber Market Revenue Share (%), by Import Market Analysis (Value & Volume) 2025 & 2033
- Figure 56: Asia Pacific Plant Growth Chamber Market Revenue (Million), by Export Market Analysis (Value & Volume) 2025 & 2033
- Figure 57: Asia Pacific Plant Growth Chamber Market Revenue Share (%), by Export Market Analysis (Value & Volume) 2025 & 2033
- Figure 58: Asia Pacific Plant Growth Chamber Market Revenue (Million), by Price Trend Analysis 2025 & 2033
- Figure 59: Asia Pacific Plant Growth Chamber Market Revenue Share (%), by Price Trend Analysis 2025 & 2033
- Figure 60: Asia Pacific Plant Growth Chamber Market Revenue (Million), by Country 2025 & 2033
- Figure 61: Asia Pacific Plant Growth Chamber Market Revenue Share (%), by Country 2025 & 2033
List of Tables
- Table 1: Global Plant Growth Chamber Market Revenue Million Forecast, by Production Analysis 2020 & 2033
- Table 2: Global Plant Growth Chamber Market Revenue Million Forecast, by Consumption Analysis 2020 & 2033
- Table 3: Global Plant Growth Chamber Market Revenue Million Forecast, by Import Market Analysis (Value & Volume) 2020 & 2033
- Table 4: Global Plant Growth Chamber Market Revenue Million Forecast, by Export Market Analysis (Value & Volume) 2020 & 2033
- Table 5: Global Plant Growth Chamber Market Revenue Million Forecast, by Price Trend Analysis 2020 & 2033
- Table 6: Global Plant Growth Chamber Market Revenue Million Forecast, by Region 2020 & 2033
- Table 7: Global Plant Growth Chamber Market Revenue Million Forecast, by Production Analysis 2020 & 2033
- Table 8: Global Plant Growth Chamber Market Revenue Million Forecast, by Consumption Analysis 2020 & 2033
- Table 9: Global Plant Growth Chamber Market Revenue Million Forecast, by Import Market Analysis (Value & Volume) 2020 & 2033
- Table 10: Global Plant Growth Chamber Market Revenue Million Forecast, by Export Market Analysis (Value & Volume) 2020 & 2033
- Table 11: Global Plant Growth Chamber Market Revenue Million Forecast, by Price Trend Analysis 2020 & 2033
- Table 12: Global Plant Growth Chamber Market Revenue Million Forecast, by Country 2020 & 2033
- Table 13: United States Plant Growth Chamber Market Revenue (Million) Forecast, by Application 2020 & 2033
- Table 14: Canada Plant Growth Chamber Market Revenue (Million) Forecast, by Application 2020 & 2033
- Table 15: Mexico Plant Growth Chamber Market Revenue (Million) Forecast, by Application 2020 & 2033
- Table 16: Global Plant Growth Chamber Market Revenue Million Forecast, by Production Analysis 2020 & 2033
- Table 17: Global Plant Growth Chamber Market Revenue Million Forecast, by Consumption Analysis 2020 & 2033
- Table 18: Global Plant Growth Chamber Market Revenue Million Forecast, by Import Market Analysis (Value & Volume) 2020 & 2033
- Table 19: Global Plant Growth Chamber Market Revenue Million Forecast, by Export Market Analysis (Value & Volume) 2020 & 2033
- Table 20: Global Plant Growth Chamber Market Revenue Million Forecast, by Price Trend Analysis 2020 & 2033
- Table 21: Global Plant Growth Chamber Market Revenue Million Forecast, by Country 2020 & 2033
- Table 22: Brazil Plant Growth Chamber Market Revenue (Million) Forecast, by Application 2020 & 2033
- Table 23: Argentina Plant Growth Chamber Market Revenue (Million) Forecast, by Application 2020 & 2033
- Table 24: Rest of South America Plant Growth Chamber Market Revenue (Million) Forecast, by Application 2020 & 2033
- Table 25: Global Plant Growth Chamber Market Revenue Million Forecast, by Production Analysis 2020 & 2033
- Table 26: Global Plant Growth Chamber Market Revenue Million Forecast, by Consumption Analysis 2020 & 2033
- Table 27: Global Plant Growth Chamber Market Revenue Million Forecast, by Import Market Analysis (Value & Volume) 2020 & 2033
- Table 28: Global Plant Growth Chamber Market Revenue Million Forecast, by Export Market Analysis (Value & Volume) 2020 & 2033
- Table 29: Global Plant Growth Chamber Market Revenue Million Forecast, by Price Trend Analysis 2020 & 2033
- Table 30: Global Plant Growth Chamber Market Revenue Million Forecast, by Country 2020 & 2033
- Table 31: United Kingdom Plant Growth Chamber Market Revenue (Million) Forecast, by Application 2020 & 2033
- Table 32: Germany Plant Growth Chamber Market Revenue (Million) Forecast, by Application 2020 & 2033
- Table 33: France Plant Growth Chamber Market Revenue (Million) Forecast, by Application 2020 & 2033
- Table 34: Italy Plant Growth Chamber Market Revenue (Million) Forecast, by Application 2020 & 2033
- Table 35: Spain Plant Growth Chamber Market Revenue (Million) Forecast, by Application 2020 & 2033
- Table 36: Russia Plant Growth Chamber Market Revenue (Million) Forecast, by Application 2020 & 2033
- Table 37: Benelux Plant Growth Chamber Market Revenue (Million) Forecast, by Application 2020 & 2033
- Table 38: Nordics Plant Growth Chamber Market Revenue (Million) Forecast, by Application 2020 & 2033
- Table 39: Rest of Europe Plant Growth Chamber Market Revenue (Million) Forecast, by Application 2020 & 2033
- Table 40: Global Plant Growth Chamber Market Revenue Million Forecast, by Production Analysis 2020 & 2033
- Table 41: Global Plant Growth Chamber Market Revenue Million Forecast, by Consumption Analysis 2020 & 2033
- Table 42: Global Plant Growth Chamber Market Revenue Million Forecast, by Import Market Analysis (Value & Volume) 2020 & 2033
- Table 43: Global Plant Growth Chamber Market Revenue Million Forecast, by Export Market Analysis (Value & Volume) 2020 & 2033
- Table 44: Global Plant Growth Chamber Market Revenue Million Forecast, by Price Trend Analysis 2020 & 2033
- Table 45: Global Plant Growth Chamber Market Revenue Million Forecast, by Country 2020 & 2033
- Table 46: Turkey Plant Growth Chamber Market Revenue (Million) Forecast, by Application 2020 & 2033
- Table 47: Israel Plant Growth Chamber Market Revenue (Million) Forecast, by Application 2020 & 2033
- Table 48: GCC Plant Growth Chamber Market Revenue (Million) Forecast, by Application 2020 & 2033
- Table 49: North Africa Plant Growth Chamber Market Revenue (Million) Forecast, by Application 2020 & 2033
- Table 50: South Africa Plant Growth Chamber Market Revenue (Million) Forecast, by Application 2020 & 2033
- Table 51: Rest of Middle East & Africa Plant Growth Chamber Market Revenue (Million) Forecast, by Application 2020 & 2033
- Table 52: Global Plant Growth Chamber Market Revenue Million Forecast, by Production Analysis 2020 & 2033
- Table 53: Global Plant Growth Chamber Market Revenue Million Forecast, by Consumption Analysis 2020 & 2033
- Table 54: Global Plant Growth Chamber Market Revenue Million Forecast, by Import Market Analysis (Value & Volume) 2020 & 2033
- Table 55: Global Plant Growth Chamber Market Revenue Million Forecast, by Export Market Analysis (Value & Volume) 2020 & 2033
- Table 56: Global Plant Growth Chamber Market Revenue Million Forecast, by Price Trend Analysis 2020 & 2033
- Table 57: Global Plant Growth Chamber Market Revenue Million Forecast, by Country 2020 & 2033
- Table 58: China Plant Growth Chamber Market Revenue (Million) Forecast, by Application 2020 & 2033
- Table 59: India Plant Growth Chamber Market Revenue (Million) Forecast, by Application 2020 & 2033
- Table 60: Japan Plant Growth Chamber Market Revenue (Million) Forecast, by Application 2020 & 2033
- Table 61: South Korea Plant Growth Chamber Market Revenue (Million) Forecast, by Application 2020 & 2033
- Table 62: ASEAN Plant Growth Chamber Market Revenue (Million) Forecast, by Application 2020 & 2033
- Table 63: Oceania Plant Growth Chamber Market Revenue (Million) Forecast, by Application 2020 & 2033
- Table 64: Rest of Asia Pacific Plant Growth Chamber Market Revenue (Million) Forecast, by Application 2020 & 2033
Frequently Asked Questions
1. What is the projected Compound Annual Growth Rate (CAGR) of the Plant Growth Chamber Market?
The projected CAGR is approximately 4.70%.
2. Which companies are prominent players in the Plant Growth Chamber Market?
Key companies in the market include Weiss Techni, Darwin Chambers, Thermo Fisher, CARON Products & Services Inc, Conviron, Aralab, Percival Scientific Inc, Brs Bvba, BINDER GmbH, Hettich Benelux BV, Saveer Biotech Limited, Freezers India.
3. What are the main segments of the Plant Growth Chamber Market?
The market segments include Production Analysis, Consumption Analysis, Import Market Analysis (Value & Volume), Export Market Analysis (Value & Volume), Price Trend Analysis.
4. Can you provide details about the market size?
The market size is estimated to be USD 486.60 Million as of 2022.
5. What are some drivers contributing to market growth?
Seed Treatment As A Solution To Enhance Yield; Growing Awareness For Seed Treatment Among The Farmers; Rising Trend Of Organic Farming.
6. What are the notable trends driving market growth?
Increasing Demand for Food and Decreasing Arable Land.
7. Are there any restraints impacting market growth?
Limitations Across Farm-Level Seed Treatment; Rising Environmental Concerns.
8. Can you provide examples of recent developments in the market?
January 2022: Conviron launched a new EVO series of plant growth chambers, featuring a range of LE intensities, delivering a high degree of spatial uniformity for plant growth suitable for both short, medium, and tall plants.
9. What pricing options are available for accessing the report?
Pricing options include single-user, multi-user, and enterprise licenses priced at USD 4750, USD 5250, and USD 8750 respectively.
10. Is the market size provided in terms of value or volume?
The market size is provided in terms of value, measured in Million.
11. Are there any specific market keywords associated with the report?
Yes, the market keyword associated with the report is "Plant Growth Chamber Market," which aids in identifying and referencing the specific market segment covered.
12. How do I determine which pricing option suits my needs best?
The pricing options vary based on user requirements and access needs. Individual users may opt for single-user licenses, while businesses requiring broader access may choose multi-user or enterprise licenses for cost-effective access to the report.
13. Are there any additional resources or data provided in the Plant Growth Chamber Market report?
While the report offers comprehensive insights, it's advisable to review the specific contents or supplementary materials provided to ascertain if additional resources or data are available.
14. How can I stay updated on further developments or reports in the Plant Growth Chamber Market?
To stay informed about further developments, trends, and reports in the Plant Growth Chamber Market, consider subscribing to industry newsletters, following relevant companies and organizations, or regularly checking reputable industry news sources and publications.
Methodology
Step 1 - Identification of Relevant Samples Size from Population Database


Step 2 - Approaches for Defining Global Market Size (Value, Volume* & Price*)

Note*: In applicable scenarios
Step 3 - Data Sources
Primary Research
- Web Analytics
- Survey Reports
- Research Institute
- Latest Research Reports
- Opinion Leaders
Secondary Research
- Annual Reports
- White Paper
- Latest Press Release
- Industry Association
- Paid Database
- Investor Presentations

Step 4 - Data Triangulation
Involves using different sources of information in order to increase the validity of a study
These sources are likely to be stakeholders in a program - participants, other researchers, program staff, other community members, and so on.
Then we put all data in single framework & apply various statistical tools to find out the dynamic on the market.
During the analysis stage, feedback from the stakeholder groups would be compared to determine areas of agreement as well as areas of divergence