

Key Insights
The process manufacturing software market is experiencing robust growth, driven by increasing demand for automation, improved efficiency, and enhanced data analytics capabilities within the manufacturing sector. The market's expansion is fueled by the adoption of Industry 4.0 technologies, including cloud-based solutions and the Internet of Things (IoT), enabling real-time monitoring and control of production processes. Companies across various process manufacturing industries, such as food and beverage, pharmaceuticals, and chemicals, are increasingly investing in sophisticated software solutions to optimize their operations, reduce production costs, and improve product quality. This trend is further amplified by the growing need for regulatory compliance and traceability throughout the supply chain. The competitive landscape is characterized by both established players and emerging niche providers, leading to innovation and a diverse range of software solutions catering to specific industry needs and business scales. The market shows a strong inclination towards cloud-based deployments due to their scalability, accessibility, and cost-effectiveness.
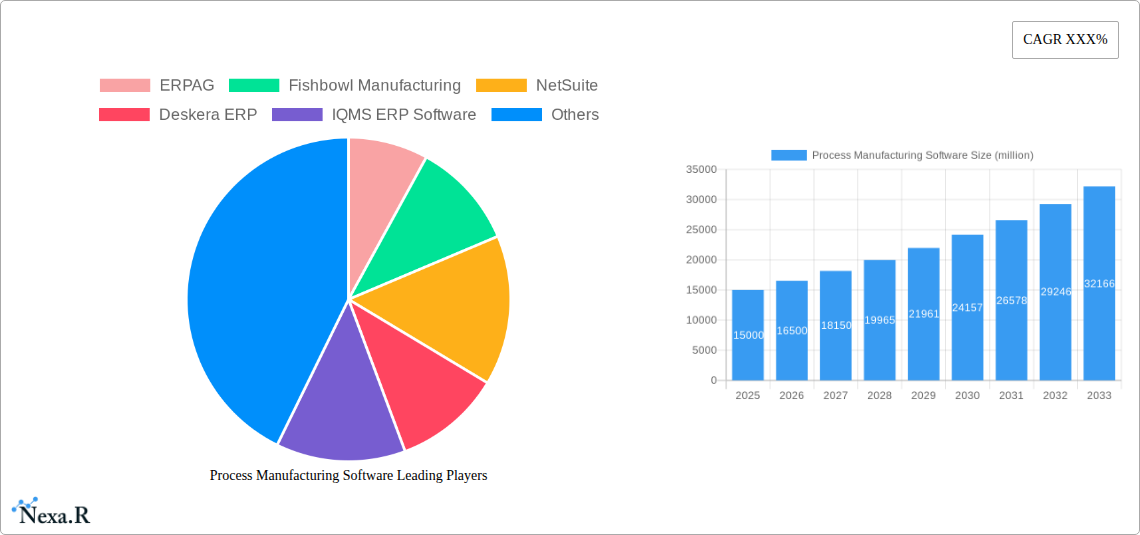
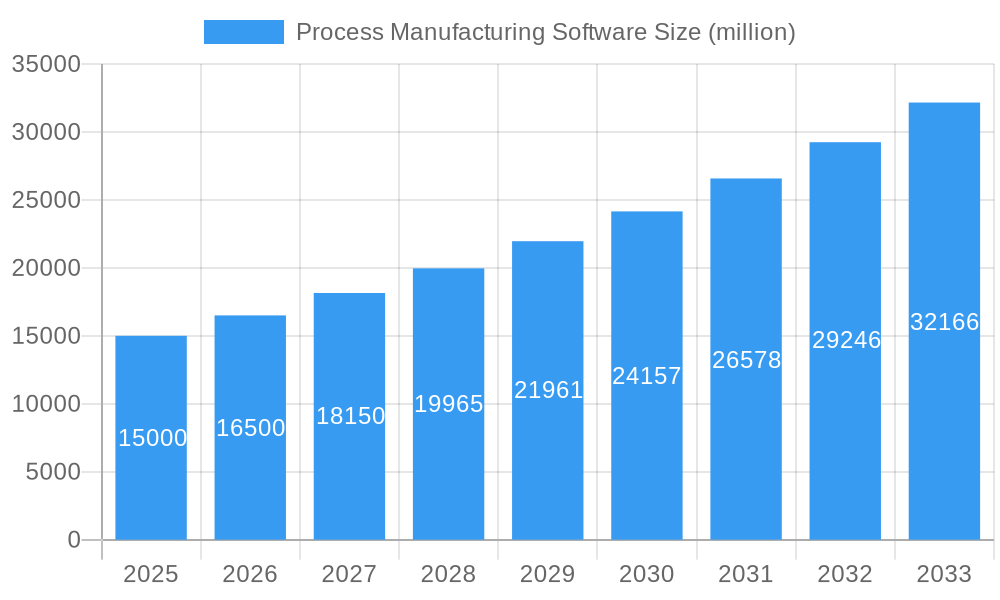
Process Manufacturing Software Market Size (In Billion)
Looking ahead, the market is projected to maintain a healthy Compound Annual Growth Rate (CAGR), propelled by continued technological advancements and the rising adoption of advanced analytics for predictive maintenance and process optimization. The integration of artificial intelligence (AI) and machine learning (ML) is expected to further revolutionize process manufacturing, enabling intelligent automation and improved decision-making. However, challenges remain, including the complexity of implementing new software systems, the need for skilled personnel to manage these technologies, and the potential for high initial investment costs. Nevertheless, the long-term benefits of improved efficiency, reduced waste, and enhanced product quality outweigh these challenges, resulting in a positive outlook for the process manufacturing software market.
Process Manufacturing Software Company Market Share
Process Manufacturing Software Market Report: 2019-2033
This comprehensive report provides a detailed analysis of the Process Manufacturing Software market, encompassing market dynamics, growth trends, regional dominance, product landscape, key players, and future outlook. The study period covers 2019-2033, with a base year of 2025 and a forecast period of 2025-2033. The report leverages extensive research and data analysis to deliver actionable insights for industry professionals, investors, and strategic decision-makers. The market size in 2025 is estimated to be at xx million units.
Process Manufacturing Software Market Dynamics & Structure
The process manufacturing software market is characterized by moderate concentration, with a few major players holding significant market share, alongside numerous niche players catering to specific industry segments. Technological innovation, particularly in areas like AI, cloud computing, and IoT, is a key driver, alongside increasing regulatory pressure for enhanced data management and compliance. Competitive product substitutes, primarily legacy systems and customized solutions, exist but are gradually losing ground to the benefits offered by comprehensive software packages. The market is witnessing a rise in mergers and acquisitions (M&A) activity, with approximately xx M&A deals recorded between 2019 and 2024, indicating a trend towards consolidation. End-user demographics span across various process industries, including food and beverage, pharmaceuticals, chemicals, and cosmetics.
- Market Concentration: Moderately concentrated, with top 5 players holding xx% market share in 2025.
- Technological Innovation: AI, cloud, IoT driving significant advancements in process optimization and data analytics.
- Regulatory Frameworks: Compliance requirements (e.g., FDA, GMP) are pushing adoption of advanced software solutions.
- Competitive Substitutes: Legacy systems and custom solutions face challenges from integrated software offerings.
- End-User Demographics: Diverse, encompassing food & beverage, pharmaceuticals, chemicals, and other process industries.
- M&A Trends: xx M&A deals from 2019-2024, indicating consolidation and expansion strategies.
Process Manufacturing Software Growth Trends & Insights
The process manufacturing software market exhibits a robust growth trajectory, driven by factors such as increasing demand for automation, improved efficiency, and better data-driven decision-making. The market size is projected to reach xx million units by 2033, registering a CAGR of xx% during the forecast period. This growth is fueled by the rising adoption rate among SMEs and large enterprises across various industries. Technological disruptions, such as the rise of cloud-based solutions and the integration of AI, are further accelerating market expansion. A shift in consumer behavior towards personalized products and increased demand for supply chain transparency is also impacting software adoption patterns.
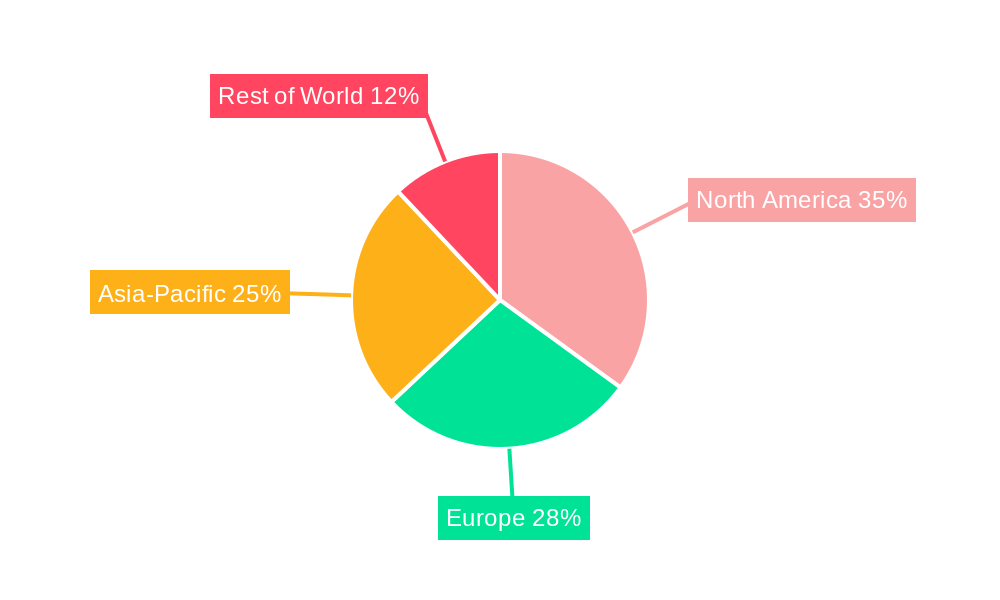
Dominant Regions, Countries, or Segments in Process Manufacturing Software
North America currently holds the leading position in the process manufacturing software market, driven by factors such as high technological advancement, robust infrastructure, and a large number of early adopters in the industry. Europe follows closely, showing strong growth potential. Key drivers include stringent regulatory frameworks, coupled with increasing investments in digital transformation initiatives. The pharmaceutical segment is a dominant growth driver globally, followed by the food & beverage sector.
- North America: High technological maturity, robust infrastructure, early adoption of advanced technologies.
- Europe: Stringent regulations, investment in digital transformation, growing demand for efficiency.
- Asia-Pacific: Rapid industrialization, expanding manufacturing base, increasing adoption among SMEs.
- Pharmaceutical Segment: Stringent regulatory compliance drives demand for sophisticated software.
- Food & Beverage Segment: Growing focus on food safety, traceability, and supply chain optimization.
Process Manufacturing Software Product Landscape
The process manufacturing software market offers a range of solutions, from basic ERP systems to highly specialized software for specific processes, such as batch management, quality control, and supply chain optimization. Products are increasingly integrating advanced analytics, AI-powered insights, and cloud-based deployment models to enhance user experience and deliver better value. Unique selling propositions often center around ease of use, integration capabilities, and specific industry expertise. Technological advancements such as real-time data visualization, predictive maintenance capabilities and improved cybersecurity features are key differentiators.
Key Drivers, Barriers & Challenges in Process Manufacturing Software
Key Drivers:
- Increasing automation needs across industries.
- Demand for improved operational efficiency and cost reduction.
- Growing emphasis on data-driven decision-making and process optimization.
- Stringent regulatory compliance mandates.
Key Barriers & Challenges:
- High initial investment costs and implementation complexity.
- Integration challenges with existing legacy systems.
- Lack of skilled IT personnel to manage and maintain the software.
- Cybersecurity risks and data privacy concerns. The average cost of a data breach is estimated at xx million USD, impacting adoption.
Emerging Opportunities in Process Manufacturing Software
- Expansion into untapped markets (e.g., developing economies).
- Development of specialized solutions for niche industries.
- Integration of advanced technologies like blockchain for supply chain traceability.
- Focus on user-friendly interfaces and mobile accessibility.
Growth Accelerators in the Process Manufacturing Software Industry
Technological breakthroughs in AI and machine learning are set to significantly accelerate market growth by enabling more accurate predictions and optimized resource allocation. Strategic partnerships between software vendors and industry players are also creating synergistic opportunities. The expansion of cloud-based deployment models enhances accessibility and scalability, leading to broader market penetration.
Key Players Shaping the Process Manufacturing Software Market
- ERPAG
- Fishbowl Manufacturing
- NetSuite
- Deskera ERP
- IQMS ERP Software
- Sage 100cloud
- Vicinity Manufacturing
- Intellect eQMS
- QuickBooks Enterprise
- SYSPRO
- BatchMaster ERP
- Datacor Chempax
- Odoo
- Sage Business Cloud Enterprise Management
- Royal 4 Enterprise
- Columbus Manufacturing
- Prodsmart
- Geneva Business Management Systems (GBMS)
- Fulcrum
- Process Force
Notable Milestones in Process Manufacturing Software Sector
- 2020: Increased adoption of cloud-based solutions due to the pandemic.
- 2021: Several significant M&A deals reshaping the market landscape.
- 2022: Launch of AI-powered process optimization tools.
- 2023: Growing focus on cybersecurity and data privacy features.
- 2024: Introduction of new industry-specific software modules.
In-Depth Process Manufacturing Software Market Outlook
The process manufacturing software market is poised for sustained growth, driven by the continuous need for operational efficiency, enhanced data management, and compliance with evolving regulatory standards. The convergence of advanced technologies like AI, IoT, and cloud computing will foster innovation and create new opportunities for market expansion. Strategic partnerships and investments in research and development will play a crucial role in shaping the future of this dynamic market. The market is expected to reach xx million units by 2033.
Process Manufacturing Software Segmentation
-
1. Application
- 1.1. Large Enterprises
- 1.2. SMEs
-
2. Type
- 2.1. On Cloud
- 2.2. On Premise
Process Manufacturing Software Segmentation By Geography
-
1. North America
- 1.1. United States
- 1.2. Canada
- 1.3. Mexico
-
2. South America
- 2.1. Brazil
- 2.2. Argentina
- 2.3. Rest of South America
-
3. Europe
- 3.1. United Kingdom
- 3.2. Germany
- 3.3. France
- 3.4. Italy
- 3.5. Spain
- 3.6. Russia
- 3.7. Benelux
- 3.8. Nordics
- 3.9. Rest of Europe
-
4. Middle East & Africa
- 4.1. Turkey
- 4.2. Israel
- 4.3. GCC
- 4.4. North Africa
- 4.5. South Africa
- 4.6. Rest of Middle East & Africa
-
5. Asia Pacific
- 5.1. China
- 5.2. India
- 5.3. Japan
- 5.4. South Korea
- 5.5. ASEAN
- 5.6. Oceania
- 5.7. Rest of Asia Pacific
Process Manufacturing Software Regional Market Share
Geographic Coverage of Process Manufacturing Software
Process Manufacturing Software REPORT HIGHLIGHTS
| Aspects | Details |
|---|---|
| Study Period | 2020-2034 |
| Base Year | 2025 |
| Estimated Year | 2026 |
| Forecast Period | 2026-2034 |
| Historical Period | 2020-2025 |
| Growth Rate | CAGR of XXX% from 2020-2034 |
| Segmentation |
|
Table of Contents
- 1. Introduction
- 1.1. Research Scope
- 1.2. Market Segmentation
- 1.3. Research Objective
- 1.4. Definitions and Assumptions
- 2. Executive Summary
- 2.1. Market Snapshot
- 3. Market Dynamics
- 3.1. Market Drivers
- 3.2. Market Restrains
- 3.3. Market Trends
- 3.4. Market Opportunities
- 4. Market Factor Analysis
- 4.1. Porters Five Forces
- 4.1.1. Bargaining Power of Suppliers
- 4.1.2. Bargaining Power of Buyers
- 4.1.3. Threat of New Entrants
- 4.1.4. Threat of Substitutes
- 4.1.5. Competitive Rivalry
- 4.2. PESTEL analysis
- 4.3. BCG Analysis
- 4.3.1. Stars (High Growth, High Market Share)
- 4.3.2. Cash Cows (Low Growth, High Market Share)
- 4.3.3. Question Mark (High Growth, Low Market Share)
- 4.3.4. Dogs (Low Growth, Low Market Share)
- 4.4. Ansoff Matrix Analysis
- 4.5. Supply Chain Analysis
- 4.6. Regulatory Landscape
- 4.7. Current Market Potential and Opportunity Assessment (TAM–SAM–SOM Framework)
- 4.8. NRP Analyst Note
- 4.1. Porters Five Forces
- 5. Market Analysis, Insights and Forecast 2021-2033
- 5.1. Market Analysis, Insights and Forecast - by Application
- 5.1.1. Large Enterprises
- 5.1.2. SMEs
- 5.2. Market Analysis, Insights and Forecast - by Type
- 5.2.1. On Cloud
- 5.2.2. On Premise
- 5.3. Market Analysis, Insights and Forecast - by Region
- 5.3.1. North America
- 5.3.2. South America
- 5.3.3. Europe
- 5.3.4. Middle East & Africa
- 5.3.5. Asia Pacific
- 5.1. Market Analysis, Insights and Forecast - by Application
- 6. Global Process Manufacturing Software Analysis, Insights and Forecast, 2021-2033
- 6.1. Market Analysis, Insights and Forecast - by Application
- 6.1.1. Large Enterprises
- 6.1.2. SMEs
- 6.2. Market Analysis, Insights and Forecast - by Type
- 6.2.1. On Cloud
- 6.2.2. On Premise
- 6.1. Market Analysis, Insights and Forecast - by Application
- 7. North America Process Manufacturing Software Analysis, Insights and Forecast, 2020-2032
- 7.1. Market Analysis, Insights and Forecast - by Application
- 7.1.1. Large Enterprises
- 7.1.2. SMEs
- 7.2. Market Analysis, Insights and Forecast - by Type
- 7.2.1. On Cloud
- 7.2.2. On Premise
- 7.1. Market Analysis, Insights and Forecast - by Application
- 8. South America Process Manufacturing Software Analysis, Insights and Forecast, 2020-2032
- 8.1. Market Analysis, Insights and Forecast - by Application
- 8.1.1. Large Enterprises
- 8.1.2. SMEs
- 8.2. Market Analysis, Insights and Forecast - by Type
- 8.2.1. On Cloud
- 8.2.2. On Premise
- 8.1. Market Analysis, Insights and Forecast - by Application
- 9. Europe Process Manufacturing Software Analysis, Insights and Forecast, 2020-2032
- 9.1. Market Analysis, Insights and Forecast - by Application
- 9.1.1. Large Enterprises
- 9.1.2. SMEs
- 9.2. Market Analysis, Insights and Forecast - by Type
- 9.2.1. On Cloud
- 9.2.2. On Premise
- 9.1. Market Analysis, Insights and Forecast - by Application
- 10. Middle East & Africa Process Manufacturing Software Analysis, Insights and Forecast, 2020-2032
- 10.1. Market Analysis, Insights and Forecast - by Application
- 10.1.1. Large Enterprises
- 10.1.2. SMEs
- 10.2. Market Analysis, Insights and Forecast - by Type
- 10.2.1. On Cloud
- 10.2.2. On Premise
- 10.1. Market Analysis, Insights and Forecast - by Application
- 11. Asia Pacific Process Manufacturing Software Analysis, Insights and Forecast, 2020-2032
- 11.1. Market Analysis, Insights and Forecast - by Application
- 11.1.1. Large Enterprises
- 11.1.2. SMEs
- 11.2. Market Analysis, Insights and Forecast - by Type
- 11.2.1. On Cloud
- 11.2.2. On Premise
- 11.1. Market Analysis, Insights and Forecast - by Application
- 12. Competitive Analysis
- 12.1. Company Profiles
- 12.1.1 ERPAG
- 12.1.1.1. Company Overview
- 12.1.1.2. Products
- 12.1.1.3. Company Financials
- 12.1.1.4. SWOT Analysis
- 12.1.2 Fishbowl Manufacturing
- 12.1.2.1. Company Overview
- 12.1.2.2. Products
- 12.1.2.3. Company Financials
- 12.1.2.4. SWOT Analysis
- 12.1.3 NetSuite
- 12.1.3.1. Company Overview
- 12.1.3.2. Products
- 12.1.3.3. Company Financials
- 12.1.3.4. SWOT Analysis
- 12.1.4 Deskera ERP
- 12.1.4.1. Company Overview
- 12.1.4.2. Products
- 12.1.4.3. Company Financials
- 12.1.4.4. SWOT Analysis
- 12.1.5 IQMS ERP Software
- 12.1.5.1. Company Overview
- 12.1.5.2. Products
- 12.1.5.3. Company Financials
- 12.1.5.4. SWOT Analysis
- 12.1.6 Sage 100cloud
- 12.1.6.1. Company Overview
- 12.1.6.2. Products
- 12.1.6.3. Company Financials
- 12.1.6.4. SWOT Analysis
- 12.1.7 Vicinity Manufacturing
- 12.1.7.1. Company Overview
- 12.1.7.2. Products
- 12.1.7.3. Company Financials
- 12.1.7.4. SWOT Analysis
- 12.1.8 Intellect eQMS
- 12.1.8.1. Company Overview
- 12.1.8.2. Products
- 12.1.8.3. Company Financials
- 12.1.8.4. SWOT Analysis
- 12.1.9 QuickBooks Enterprise
- 12.1.9.1. Company Overview
- 12.1.9.2. Products
- 12.1.9.3. Company Financials
- 12.1.9.4. SWOT Analysis
- 12.1.10 SYSPRO
- 12.1.10.1. Company Overview
- 12.1.10.2. Products
- 12.1.10.3. Company Financials
- 12.1.10.4. SWOT Analysis
- 12.1.11 BatchMaster ERP
- 12.1.11.1. Company Overview
- 12.1.11.2. Products
- 12.1.11.3. Company Financials
- 12.1.11.4. SWOT Analysis
- 12.1.12 Datacor Chempax
- 12.1.12.1. Company Overview
- 12.1.12.2. Products
- 12.1.12.3. Company Financials
- 12.1.12.4. SWOT Analysis
- 12.1.13 Odoo
- 12.1.13.1. Company Overview
- 12.1.13.2. Products
- 12.1.13.3. Company Financials
- 12.1.13.4. SWOT Analysis
- 12.1.14 Sage Business Cloud Enterprise Management
- 12.1.14.1. Company Overview
- 12.1.14.2. Products
- 12.1.14.3. Company Financials
- 12.1.14.4. SWOT Analysis
- 12.1.15 Royal 4 Enterprise
- 12.1.15.1. Company Overview
- 12.1.15.2. Products
- 12.1.15.3. Company Financials
- 12.1.15.4. SWOT Analysis
- 12.1.16 Columbus Manufacturing
- 12.1.16.1. Company Overview
- 12.1.16.2. Products
- 12.1.16.3. Company Financials
- 12.1.16.4. SWOT Analysis
- 12.1.17 Prodsmart
- 12.1.17.1. Company Overview
- 12.1.17.2. Products
- 12.1.17.3. Company Financials
- 12.1.17.4. SWOT Analysis
- 12.1.18 Geneva Business Management Systems (GBMS)
- 12.1.18.1. Company Overview
- 12.1.18.2. Products
- 12.1.18.3. Company Financials
- 12.1.18.4. SWOT Analysis
- 12.1.19 Fulcrum
- 12.1.19.1. Company Overview
- 12.1.19.2. Products
- 12.1.19.3. Company Financials
- 12.1.19.4. SWOT Analysis
- 12.1.20 Process Force
- 12.1.20.1. Company Overview
- 12.1.20.2. Products
- 12.1.20.3. Company Financials
- 12.1.20.4. SWOT Analysis
- 12.1.1 ERPAG
- 12.2. Market Entropy
- 12.2.1 Company's Key Areas Served
- 12.2.2 Recent Developments
- 12.3. Company Market Share Analysis 2025
- 12.3.1 Top 5 Companies Market Share Analysis
- 12.3.2 Top 3 Companies Market Share Analysis
- 12.4. List of Potential Customers
- 13. Research Methodology
List of Figures
- Figure 1: Global Process Manufacturing Software Revenue Breakdown (million, %) by Region 2025 & 2033
- Figure 2: North America Process Manufacturing Software Revenue (million), by Application 2025 & 2033
- Figure 3: North America Process Manufacturing Software Revenue Share (%), by Application 2025 & 2033
- Figure 4: North America Process Manufacturing Software Revenue (million), by Type 2025 & 2033
- Figure 5: North America Process Manufacturing Software Revenue Share (%), by Type 2025 & 2033
- Figure 6: North America Process Manufacturing Software Revenue (million), by Country 2025 & 2033
- Figure 7: North America Process Manufacturing Software Revenue Share (%), by Country 2025 & 2033
- Figure 8: South America Process Manufacturing Software Revenue (million), by Application 2025 & 2033
- Figure 9: South America Process Manufacturing Software Revenue Share (%), by Application 2025 & 2033
- Figure 10: South America Process Manufacturing Software Revenue (million), by Type 2025 & 2033
- Figure 11: South America Process Manufacturing Software Revenue Share (%), by Type 2025 & 2033
- Figure 12: South America Process Manufacturing Software Revenue (million), by Country 2025 & 2033
- Figure 13: South America Process Manufacturing Software Revenue Share (%), by Country 2025 & 2033
- Figure 14: Europe Process Manufacturing Software Revenue (million), by Application 2025 & 2033
- Figure 15: Europe Process Manufacturing Software Revenue Share (%), by Application 2025 & 2033
- Figure 16: Europe Process Manufacturing Software Revenue (million), by Type 2025 & 2033
- Figure 17: Europe Process Manufacturing Software Revenue Share (%), by Type 2025 & 2033
- Figure 18: Europe Process Manufacturing Software Revenue (million), by Country 2025 & 2033
- Figure 19: Europe Process Manufacturing Software Revenue Share (%), by Country 2025 & 2033
- Figure 20: Middle East & Africa Process Manufacturing Software Revenue (million), by Application 2025 & 2033
- Figure 21: Middle East & Africa Process Manufacturing Software Revenue Share (%), by Application 2025 & 2033
- Figure 22: Middle East & Africa Process Manufacturing Software Revenue (million), by Type 2025 & 2033
- Figure 23: Middle East & Africa Process Manufacturing Software Revenue Share (%), by Type 2025 & 2033
- Figure 24: Middle East & Africa Process Manufacturing Software Revenue (million), by Country 2025 & 2033
- Figure 25: Middle East & Africa Process Manufacturing Software Revenue Share (%), by Country 2025 & 2033
- Figure 26: Asia Pacific Process Manufacturing Software Revenue (million), by Application 2025 & 2033
- Figure 27: Asia Pacific Process Manufacturing Software Revenue Share (%), by Application 2025 & 2033
- Figure 28: Asia Pacific Process Manufacturing Software Revenue (million), by Type 2025 & 2033
- Figure 29: Asia Pacific Process Manufacturing Software Revenue Share (%), by Type 2025 & 2033
- Figure 30: Asia Pacific Process Manufacturing Software Revenue (million), by Country 2025 & 2033
- Figure 31: Asia Pacific Process Manufacturing Software Revenue Share (%), by Country 2025 & 2033
List of Tables
- Table 1: Global Process Manufacturing Software Revenue million Forecast, by Application 2020 & 2033
- Table 2: Global Process Manufacturing Software Revenue million Forecast, by Type 2020 & 2033
- Table 3: Global Process Manufacturing Software Revenue million Forecast, by Region 2020 & 2033
- Table 4: Global Process Manufacturing Software Revenue million Forecast, by Application 2020 & 2033
- Table 5: Global Process Manufacturing Software Revenue million Forecast, by Type 2020 & 2033
- Table 6: Global Process Manufacturing Software Revenue million Forecast, by Country 2020 & 2033
- Table 7: United States Process Manufacturing Software Revenue (million) Forecast, by Application 2020 & 2033
- Table 8: Canada Process Manufacturing Software Revenue (million) Forecast, by Application 2020 & 2033
- Table 9: Mexico Process Manufacturing Software Revenue (million) Forecast, by Application 2020 & 2033
- Table 10: Global Process Manufacturing Software Revenue million Forecast, by Application 2020 & 2033
- Table 11: Global Process Manufacturing Software Revenue million Forecast, by Type 2020 & 2033
- Table 12: Global Process Manufacturing Software Revenue million Forecast, by Country 2020 & 2033
- Table 13: Brazil Process Manufacturing Software Revenue (million) Forecast, by Application 2020 & 2033
- Table 14: Argentina Process Manufacturing Software Revenue (million) Forecast, by Application 2020 & 2033
- Table 15: Rest of South America Process Manufacturing Software Revenue (million) Forecast, by Application 2020 & 2033
- Table 16: Global Process Manufacturing Software Revenue million Forecast, by Application 2020 & 2033
- Table 17: Global Process Manufacturing Software Revenue million Forecast, by Type 2020 & 2033
- Table 18: Global Process Manufacturing Software Revenue million Forecast, by Country 2020 & 2033
- Table 19: United Kingdom Process Manufacturing Software Revenue (million) Forecast, by Application 2020 & 2033
- Table 20: Germany Process Manufacturing Software Revenue (million) Forecast, by Application 2020 & 2033
- Table 21: France Process Manufacturing Software Revenue (million) Forecast, by Application 2020 & 2033
- Table 22: Italy Process Manufacturing Software Revenue (million) Forecast, by Application 2020 & 2033
- Table 23: Spain Process Manufacturing Software Revenue (million) Forecast, by Application 2020 & 2033
- Table 24: Russia Process Manufacturing Software Revenue (million) Forecast, by Application 2020 & 2033
- Table 25: Benelux Process Manufacturing Software Revenue (million) Forecast, by Application 2020 & 2033
- Table 26: Nordics Process Manufacturing Software Revenue (million) Forecast, by Application 2020 & 2033
- Table 27: Rest of Europe Process Manufacturing Software Revenue (million) Forecast, by Application 2020 & 2033
- Table 28: Global Process Manufacturing Software Revenue million Forecast, by Application 2020 & 2033
- Table 29: Global Process Manufacturing Software Revenue million Forecast, by Type 2020 & 2033
- Table 30: Global Process Manufacturing Software Revenue million Forecast, by Country 2020 & 2033
- Table 31: Turkey Process Manufacturing Software Revenue (million) Forecast, by Application 2020 & 2033
- Table 32: Israel Process Manufacturing Software Revenue (million) Forecast, by Application 2020 & 2033
- Table 33: GCC Process Manufacturing Software Revenue (million) Forecast, by Application 2020 & 2033
- Table 34: North Africa Process Manufacturing Software Revenue (million) Forecast, by Application 2020 & 2033
- Table 35: South Africa Process Manufacturing Software Revenue (million) Forecast, by Application 2020 & 2033
- Table 36: Rest of Middle East & Africa Process Manufacturing Software Revenue (million) Forecast, by Application 2020 & 2033
- Table 37: Global Process Manufacturing Software Revenue million Forecast, by Application 2020 & 2033
- Table 38: Global Process Manufacturing Software Revenue million Forecast, by Type 2020 & 2033
- Table 39: Global Process Manufacturing Software Revenue million Forecast, by Country 2020 & 2033
- Table 40: China Process Manufacturing Software Revenue (million) Forecast, by Application 2020 & 2033
- Table 41: India Process Manufacturing Software Revenue (million) Forecast, by Application 2020 & 2033
- Table 42: Japan Process Manufacturing Software Revenue (million) Forecast, by Application 2020 & 2033
- Table 43: South Korea Process Manufacturing Software Revenue (million) Forecast, by Application 2020 & 2033
- Table 44: ASEAN Process Manufacturing Software Revenue (million) Forecast, by Application 2020 & 2033
- Table 45: Oceania Process Manufacturing Software Revenue (million) Forecast, by Application 2020 & 2033
- Table 46: Rest of Asia Pacific Process Manufacturing Software Revenue (million) Forecast, by Application 2020 & 2033
Frequently Asked Questions
1. What is the projected Compound Annual Growth Rate (CAGR) of the Process Manufacturing Software?
The projected CAGR is approximately XXX%.
2. Which companies are prominent players in the Process Manufacturing Software?
Key companies in the market include ERPAG, Fishbowl Manufacturing, NetSuite, Deskera ERP, IQMS ERP Software, Sage 100cloud, Vicinity Manufacturing, Intellect eQMS, QuickBooks Enterprise, SYSPRO, BatchMaster ERP, Datacor Chempax, Odoo, Sage Business Cloud Enterprise Management, Royal 4 Enterprise, Columbus Manufacturing, Prodsmart, Geneva Business Management Systems (GBMS), Fulcrum, Process Force.
3. What are the main segments of the Process Manufacturing Software?
The market segments include Application, Type.
4. Can you provide details about the market size?
The market size is estimated to be USD XXX million as of 2022.
5. What are some drivers contributing to market growth?
N/A
6. What are the notable trends driving market growth?
N/A
7. Are there any restraints impacting market growth?
N/A
8. Can you provide examples of recent developments in the market?
N/A
9. What pricing options are available for accessing the report?
Pricing options include single-user, multi-user, and enterprise licenses priced at USD 3950.00, USD 5925.00, and USD 7900.00 respectively.
10. Is the market size provided in terms of value or volume?
The market size is provided in terms of value, measured in million.
11. Are there any specific market keywords associated with the report?
Yes, the market keyword associated with the report is "Process Manufacturing Software," which aids in identifying and referencing the specific market segment covered.
12. How do I determine which pricing option suits my needs best?
The pricing options vary based on user requirements and access needs. Individual users may opt for single-user licenses, while businesses requiring broader access may choose multi-user or enterprise licenses for cost-effective access to the report.
13. Are there any additional resources or data provided in the Process Manufacturing Software report?
While the report offers comprehensive insights, it's advisable to review the specific contents or supplementary materials provided to ascertain if additional resources or data are available.
14. How can I stay updated on further developments or reports in the Process Manufacturing Software?
To stay informed about further developments, trends, and reports in the Process Manufacturing Software, consider subscribing to industry newsletters, following relevant companies and organizations, or regularly checking reputable industry news sources and publications.
Methodology
Step 1 - Identification of Relevant Samples Size from Population Database


Step 2 - Approaches for Defining Global Market Size (Value, Volume* & Price*)

Note*: In applicable scenarios
Step 3 - Data Sources
Primary Research
- Web Analytics
- Survey Reports
- Research Institute
- Latest Research Reports
- Opinion Leaders
Secondary Research
- Annual Reports
- White Paper
- Latest Press Release
- Industry Association
- Paid Database
- Investor Presentations

Step 4 - Data Triangulation
Involves using different sources of information in order to increase the validity of a study
These sources are likely to be stakeholders in a program - participants, other researchers, program staff, other community members, and so on.
Then we put all data in single framework & apply various statistical tools to find out the dynamic on the market.
During the analysis stage, feedback from the stakeholder groups would be compared to determine areas of agreement as well as areas of divergence