

Key Insights
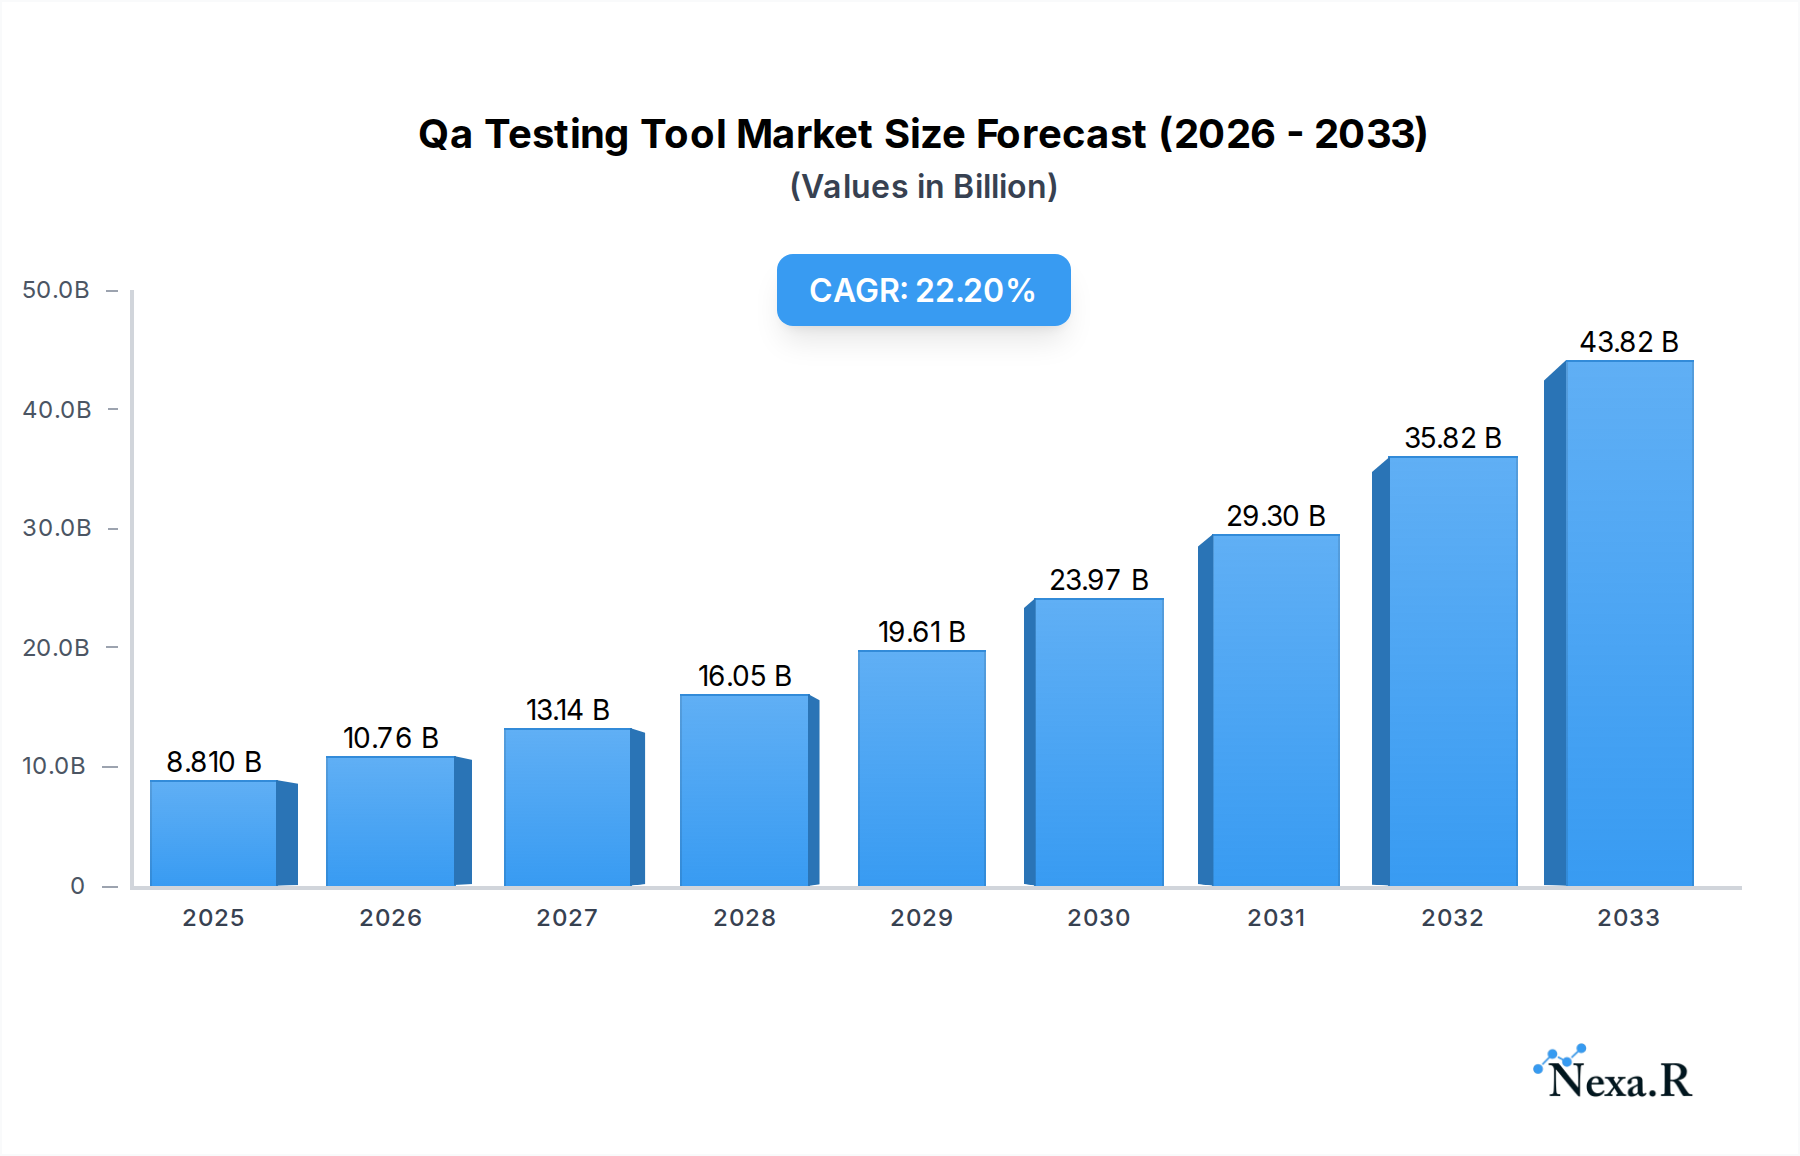
The QA Testing Tool market is poised for significant expansion, projected to reach USD 8.81 billion in 2025 and grow at a robust CAGR of 22.3% during the forecast period of 2025-2033. This rapid growth is primarily driven by the increasing demand for high-quality software across all industries, the escalating complexity of applications, and the continuous need for efficient and automated testing processes. The rising adoption of agile and DevOps methodologies further propels the market, as these frameworks necessitate frequent testing cycles and continuous integration/continuous delivery (CI/CD) pipelines, where automated QA tools play a crucial role. Furthermore, the growing emphasis on user experience and the need to minimize post-release defects are compelling businesses to invest more in advanced QA solutions. The market is also influenced by the proliferation of mobile applications and the Internet of Things (IoT) devices, which introduce new testing challenges and opportunities for specialized QA tools.

Qa Testing Tool Market Size (In Billion)
The market segmentation reveals a dynamic landscape with strong performance expected across various applications and deployment types. The increasing adoption of cloud-based solutions is a key trend, offering scalability, flexibility, and cost-effectiveness, particularly for Small and Medium-sized Enterprises (SMEs) looking to optimize their testing budgets. While large enterprises are also embracing cloud solutions, they continue to invest in on-premises deployments for enhanced control and security of sensitive data. Geographically, North America and Europe are anticipated to lead the market due to their mature technology ecosystems and high R&D investments. However, the Asia Pacific region is expected to exhibit the fastest growth, fueled by its burgeoning IT sector, increasing digitalization, and a large pool of skilled QA professionals. Key players like Rainforest QA, Selenium, Cypress, and Katalon Studio are at the forefront, continuously innovating and expanding their offerings to cater to evolving market demands.
Qa Testing Tool Company Market Share
QA Testing Tool Market Report: Strategic Insights for Digital Transformation
This comprehensive report delves into the dynamic global QA Testing Tool market, providing critical insights for industry stakeholders. Spanning the historical period of 2019–2024 and projecting through to 2033, this analysis leverages the base year 2025 to offer an in-depth understanding of market evolution, growth trajectories, and strategic opportunities. With a projected market size of $35.2 billion by 2033, this report is an indispensable resource for navigating the competitive landscape and capitalizing on emerging trends in automated software testing and quality assurance.
QA Testing Tool Market Dynamics & Structure
The QA Testing Tool market is characterized by a moderately concentrated structure, with a blend of established giants and innovative startups vying for market share. Technological innovation is the primary driver, fueled by the increasing complexity of software applications, the rise of agile and DevOps methodologies, and the escalating demand for faster release cycles. Regulatory frameworks, while less stringent than in some other software sectors, are gradually influencing the adoption of standardized testing practices, particularly in finance and healthcare. Competitive product substitutes, ranging from open-source solutions like Selenium to integrated platforms like Katalon Studio, present continuous challenges and opportunities for differentiation. End-user demographics are increasingly skewed towards tech-savvy organizations seeking to optimize their software development lifecycle. Mergers and acquisitions (M&A) are a notable trend, with larger players acquiring innovative technologies and talent to expand their offerings. For instance, the period saw an average of 15 M&A deals per year, with a total deal volume of approximately $4.8 billion across the historical period, signaling consolidation and strategic expansion. Barriers to innovation include the high cost of developing sophisticated AI-powered testing solutions and the ongoing need to adapt to rapidly evolving programming languages and frameworks.
- Market Concentration: Moderately concentrated, with key players holding significant shares but room for emerging vendors.
- Technological Innovation Drivers: AI/ML integration, low-code/no-code platforms, cloud-native testing, cross-browser and cross-device testing.
- Regulatory Frameworks: Increasing emphasis on compliance and data security in testing processes.
- Competitive Product Substitutes: Open-source tools (Selenium, Appium) vs. commercial integrated platforms (Rainforest QA, Cypress, Testim.io).
- End-User Demographics: Growing adoption by SMEs and large enterprises across all industries.
- M&A Trends: Strategic acquisitions of niche technologies and market expansion capabilities.
QA Testing Tool Growth Trends & Insights
The global QA Testing Tool market is poised for robust expansion, driven by the fundamental shift towards digital transformation across all industries. From an estimated market size of $18.5 billion in 2025, the market is projected to surge to $35.2 billion by 2033, reflecting a compound annual growth rate (CAGR) of approximately 8.3% during the forecast period of 2025–2033. This significant growth is underpinned by several key trends. Firstly, the increasing adoption of cloud-based testing solutions, offering scalability, flexibility, and cost-effectiveness, is accelerating market penetration. Secondly, the proliferation of mobile applications and the Internet of Things (IoT) devices necessitates more sophisticated and comprehensive testing strategies, driving demand for specialized tools like Appium and Kobiton. The continuous evolution of software development methodologies, such as DevOps and Continuous Integration/Continuous Delivery (CI/CD), further amplifies the need for integrated and automated QA processes. Furthermore, the growing realization of the critical role of quality assurance in mitigating risks, enhancing user experience, and reducing post-deployment issues is pushing organizations to invest more heavily in advanced testing tools. Consumer behavior is also influencing market dynamics, with an increasing expectation for bug-free, high-performance applications, compelling businesses to prioritize quality from the outset. The rise of low-code/no-code testing platforms is democratizing access to automation, enabling smaller teams and citizen testers to contribute to quality assurance, thereby broadening the market reach. Technological disruptions, including advancements in artificial intelligence and machine learning for test case generation, predictive defect analysis, and self-healing tests, are redefining the efficiency and effectiveness of QA processes. The market penetration of these advanced tools is expected to climb steadily as organizations recognize their potential to significantly reduce testing time and resources. Moreover, the growing complexity of software architectures, microservices, and APIs demands more granular and efficient testing mechanisms, further fueling the adoption of specialized QA testing tools. The increasing focus on customer experience (CX) as a key differentiator also directly translates into a higher demand for robust QA solutions that ensure flawless application performance across all touchpoints.
Dominant Regions, Countries, or Segments in QA Testing Tool
The QA Testing Tool market exhibits significant regional variations and segment dominance, with North America currently leading in market share and growth potential, projected to account for over 30% of the global market by 2025. This dominance is attributed to the region's mature technology ecosystem, high adoption rates of cloud computing, and the presence of a large concentration of large enterprises and SMEs actively investing in digital transformation initiatives. Within the application segment, Large Enterprises are the primary revenue generators, driven by their complex software requirements, extensive testing needs, and larger budgets for sophisticated QA solutions. Their market share is estimated to be around 55% in 2025. However, the Small and Medium-sized Enterprises (SMEs) segment is exhibiting a higher CAGR, driven by the increasing affordability and accessibility of cloud-based QA tools and the growing recognition of the importance of quality assurance for their business survival and growth. In terms of deployment type, Cloud-based solutions are the undisputed leaders, projected to capture over 65% of the market share in 2025. This is due to their inherent scalability, reduced upfront costs, and ease of integration, aligning perfectly with the agile development practices prevalent in the industry. On-premises solutions, while still relevant for organizations with stringent data security and compliance requirements, are experiencing slower growth. Key drivers for North America's dominance include robust government support for technology innovation, a highly skilled workforce, and a strong venture capital ecosystem that fuels the growth of QA testing tool providers. The United States, in particular, plays a pivotal role due to its extensive software development industry and the widespread adoption of advanced testing methodologies.
- Dominant Region: North America, driven by technological maturity and digital transformation initiatives.
- Dominant Application Segment: Large Enterprises, due to complex software needs and significant investment capacity.
- Emerging Application Segment: SMEs, showing higher growth rates due to accessibility and affordability of cloud solutions.
- Dominant Deployment Type: Cloud-based, offering scalability and cost-effectiveness.
- Emerging Deployment Type: On-premises, catering to specific security and compliance needs.
- Key Drivers in North America: Strong IT infrastructure, innovation hubs, and aggressive adoption of automation.
QA Testing Tool Product Landscape
The QA Testing Tool market is characterized by a diverse and rapidly evolving product landscape, driven by continuous innovation. Key product trends include the integration of Artificial Intelligence (AI) and Machine Learning (ML) to automate test case generation, optimize test execution, and provide predictive analytics for defect identification. Low-code/no-code platforms, such as Testsigma and Autify, are democratizing test automation, empowering less technical users to create and manage test scripts. Cloud-based platforms like LambdaTest and BrowserStack offer extensive cross-browser and cross-device testing capabilities, crucial for today's multi-platform application environments. Specialized tools are also gaining traction, catering to specific needs like API testing, mobile testing (e.g., Appium, Kobiton), and performance testing. Companies like Rainforest QA and Mabl are focusing on intelligent, self-healing test automation that reduces maintenance overhead. The unique selling propositions of leading tools often revolve around their ease of use, comprehensive feature sets, scalability, and integration capabilities with CI/CD pipelines. Technological advancements are pushing the boundaries of efficiency and accuracy, enabling faster feedback loops and higher software quality.
Key Drivers, Barriers & Challenges in QA Testing Tool
The QA Testing Tool market is propelled by several key drivers, including the escalating demand for high-quality software, the growing adoption of agile and DevOps methodologies, and the continuous rise of mobile and web applications. Technological advancements in AI and ML for intelligent automation and the increasing need for cost optimization in software development also act as significant growth accelerators.
Key barriers and challenges include the initial high cost of implementing sophisticated automation tools, the shortage of skilled QA professionals capable of managing complex testing environments, and the resistance to change within some traditional organizational structures. Supply chain issues, while less direct for software, can indirectly impact hardware requirements for testing environments. Regulatory hurdles, particularly in sensitive industries, can necessitate extensive and time-consuming validation processes, increasing testing complexity. Competitive pressures from both established players and new entrants constantly push for innovation and price optimization.
- Drivers: Demand for quality, agile/DevOps adoption, mobile/web growth, AI/ML advancements, cost optimization.
- Barriers: High implementation costs, talent shortage, organizational resistance, complex regulatory compliance.
- Challenges: Keeping pace with technology, integration with legacy systems, ensuring data security in cloud testing.
Emerging Opportunities in QA Testing Tool
Emerging opportunities in the QA Testing Tool market are largely centered around the increasing demand for AI-powered testing solutions that can autonomously learn and adapt to application changes. The expansion of the Internet of Things (IoT) ecosystem presents a significant untapped market for specialized IoT testing tools. Furthermore, the growing need for shift-left testing, where quality is embedded early in the development cycle, opens avenues for tools that facilitate early bug detection and prevention. The rise of no-code/low-code testing platforms is creating opportunities to serve a broader user base, including business analysts and citizen testers, thus expanding the market's reach. The increasing focus on cybersecurity also presents an opportunity for integrated security testing capabilities within QA tools.
Growth Accelerators in the QA Testing Tool Industry
Several catalysts are accelerating the growth of the QA Testing Tool industry. Technological breakthroughs in AI and machine learning are enabling more intelligent and autonomous testing processes, significantly reducing manual effort and increasing efficiency. Strategic partnerships between QA tool vendors and cloud providers, as well as with integrated development environment (IDE) providers, are expanding market reach and enhancing user experience. Furthermore, the global push towards digital transformation across all sectors is creating a perpetual demand for reliable and high-performing software, making robust QA testing an essential component of the development lifecycle. Market expansion strategies, including the penetration of emerging economies and the development of tailored solutions for specific industry verticals, are also contributing to sustained growth.
Key Players Shaping the QA Testing Tool Market
- Rainforest QA
- Selenium
- Cypress
- Katalon Studio
- Testim.io
- Appium
- Mabl
- GlowTouch Technologies
- Ranorex
- Zaptest
- Testsigma
- Telerik Test Studio
- LambdaTest
- Cucumber
- TestingWhiz
- testRigor
- Autify
- QA Wolf
- TestRail
- Kualitee
- Kobiton
- Appsurify TestBrain
- Testim
- Xray
- PractiTest
Notable Milestones in QA Testing Tool Sector
- 2019: Increased adoption of AI in test automation frameworks.
- 2020: Rise of low-code/no-code test automation platforms.
- 2021: Significant growth in cloud-based cross-browser testing solutions.
- 2022: Enhanced focus on API testing tools and integrations.
- 2023: Emergence of self-healing test automation capabilities.
- 2024: Growing integration of security testing within QA workflows.
In-Depth QA Testing Tool Market Outlook
The future outlook for the QA Testing Tool market remains exceptionally bright, driven by the relentless pursuit of software excellence and the accelerating pace of digital innovation. Growth accelerators such as advanced AI integration for predictive analytics and intelligent test generation will continue to redefine efficiency. Strategic partnerships between tool vendors and cloud infrastructure providers will further democratize access to powerful testing capabilities. The continuous expansion of the global digital economy, coupled with the increasing complexity of software applications across mobile, web, and IoT platforms, guarantees sustained demand for robust QA solutions. Emerging markets in Asia-Pacific and Latin America represent significant untapped potential, while a growing focus on cybersecurity within the software development lifecycle will foster the development of integrated security testing tools. The market's trajectory indicates not just growth, but a fundamental evolution towards more intelligent, automated, and integrated quality assurance processes, crucial for business success in the digital age.
Qa Testing Tool Segmentation
-
1. Application
- 1.1. SMEs
- 1.2. Large Enterprises
-
2. Type
- 2.1. Cloud-based
- 2.2. On-premises
Qa Testing Tool Segmentation By Geography
-
1. North America
- 1.1. United States
- 1.2. Canada
- 1.3. Mexico
-
2. South America
- 2.1. Brazil
- 2.2. Argentina
- 2.3. Rest of South America
-
3. Europe
- 3.1. United Kingdom
- 3.2. Germany
- 3.3. France
- 3.4. Italy
- 3.5. Spain
- 3.6. Russia
- 3.7. Benelux
- 3.8. Nordics
- 3.9. Rest of Europe
-
4. Middle East & Africa
- 4.1. Turkey
- 4.2. Israel
- 4.3. GCC
- 4.4. North Africa
- 4.5. South Africa
- 4.6. Rest of Middle East & Africa
-
5. Asia Pacific
- 5.1. China
- 5.2. India
- 5.3. Japan
- 5.4. South Korea
- 5.5. ASEAN
- 5.6. Oceania
- 5.7. Rest of Asia Pacific
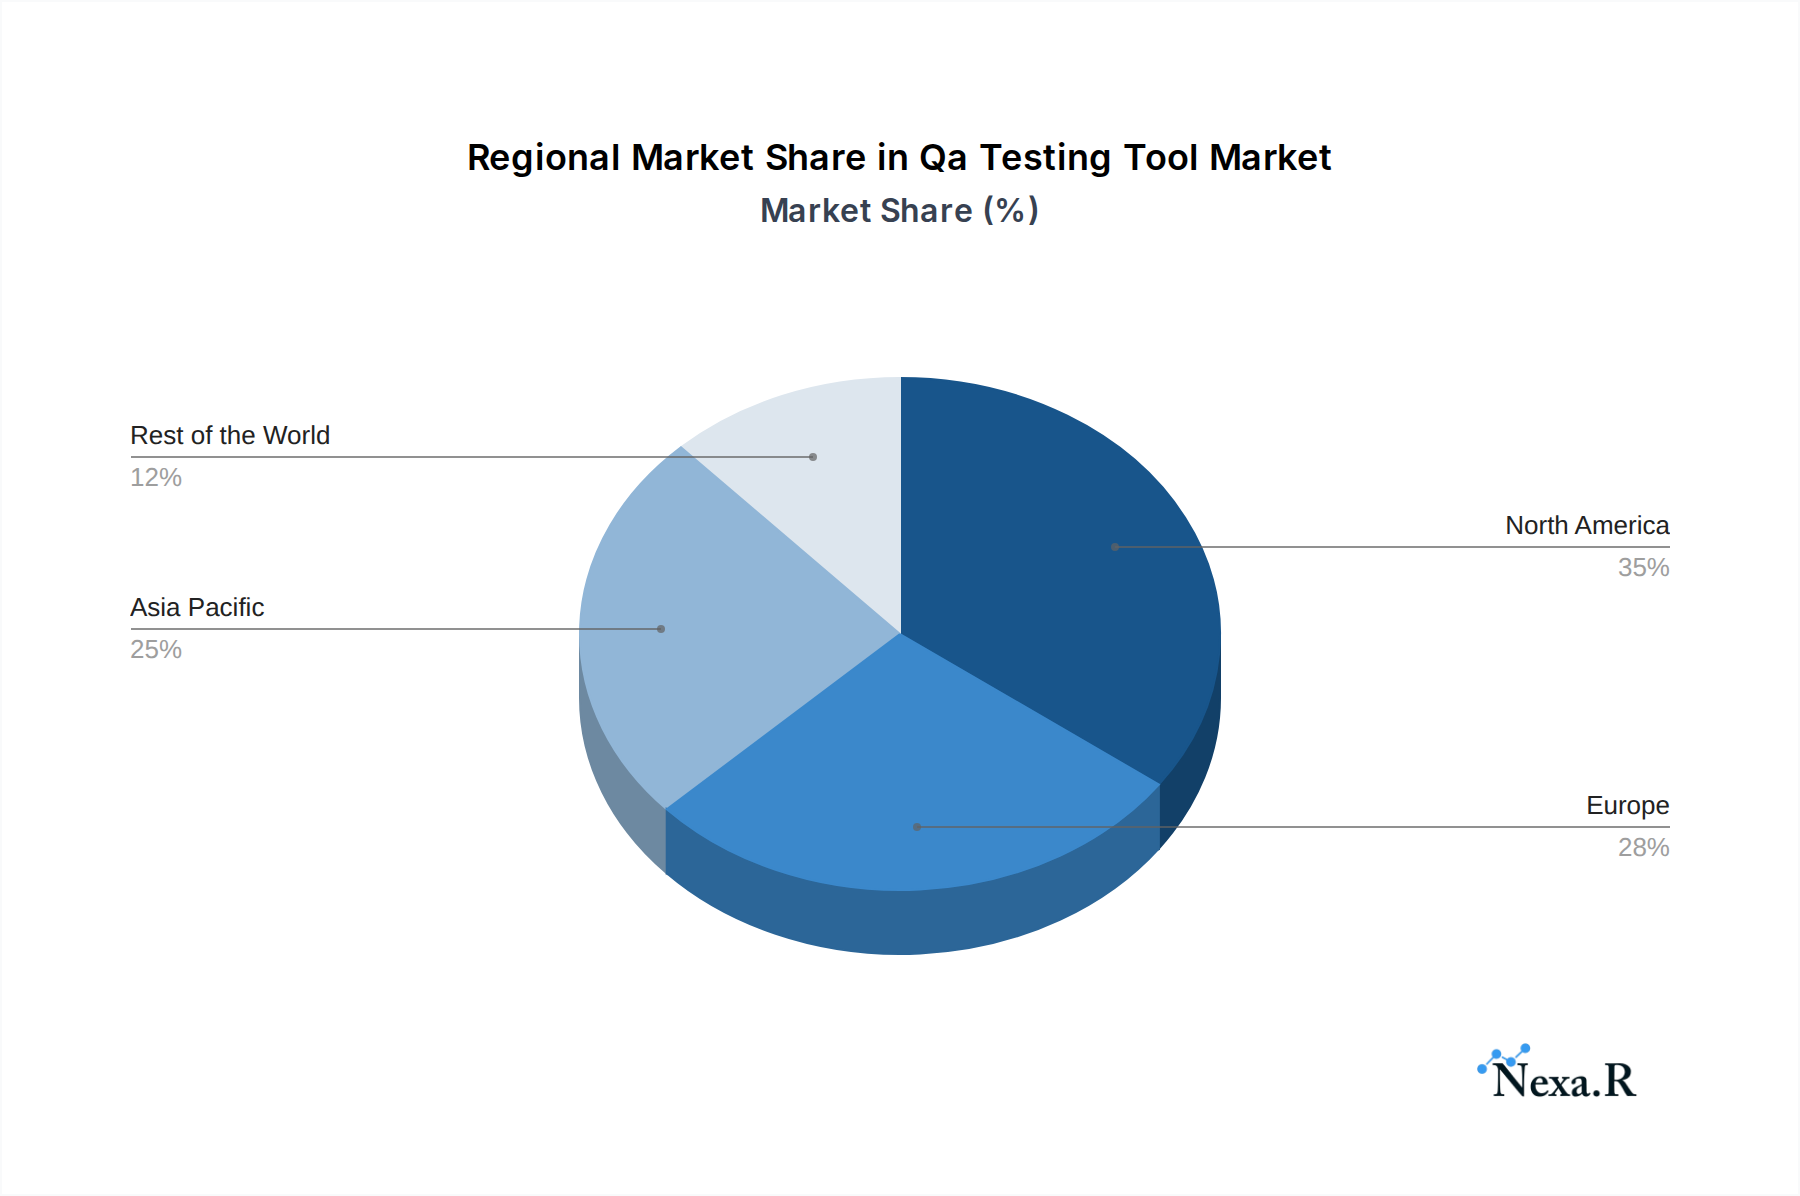
Qa Testing Tool Regional Market Share
Geographic Coverage of Qa Testing Tool
Qa Testing Tool REPORT HIGHLIGHTS
| Aspects | Details |
|---|---|
| Study Period | 2020-2034 |
| Base Year | 2025 |
| Estimated Year | 2026 |
| Forecast Period | 2026-2034 |
| Historical Period | 2020-2025 |
| Growth Rate | CAGR of 22.3% from 2020-2034 |
| Segmentation |
|
Table of Contents
- 1. Introduction
- 1.1. Research Scope
- 1.2. Market Segmentation
- 1.3. Research Methodology
- 1.4. Definitions and Assumptions
- 2. Executive Summary
- 2.1. Introduction
- 3. Market Dynamics
- 3.1. Introduction
- 3.2. Market Drivers
- 3.3. Market Restrains
- 3.4. Market Trends
- 4. Market Factor Analysis
- 4.1. Porters Five Forces
- 4.2. Supply/Value Chain
- 4.3. PESTEL analysis
- 4.4. Market Entropy
- 4.5. Patent/Trademark Analysis
- 5. Global Qa Testing Tool Analysis, Insights and Forecast, 2020-2032
- 5.1. Market Analysis, Insights and Forecast - by Application
- 5.1.1. SMEs
- 5.1.2. Large Enterprises
- 5.2. Market Analysis, Insights and Forecast - by Type
- 5.2.1. Cloud-based
- 5.2.2. On-premises
- 5.3. Market Analysis, Insights and Forecast - by Region
- 5.3.1. North America
- 5.3.2. South America
- 5.3.3. Europe
- 5.3.4. Middle East & Africa
- 5.3.5. Asia Pacific
- 5.1. Market Analysis, Insights and Forecast - by Application
- 6. North America Qa Testing Tool Analysis, Insights and Forecast, 2020-2032
- 6.1. Market Analysis, Insights and Forecast - by Application
- 6.1.1. SMEs
- 6.1.2. Large Enterprises
- 6.2. Market Analysis, Insights and Forecast - by Type
- 6.2.1. Cloud-based
- 6.2.2. On-premises
- 6.1. Market Analysis, Insights and Forecast - by Application
- 7. South America Qa Testing Tool Analysis, Insights and Forecast, 2020-2032
- 7.1. Market Analysis, Insights and Forecast - by Application
- 7.1.1. SMEs
- 7.1.2. Large Enterprises
- 7.2. Market Analysis, Insights and Forecast - by Type
- 7.2.1. Cloud-based
- 7.2.2. On-premises
- 7.1. Market Analysis, Insights and Forecast - by Application
- 8. Europe Qa Testing Tool Analysis, Insights and Forecast, 2020-2032
- 8.1. Market Analysis, Insights and Forecast - by Application
- 8.1.1. SMEs
- 8.1.2. Large Enterprises
- 8.2. Market Analysis, Insights and Forecast - by Type
- 8.2.1. Cloud-based
- 8.2.2. On-premises
- 8.1. Market Analysis, Insights and Forecast - by Application
- 9. Middle East & Africa Qa Testing Tool Analysis, Insights and Forecast, 2020-2032
- 9.1. Market Analysis, Insights and Forecast - by Application
- 9.1.1. SMEs
- 9.1.2. Large Enterprises
- 9.2. Market Analysis, Insights and Forecast - by Type
- 9.2.1. Cloud-based
- 9.2.2. On-premises
- 9.1. Market Analysis, Insights and Forecast - by Application
- 10. Asia Pacific Qa Testing Tool Analysis, Insights and Forecast, 2020-2032
- 10.1. Market Analysis, Insights and Forecast - by Application
- 10.1.1. SMEs
- 10.1.2. Large Enterprises
- 10.2. Market Analysis, Insights and Forecast - by Type
- 10.2.1. Cloud-based
- 10.2.2. On-premises
- 10.1. Market Analysis, Insights and Forecast - by Application
- 11. Competitive Analysis
- 11.1. Global Market Share Analysis 2025
- 11.2. Company Profiles
- 11.2.1 Rainforest QA
- 11.2.1.1. Overview
- 11.2.1.2. Products
- 11.2.1.3. SWOT Analysis
- 11.2.1.4. Recent Developments
- 11.2.1.5. Financials (Based on Availability)
- 11.2.2 Selenium
- 11.2.2.1. Overview
- 11.2.2.2. Products
- 11.2.2.3. SWOT Analysis
- 11.2.2.4. Recent Developments
- 11.2.2.5. Financials (Based on Availability)
- 11.2.3 Cypress
- 11.2.3.1. Overview
- 11.2.3.2. Products
- 11.2.3.3. SWOT Analysis
- 11.2.3.4. Recent Developments
- 11.2.3.5. Financials (Based on Availability)
- 11.2.4 Katalon Studio
- 11.2.4.1. Overview
- 11.2.4.2. Products
- 11.2.4.3. SWOT Analysis
- 11.2.4.4. Recent Developments
- 11.2.4.5. Financials (Based on Availability)
- 11.2.5 Testim.io
- 11.2.5.1. Overview
- 11.2.5.2. Products
- 11.2.5.3. SWOT Analysis
- 11.2.5.4. Recent Developments
- 11.2.5.5. Financials (Based on Availability)
- 11.2.6 Appium
- 11.2.6.1. Overview
- 11.2.6.2. Products
- 11.2.6.3. SWOT Analysis
- 11.2.6.4. Recent Developments
- 11.2.6.5. Financials (Based on Availability)
- 11.2.7 Mabl
- 11.2.7.1. Overview
- 11.2.7.2. Products
- 11.2.7.3. SWOT Analysis
- 11.2.7.4. Recent Developments
- 11.2.7.5. Financials (Based on Availability)
- 11.2.8 GlowTouch Technologies
- 11.2.8.1. Overview
- 11.2.8.2. Products
- 11.2.8.3. SWOT Analysis
- 11.2.8.4. Recent Developments
- 11.2.8.5. Financials (Based on Availability)
- 11.2.9 Ranorex
- 11.2.9.1. Overview
- 11.2.9.2. Products
- 11.2.9.3. SWOT Analysis
- 11.2.9.4. Recent Developments
- 11.2.9.5. Financials (Based on Availability)
- 11.2.10 Zaptest
- 11.2.10.1. Overview
- 11.2.10.2. Products
- 11.2.10.3. SWOT Analysis
- 11.2.10.4. Recent Developments
- 11.2.10.5. Financials (Based on Availability)
- 11.2.11 Testsigma
- 11.2.11.1. Overview
- 11.2.11.2. Products
- 11.2.11.3. SWOT Analysis
- 11.2.11.4. Recent Developments
- 11.2.11.5. Financials (Based on Availability)
- 11.2.12 Telerik Test Studio
- 11.2.12.1. Overview
- 11.2.12.2. Products
- 11.2.12.3. SWOT Analysis
- 11.2.12.4. Recent Developments
- 11.2.12.5. Financials (Based on Availability)
- 11.2.13 LambdaTest
- 11.2.13.1. Overview
- 11.2.13.2. Products
- 11.2.13.3. SWOT Analysis
- 11.2.13.4. Recent Developments
- 11.2.13.5. Financials (Based on Availability)
- 11.2.14 Cucumber
- 11.2.14.1. Overview
- 11.2.14.2. Products
- 11.2.14.3. SWOT Analysis
- 11.2.14.4. Recent Developments
- 11.2.14.5. Financials (Based on Availability)
- 11.2.15 TestingWhiz
- 11.2.15.1. Overview
- 11.2.15.2. Products
- 11.2.15.3. SWOT Analysis
- 11.2.15.4. Recent Developments
- 11.2.15.5. Financials (Based on Availability)
- 11.2.16 testRigor
- 11.2.16.1. Overview
- 11.2.16.2. Products
- 11.2.16.3. SWOT Analysis
- 11.2.16.4. Recent Developments
- 11.2.16.5. Financials (Based on Availability)
- 11.2.17 Autify
- 11.2.17.1. Overview
- 11.2.17.2. Products
- 11.2.17.3. SWOT Analysis
- 11.2.17.4. Recent Developments
- 11.2.17.5. Financials (Based on Availability)
- 11.2.18 QA Wolf
- 11.2.18.1. Overview
- 11.2.18.2. Products
- 11.2.18.3. SWOT Analysis
- 11.2.18.4. Recent Developments
- 11.2.18.5. Financials (Based on Availability)
- 11.2.19 TestRail
- 11.2.19.1. Overview
- 11.2.19.2. Products
- 11.2.19.3. SWOT Analysis
- 11.2.19.4. Recent Developments
- 11.2.19.5. Financials (Based on Availability)
- 11.2.20 Kualitee
- 11.2.20.1. Overview
- 11.2.20.2. Products
- 11.2.20.3. SWOT Analysis
- 11.2.20.4. Recent Developments
- 11.2.20.5. Financials (Based on Availability)
- 11.2.21 Kobiton
- 11.2.21.1. Overview
- 11.2.21.2. Products
- 11.2.21.3. SWOT Analysis
- 11.2.21.4. Recent Developments
- 11.2.21.5. Financials (Based on Availability)
- 11.2.22 Appsurify TestBrain
- 11.2.22.1. Overview
- 11.2.22.2. Products
- 11.2.22.3. SWOT Analysis
- 11.2.22.4. Recent Developments
- 11.2.22.5. Financials (Based on Availability)
- 11.2.23 Testim
- 11.2.23.1. Overview
- 11.2.23.2. Products
- 11.2.23.3. SWOT Analysis
- 11.2.23.4. Recent Developments
- 11.2.23.5. Financials (Based on Availability)
- 11.2.24 Xray
- 11.2.24.1. Overview
- 11.2.24.2. Products
- 11.2.24.3. SWOT Analysis
- 11.2.24.4. Recent Developments
- 11.2.24.5. Financials (Based on Availability)
- 11.2.25 PractiTest
- 11.2.25.1. Overview
- 11.2.25.2. Products
- 11.2.25.3. SWOT Analysis
- 11.2.25.4. Recent Developments
- 11.2.25.5. Financials (Based on Availability)
- 11.2.1 Rainforest QA
List of Figures
- Figure 1: Global Qa Testing Tool Revenue Breakdown (undefined, %) by Region 2025 & 2033
- Figure 2: North America Qa Testing Tool Revenue (undefined), by Application 2025 & 2033
- Figure 3: North America Qa Testing Tool Revenue Share (%), by Application 2025 & 2033
- Figure 4: North America Qa Testing Tool Revenue (undefined), by Type 2025 & 2033
- Figure 5: North America Qa Testing Tool Revenue Share (%), by Type 2025 & 2033
- Figure 6: North America Qa Testing Tool Revenue (undefined), by Country 2025 & 2033
- Figure 7: North America Qa Testing Tool Revenue Share (%), by Country 2025 & 2033
- Figure 8: South America Qa Testing Tool Revenue (undefined), by Application 2025 & 2033
- Figure 9: South America Qa Testing Tool Revenue Share (%), by Application 2025 & 2033
- Figure 10: South America Qa Testing Tool Revenue (undefined), by Type 2025 & 2033
- Figure 11: South America Qa Testing Tool Revenue Share (%), by Type 2025 & 2033
- Figure 12: South America Qa Testing Tool Revenue (undefined), by Country 2025 & 2033
- Figure 13: South America Qa Testing Tool Revenue Share (%), by Country 2025 & 2033
- Figure 14: Europe Qa Testing Tool Revenue (undefined), by Application 2025 & 2033
- Figure 15: Europe Qa Testing Tool Revenue Share (%), by Application 2025 & 2033
- Figure 16: Europe Qa Testing Tool Revenue (undefined), by Type 2025 & 2033
- Figure 17: Europe Qa Testing Tool Revenue Share (%), by Type 2025 & 2033
- Figure 18: Europe Qa Testing Tool Revenue (undefined), by Country 2025 & 2033
- Figure 19: Europe Qa Testing Tool Revenue Share (%), by Country 2025 & 2033
- Figure 20: Middle East & Africa Qa Testing Tool Revenue (undefined), by Application 2025 & 2033
- Figure 21: Middle East & Africa Qa Testing Tool Revenue Share (%), by Application 2025 & 2033
- Figure 22: Middle East & Africa Qa Testing Tool Revenue (undefined), by Type 2025 & 2033
- Figure 23: Middle East & Africa Qa Testing Tool Revenue Share (%), by Type 2025 & 2033
- Figure 24: Middle East & Africa Qa Testing Tool Revenue (undefined), by Country 2025 & 2033
- Figure 25: Middle East & Africa Qa Testing Tool Revenue Share (%), by Country 2025 & 2033
- Figure 26: Asia Pacific Qa Testing Tool Revenue (undefined), by Application 2025 & 2033
- Figure 27: Asia Pacific Qa Testing Tool Revenue Share (%), by Application 2025 & 2033
- Figure 28: Asia Pacific Qa Testing Tool Revenue (undefined), by Type 2025 & 2033
- Figure 29: Asia Pacific Qa Testing Tool Revenue Share (%), by Type 2025 & 2033
- Figure 30: Asia Pacific Qa Testing Tool Revenue (undefined), by Country 2025 & 2033
- Figure 31: Asia Pacific Qa Testing Tool Revenue Share (%), by Country 2025 & 2033
List of Tables
- Table 1: Global Qa Testing Tool Revenue undefined Forecast, by Application 2020 & 2033
- Table 2: Global Qa Testing Tool Revenue undefined Forecast, by Type 2020 & 2033
- Table 3: Global Qa Testing Tool Revenue undefined Forecast, by Region 2020 & 2033
- Table 4: Global Qa Testing Tool Revenue undefined Forecast, by Application 2020 & 2033
- Table 5: Global Qa Testing Tool Revenue undefined Forecast, by Type 2020 & 2033
- Table 6: Global Qa Testing Tool Revenue undefined Forecast, by Country 2020 & 2033
- Table 7: United States Qa Testing Tool Revenue (undefined) Forecast, by Application 2020 & 2033
- Table 8: Canada Qa Testing Tool Revenue (undefined) Forecast, by Application 2020 & 2033
- Table 9: Mexico Qa Testing Tool Revenue (undefined) Forecast, by Application 2020 & 2033
- Table 10: Global Qa Testing Tool Revenue undefined Forecast, by Application 2020 & 2033
- Table 11: Global Qa Testing Tool Revenue undefined Forecast, by Type 2020 & 2033
- Table 12: Global Qa Testing Tool Revenue undefined Forecast, by Country 2020 & 2033
- Table 13: Brazil Qa Testing Tool Revenue (undefined) Forecast, by Application 2020 & 2033
- Table 14: Argentina Qa Testing Tool Revenue (undefined) Forecast, by Application 2020 & 2033
- Table 15: Rest of South America Qa Testing Tool Revenue (undefined) Forecast, by Application 2020 & 2033
- Table 16: Global Qa Testing Tool Revenue undefined Forecast, by Application 2020 & 2033
- Table 17: Global Qa Testing Tool Revenue undefined Forecast, by Type 2020 & 2033
- Table 18: Global Qa Testing Tool Revenue undefined Forecast, by Country 2020 & 2033
- Table 19: United Kingdom Qa Testing Tool Revenue (undefined) Forecast, by Application 2020 & 2033
- Table 20: Germany Qa Testing Tool Revenue (undefined) Forecast, by Application 2020 & 2033
- Table 21: France Qa Testing Tool Revenue (undefined) Forecast, by Application 2020 & 2033
- Table 22: Italy Qa Testing Tool Revenue (undefined) Forecast, by Application 2020 & 2033
- Table 23: Spain Qa Testing Tool Revenue (undefined) Forecast, by Application 2020 & 2033
- Table 24: Russia Qa Testing Tool Revenue (undefined) Forecast, by Application 2020 & 2033
- Table 25: Benelux Qa Testing Tool Revenue (undefined) Forecast, by Application 2020 & 2033
- Table 26: Nordics Qa Testing Tool Revenue (undefined) Forecast, by Application 2020 & 2033
- Table 27: Rest of Europe Qa Testing Tool Revenue (undefined) Forecast, by Application 2020 & 2033
- Table 28: Global Qa Testing Tool Revenue undefined Forecast, by Application 2020 & 2033
- Table 29: Global Qa Testing Tool Revenue undefined Forecast, by Type 2020 & 2033
- Table 30: Global Qa Testing Tool Revenue undefined Forecast, by Country 2020 & 2033
- Table 31: Turkey Qa Testing Tool Revenue (undefined) Forecast, by Application 2020 & 2033
- Table 32: Israel Qa Testing Tool Revenue (undefined) Forecast, by Application 2020 & 2033
- Table 33: GCC Qa Testing Tool Revenue (undefined) Forecast, by Application 2020 & 2033
- Table 34: North Africa Qa Testing Tool Revenue (undefined) Forecast, by Application 2020 & 2033
- Table 35: South Africa Qa Testing Tool Revenue (undefined) Forecast, by Application 2020 & 2033
- Table 36: Rest of Middle East & Africa Qa Testing Tool Revenue (undefined) Forecast, by Application 2020 & 2033
- Table 37: Global Qa Testing Tool Revenue undefined Forecast, by Application 2020 & 2033
- Table 38: Global Qa Testing Tool Revenue undefined Forecast, by Type 2020 & 2033
- Table 39: Global Qa Testing Tool Revenue undefined Forecast, by Country 2020 & 2033
- Table 40: China Qa Testing Tool Revenue (undefined) Forecast, by Application 2020 & 2033
- Table 41: India Qa Testing Tool Revenue (undefined) Forecast, by Application 2020 & 2033
- Table 42: Japan Qa Testing Tool Revenue (undefined) Forecast, by Application 2020 & 2033
- Table 43: South Korea Qa Testing Tool Revenue (undefined) Forecast, by Application 2020 & 2033
- Table 44: ASEAN Qa Testing Tool Revenue (undefined) Forecast, by Application 2020 & 2033
- Table 45: Oceania Qa Testing Tool Revenue (undefined) Forecast, by Application 2020 & 2033
- Table 46: Rest of Asia Pacific Qa Testing Tool Revenue (undefined) Forecast, by Application 2020 & 2033
Frequently Asked Questions
1. What is the projected Compound Annual Growth Rate (CAGR) of the Qa Testing Tool?
The projected CAGR is approximately 22.3%.
2. Which companies are prominent players in the Qa Testing Tool?
Key companies in the market include Rainforest QA, Selenium, Cypress, Katalon Studio, Testim.io, Appium, Mabl, GlowTouch Technologies, Ranorex, Zaptest, Testsigma, Telerik Test Studio, LambdaTest, Cucumber, TestingWhiz, testRigor, Autify, QA Wolf, TestRail, Kualitee, Kobiton, Appsurify TestBrain, Testim, Xray, PractiTest.
3. What are the main segments of the Qa Testing Tool?
The market segments include Application, Type.
4. Can you provide details about the market size?
The market size is estimated to be USD XXX N/A as of 2022.
5. What are some drivers contributing to market growth?
N/A
6. What are the notable trends driving market growth?
N/A
7. Are there any restraints impacting market growth?
N/A
8. Can you provide examples of recent developments in the market?
N/A
9. What pricing options are available for accessing the report?
Pricing options include single-user, multi-user, and enterprise licenses priced at USD 2900.00, USD 4350.00, and USD 5800.00 respectively.
10. Is the market size provided in terms of value or volume?
The market size is provided in terms of value, measured in N/A.
11. Are there any specific market keywords associated with the report?
Yes, the market keyword associated with the report is "Qa Testing Tool," which aids in identifying and referencing the specific market segment covered.
12. How do I determine which pricing option suits my needs best?
The pricing options vary based on user requirements and access needs. Individual users may opt for single-user licenses, while businesses requiring broader access may choose multi-user or enterprise licenses for cost-effective access to the report.
13. Are there any additional resources or data provided in the Qa Testing Tool report?
While the report offers comprehensive insights, it's advisable to review the specific contents or supplementary materials provided to ascertain if additional resources or data are available.
14. How can I stay updated on further developments or reports in the Qa Testing Tool?
To stay informed about further developments, trends, and reports in the Qa Testing Tool, consider subscribing to industry newsletters, following relevant companies and organizations, or regularly checking reputable industry news sources and publications.
Methodology
Step 1 - Identification of Relevant Samples Size from Population Database


Step 2 - Approaches for Defining Global Market Size (Value, Volume* & Price*)

Note*: In applicable scenarios
Step 3 - Data Sources
Primary Research
- Web Analytics
- Survey Reports
- Research Institute
- Latest Research Reports
- Opinion Leaders
Secondary Research
- Annual Reports
- White Paper
- Latest Press Release
- Industry Association
- Paid Database
- Investor Presentations

Step 4 - Data Triangulation
Involves using different sources of information in order to increase the validity of a study
These sources are likely to be stakeholders in a program - participants, other researchers, program staff, other community members, and so on.
Then we put all data in single framework & apply various statistical tools to find out the dynamic on the market.
During the analysis stage, feedback from the stakeholder groups would be compared to determine areas of agreement as well as areas of divergence