

Key Insights
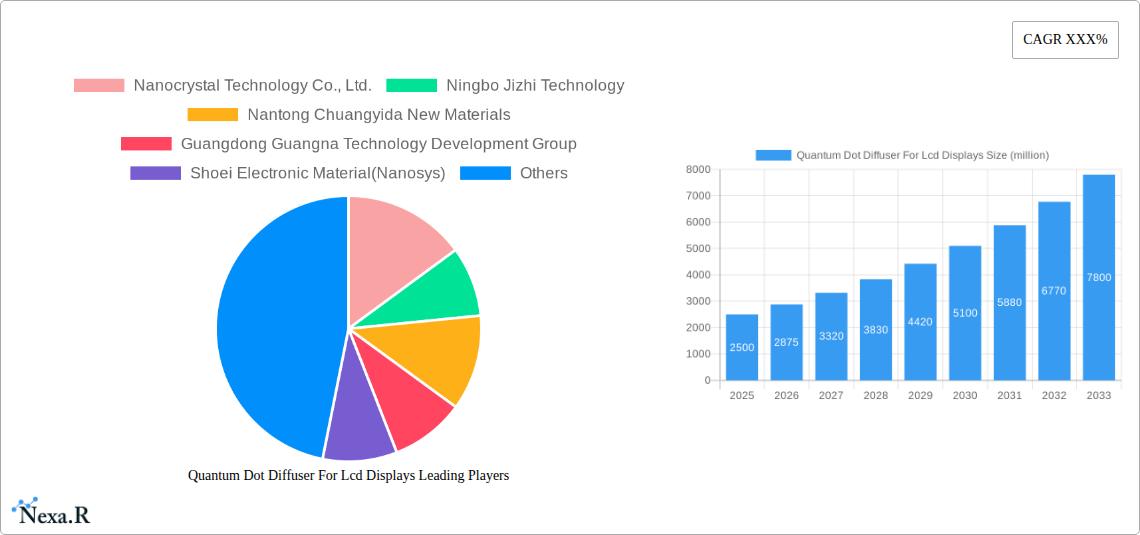
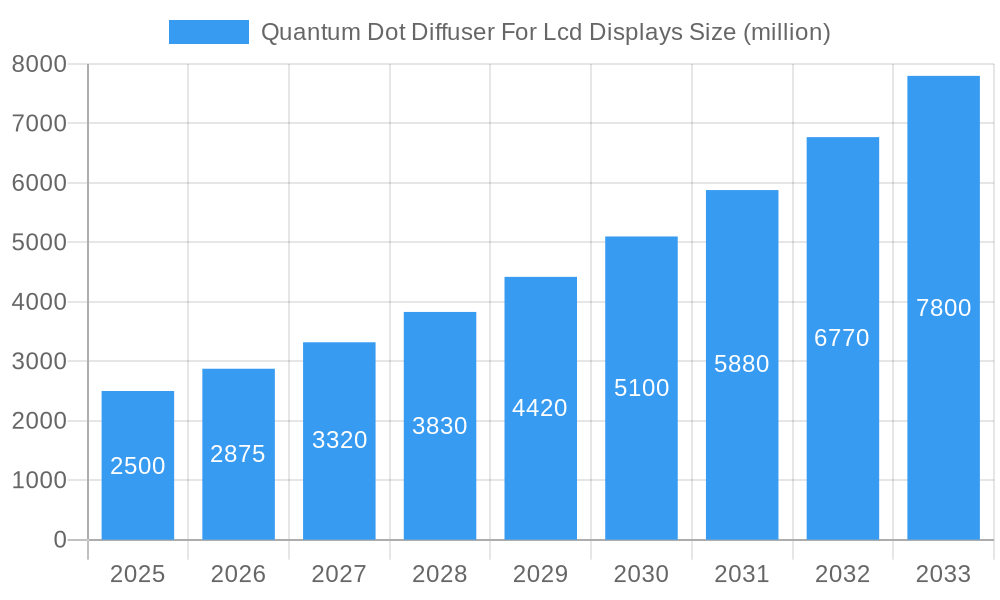
The Quantum Dot Diffuser (QDD) for LCD displays market is experiencing robust growth, driven by increasing demand for high-resolution, vibrant displays in consumer electronics and commercial applications. The market, estimated at $2.5 billion in 2025, is projected to exhibit a Compound Annual Growth Rate (CAGR) of 15% from 2025 to 2033, reaching approximately $8 billion by 2033. This expansion is fueled by several key factors. The ongoing shift towards larger screen sizes in televisions and monitors necessitates enhanced color reproduction and brightness, which QDDs excel at delivering. Furthermore, the rising adoption of mini-LED backlighting technology in LCD displays synergistically complements QDDs, resulting in superior image quality and energy efficiency. Technological advancements leading to improved quantum dot material synthesis and enhanced diffuser designs are also contributing to market growth. Key players like Nanosys, 3M, and LG Display are driving innovation and expanding their product portfolios, further fueling market competition and fostering development. However, the market faces challenges, including the high manufacturing cost of QDDs and the emerging competition from OLED and microLED display technologies.
Quantum Dot Diffuser For Lcd Displays Market Size (In Billion)
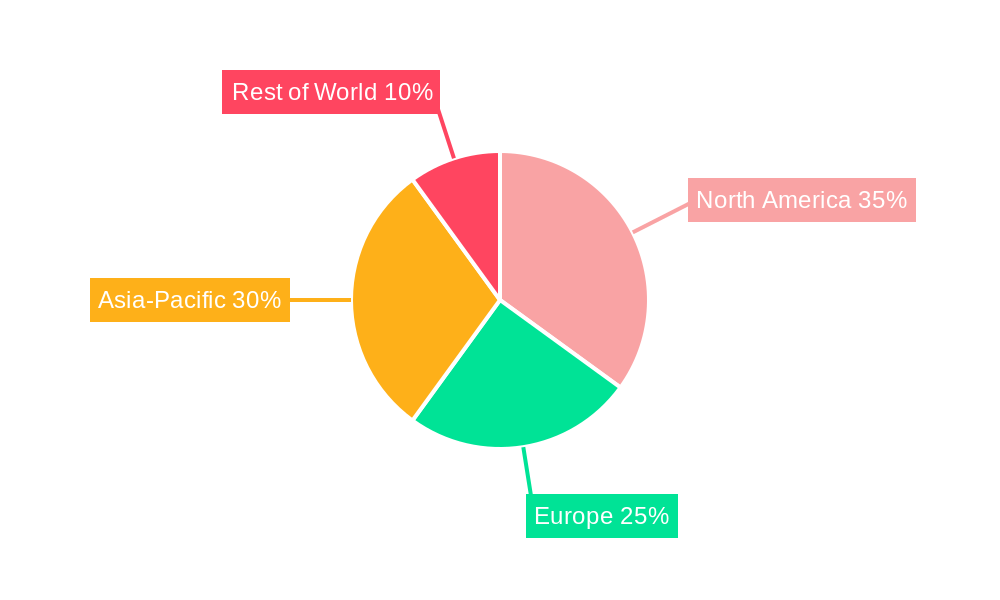
Despite these restraints, the continued demand for superior visual experiences in various applications, such as gaming monitors, high-end televisions, and commercial signage, will maintain a strong growth trajectory for the QDD market. Regional variations exist, with North America and Asia-Pacific expected to dominate market share due to high consumer electronics adoption rates and robust manufacturing capacities. The competitive landscape is dynamic, featuring both established players and emerging companies. Companies are focusing on strategic partnerships, mergers, and acquisitions to expand their market presence and technological capabilities. The future of the QDD market hinges on continuous innovation, cost reduction, and the ability to effectively compete against alternative display technologies. Nevertheless, the market's inherent advantages in terms of cost-effectiveness and color performance compared to OLED and its suitability for large-screen applications suggest a promising future for QDDs in LCD displays.
Quantum Dot Diffuser For Lcd Displays Company Market Share
Quantum Dot Diffuser For LCD Displays Market Report: 2019-2033
This comprehensive report provides an in-depth analysis of the Quantum Dot Diffuser for LCD Displays market, encompassing market dynamics, growth trends, regional analysis, competitive landscape, and future outlook. The study period covers 2019-2033, with 2025 as the base and estimated year. This report is crucial for industry professionals, investors, and researchers seeking a clear understanding of this rapidly evolving sector within the broader LCD display and semiconductor markets.
Parent Market: LCD Display Market (Projected Market Size in 2025: $xx Billion) Child Market: Quantum Dot Technology Market (Projected Market Size in 2025: $xx Billion)
Quantum Dot Diffuser For LCD Displays Market Dynamics & Structure
The Quantum Dot Diffuser for LCD Displays market is characterized by moderate concentration, with key players holding significant market share. Technological innovation, driven by advancements in quantum dot synthesis and diffuser design, is a primary growth driver. Stringent regulatory frameworks concerning material safety and environmental impact influence market dynamics. Competitive substitutes, such as traditional LCD backlighting solutions, continue to exert pressure. The end-user demographic is primarily focused on consumer electronics manufacturers and display panel producers. M&A activity has been relatively moderate, with a few strategic acquisitions aimed at securing technology or expanding market reach. Over the forecast period, market concentration is expected to remain relatively stable, although aggressive innovation by smaller players could potentially disrupt this trend.
- Market Concentration: Moderately Concentrated (Top 5 players hold approximately xx% market share in 2025)
- Technological Innovation: Focus on improved color gamut, brightness, and energy efficiency.
- Regulatory Framework: Compliance with RoHS and REACH directives.
- Competitive Substitutes: Traditional LCD backlighting, OLED displays.
- M&A Activity: xx deals recorded between 2019-2024, with an average deal value of $xx million.
- Innovation Barriers: High R&D costs, complex manufacturing processes.
Quantum Dot Diffuser For LCD Displays Growth Trends & Insights
The Quantum Dot Diffuser for LCD Displays market exhibited strong growth during the historical period (2019-2024), fueled by increasing demand for high-quality displays in consumer electronics and commercial applications. The market is projected to maintain a healthy Compound Annual Growth Rate (CAGR) of xx% during the forecast period (2025-2033), driven by factors such as rising adoption rates in premium LCD TVs, increasing penetration in laptops and monitors, and continued technological advancements leading to enhanced performance and reduced costs. Consumer demand for brighter, more vibrant displays and the rising popularity of large-screen TVs are key drivers. Disruptive technologies, such as microLED, pose a long-term threat, although the cost-effectiveness of quantum dot technology in the short-medium term gives it a significant competitive advantage.
- Market Size (2025): $xx Billion
- CAGR (2025-2033): xx%
- Market Penetration (2025): xx% in the premium LCD TV segment.
- Technological Disruptions: MicroLED, OLED technology.
- Consumer Behavior Shifts: Preference for larger screens, superior picture quality.
Dominant Regions, Countries, or Segments in Quantum Dot Diffuser For Lcd Displays
The Asia-Pacific region, particularly China, South Korea, and Taiwan, is projected to dominate the Quantum Dot Diffuser for LCD Displays market during the forecast period, due to the presence of large-scale LCD panel manufacturers and a strong consumer electronics market. North America and Europe are expected to witness significant growth, driven by increasing demand for premium displays in consumer and professional applications. The segment with the largest market share is currently the television sector, although growth in other segments such as monitors and laptops is considerable.
- Dominant Region: Asia-Pacific (Holding approximately xx% of global market share in 2025)
- Key Drivers (Asia-Pacific): Strong manufacturing base, large consumer electronics market, government support for technological advancements.
- Key Drivers (North America/Europe): High disposable income, preference for high-quality displays.
- Market Share by Segment (2025): Televisions (xx%), Monitors (xx%), Laptops (xx%), Others (xx%)
Quantum Dot Diffuser For LCD Displays Product Landscape
Quantum dot diffusers are increasingly sophisticated, featuring advancements in quantum dot material synthesis, enabling improved color purity and efficiency. New designs are focused on reducing light leakage and improving uniformity of illumination across the display, resulting in superior image quality. Applications span various display sizes and resolutions, from small mobile screens to large-format televisions. Unique selling propositions include enhanced color gamut, increased brightness, and improved energy efficiency.
Key Drivers, Barriers & Challenges in Quantum Dot Diffuser For Lcd Displays
Key Drivers: Increasing demand for high-quality displays, cost reduction in quantum dot material synthesis, and the development of advanced diffuser designs are propelling market growth. The growing popularity of large-screen TVs and adoption in other applications such as laptops and monitors is also a significant driving force.
Key Challenges: Supply chain disruptions related to raw materials, fluctuations in raw material prices, potential environmental concerns related to quantum dot synthesis, and intense competition from alternative display technologies pose challenges.
Emerging Opportunities in Quantum Dot Diffuser For Lcd Displays
Untapped market opportunities lie in emerging economies with growing disposable incomes and expanding consumer electronics markets. The integration of quantum dot diffusers into emerging display technologies, such as microLED backlighting, presents significant potential. Evolving consumer preferences towards foldable and flexible displays create opportunities for innovation in diffuser designs.
Growth Accelerators in the Quantum Dot Diffuser For Lcd Displays Industry
Technological breakthroughs in quantum dot synthesis and diffuser design, combined with strategic partnerships between material suppliers, display manufacturers, and brands, are accelerating market growth. Expansion into new applications, such as automotive displays, and aggressive marketing strategies driving consumer awareness are playing a key role.
Key Players Shaping the Quantum Dot Diffuser For Lcd Displays Market
- Nanocrystal Technology Co., Ltd.
- Ningbo Jizhi Technology
- Nantong Chuangyida New Materials
- Guangdong Guangna Technology Development Group
- Shoei Electronic Material (Nanosys)
- Mesolight
- Migo
- 3M
- LG
Notable Milestones in Quantum Dot Diffuser For Lcd Displays Sector
- 2020, Q4: Nanosys launched a new generation of quantum dots with enhanced color performance.
- 2022, Q2: 3M announced a strategic partnership with a major LCD panel manufacturer.
- 2023, Q1: LG Display introduced a new line of quantum dot enhanced LCD TVs.
In-Depth Quantum Dot Diffuser For LCD Displays Market Outlook
The Quantum Dot Diffuser for LCD Displays market is poised for continued growth, driven by ongoing technological advancements, increasing adoption rates, and expansion into new applications. Strategic partnerships, focused R&D efforts, and effective marketing campaigns will shape future market dynamics. The potential for significant market expansion in emerging regions and the integration of quantum dots into other display technologies presents substantial long-term growth opportunities.
Quantum Dot Diffuser For Lcd Displays Segmentation
-
1. Application
- 1.1. LCD TV
- 1.2. Computer Monitor
- 1.3. Mobile Device
- 1.4. Other
-
2. Type
- 2.1. PMMA
- 2.2. PS
- 2.3. Other
Quantum Dot Diffuser For Lcd Displays Segmentation By Geography
-
1. North America
- 1.1. United States
- 1.2. Canada
- 1.3. Mexico
-
2. South America
- 2.1. Brazil
- 2.2. Argentina
- 2.3. Rest of South America
-
3. Europe
- 3.1. United Kingdom
- 3.2. Germany
- 3.3. France
- 3.4. Italy
- 3.5. Spain
- 3.6. Russia
- 3.7. Benelux
- 3.8. Nordics
- 3.9. Rest of Europe
-
4. Middle East & Africa
- 4.1. Turkey
- 4.2. Israel
- 4.3. GCC
- 4.4. North Africa
- 4.5. South Africa
- 4.6. Rest of Middle East & Africa
-
5. Asia Pacific
- 5.1. China
- 5.2. India
- 5.3. Japan
- 5.4. South Korea
- 5.5. ASEAN
- 5.6. Oceania
- 5.7. Rest of Asia Pacific
Quantum Dot Diffuser For Lcd Displays Regional Market Share
Geographic Coverage of Quantum Dot Diffuser For Lcd Displays
Quantum Dot Diffuser For Lcd Displays REPORT HIGHLIGHTS
| Aspects | Details |
|---|---|
| Study Period | 2020-2034 |
| Base Year | 2025 |
| Estimated Year | 2026 |
| Forecast Period | 2026-2034 |
| Historical Period | 2020-2025 |
| Growth Rate | CAGR of XXX% from 2020-2034 |
| Segmentation |
|
Table of Contents
- 1. Introduction
- 1.1. Research Scope
- 1.2. Market Segmentation
- 1.3. Research Methodology
- 1.4. Definitions and Assumptions
- 2. Executive Summary
- 2.1. Introduction
- 3. Market Dynamics
- 3.1. Introduction
- 3.2. Market Drivers
- 3.3. Market Restrains
- 3.4. Market Trends
- 4. Market Factor Analysis
- 4.1. Porters Five Forces
- 4.2. Supply/Value Chain
- 4.3. PESTEL analysis
- 4.4. Market Entropy
- 4.5. Patent/Trademark Analysis
- 5. Global Quantum Dot Diffuser For Lcd Displays Analysis, Insights and Forecast, 2020-2032
- 5.1. Market Analysis, Insights and Forecast - by Application
- 5.1.1. LCD TV
- 5.1.2. Computer Monitor
- 5.1.3. Mobile Device
- 5.1.4. Other
- 5.2. Market Analysis, Insights and Forecast - by Type
- 5.2.1. PMMA
- 5.2.2. PS
- 5.2.3. Other
- 5.3. Market Analysis, Insights and Forecast - by Region
- 5.3.1. North America
- 5.3.2. South America
- 5.3.3. Europe
- 5.3.4. Middle East & Africa
- 5.3.5. Asia Pacific
- 5.1. Market Analysis, Insights and Forecast - by Application
- 6. North America Quantum Dot Diffuser For Lcd Displays Analysis, Insights and Forecast, 2020-2032
- 6.1. Market Analysis, Insights and Forecast - by Application
- 6.1.1. LCD TV
- 6.1.2. Computer Monitor
- 6.1.3. Mobile Device
- 6.1.4. Other
- 6.2. Market Analysis, Insights and Forecast - by Type
- 6.2.1. PMMA
- 6.2.2. PS
- 6.2.3. Other
- 6.1. Market Analysis, Insights and Forecast - by Application
- 7. South America Quantum Dot Diffuser For Lcd Displays Analysis, Insights and Forecast, 2020-2032
- 7.1. Market Analysis, Insights and Forecast - by Application
- 7.1.1. LCD TV
- 7.1.2. Computer Monitor
- 7.1.3. Mobile Device
- 7.1.4. Other
- 7.2. Market Analysis, Insights and Forecast - by Type
- 7.2.1. PMMA
- 7.2.2. PS
- 7.2.3. Other
- 7.1. Market Analysis, Insights and Forecast - by Application
- 8. Europe Quantum Dot Diffuser For Lcd Displays Analysis, Insights and Forecast, 2020-2032
- 8.1. Market Analysis, Insights and Forecast - by Application
- 8.1.1. LCD TV
- 8.1.2. Computer Monitor
- 8.1.3. Mobile Device
- 8.1.4. Other
- 8.2. Market Analysis, Insights and Forecast - by Type
- 8.2.1. PMMA
- 8.2.2. PS
- 8.2.3. Other
- 8.1. Market Analysis, Insights and Forecast - by Application
- 9. Middle East & Africa Quantum Dot Diffuser For Lcd Displays Analysis, Insights and Forecast, 2020-2032
- 9.1. Market Analysis, Insights and Forecast - by Application
- 9.1.1. LCD TV
- 9.1.2. Computer Monitor
- 9.1.3. Mobile Device
- 9.1.4. Other
- 9.2. Market Analysis, Insights and Forecast - by Type
- 9.2.1. PMMA
- 9.2.2. PS
- 9.2.3. Other
- 9.1. Market Analysis, Insights and Forecast - by Application
- 10. Asia Pacific Quantum Dot Diffuser For Lcd Displays Analysis, Insights and Forecast, 2020-2032
- 10.1. Market Analysis, Insights and Forecast - by Application
- 10.1.1. LCD TV
- 10.1.2. Computer Monitor
- 10.1.3. Mobile Device
- 10.1.4. Other
- 10.2. Market Analysis, Insights and Forecast - by Type
- 10.2.1. PMMA
- 10.2.2. PS
- 10.2.3. Other
- 10.1. Market Analysis, Insights and Forecast - by Application
- 11. Competitive Analysis
- 11.1. Global Market Share Analysis 2025
- 11.2. Company Profiles
- 11.2.1 Nanocrystal Technology Co. Ltd.
- 11.2.1.1. Overview
- 11.2.1.2. Products
- 11.2.1.3. SWOT Analysis
- 11.2.1.4. Recent Developments
- 11.2.1.5. Financials (Based on Availability)
- 11.2.2 Ningbo Jizhi Technology
- 11.2.2.1. Overview
- 11.2.2.2. Products
- 11.2.2.3. SWOT Analysis
- 11.2.2.4. Recent Developments
- 11.2.2.5. Financials (Based on Availability)
- 11.2.3 Nantong Chuangyida New Materials
- 11.2.3.1. Overview
- 11.2.3.2. Products
- 11.2.3.3. SWOT Analysis
- 11.2.3.4. Recent Developments
- 11.2.3.5. Financials (Based on Availability)
- 11.2.4 Guangdong Guangna Technology Development Group
- 11.2.4.1. Overview
- 11.2.4.2. Products
- 11.2.4.3. SWOT Analysis
- 11.2.4.4. Recent Developments
- 11.2.4.5. Financials (Based on Availability)
- 11.2.5 Shoei Electronic Material(Nanosys)
- 11.2.5.1. Overview
- 11.2.5.2. Products
- 11.2.5.3. SWOT Analysis
- 11.2.5.4. Recent Developments
- 11.2.5.5. Financials (Based on Availability)
- 11.2.6 Mesolight
- 11.2.6.1. Overview
- 11.2.6.2. Products
- 11.2.6.3. SWOT Analysis
- 11.2.6.4. Recent Developments
- 11.2.6.5. Financials (Based on Availability)
- 11.2.7 Migo
- 11.2.7.1. Overview
- 11.2.7.2. Products
- 11.2.7.3. SWOT Analysis
- 11.2.7.4. Recent Developments
- 11.2.7.5. Financials (Based on Availability)
- 11.2.8 3M
- 11.2.8.1. Overview
- 11.2.8.2. Products
- 11.2.8.3. SWOT Analysis
- 11.2.8.4. Recent Developments
- 11.2.8.5. Financials (Based on Availability)
- 11.2.9 LG
- 11.2.9.1. Overview
- 11.2.9.2. Products
- 11.2.9.3. SWOT Analysis
- 11.2.9.4. Recent Developments
- 11.2.9.5. Financials (Based on Availability)
- 11.2.1 Nanocrystal Technology Co. Ltd.
List of Figures
- Figure 1: Global Quantum Dot Diffuser For Lcd Displays Revenue Breakdown (million, %) by Region 2025 & 2033
- Figure 2: Global Quantum Dot Diffuser For Lcd Displays Volume Breakdown (K, %) by Region 2025 & 2033
- Figure 3: North America Quantum Dot Diffuser For Lcd Displays Revenue (million), by Application 2025 & 2033
- Figure 4: North America Quantum Dot Diffuser For Lcd Displays Volume (K), by Application 2025 & 2033
- Figure 5: North America Quantum Dot Diffuser For Lcd Displays Revenue Share (%), by Application 2025 & 2033
- Figure 6: North America Quantum Dot Diffuser For Lcd Displays Volume Share (%), by Application 2025 & 2033
- Figure 7: North America Quantum Dot Diffuser For Lcd Displays Revenue (million), by Type 2025 & 2033
- Figure 8: North America Quantum Dot Diffuser For Lcd Displays Volume (K), by Type 2025 & 2033
- Figure 9: North America Quantum Dot Diffuser For Lcd Displays Revenue Share (%), by Type 2025 & 2033
- Figure 10: North America Quantum Dot Diffuser For Lcd Displays Volume Share (%), by Type 2025 & 2033
- Figure 11: North America Quantum Dot Diffuser For Lcd Displays Revenue (million), by Country 2025 & 2033
- Figure 12: North America Quantum Dot Diffuser For Lcd Displays Volume (K), by Country 2025 & 2033
- Figure 13: North America Quantum Dot Diffuser For Lcd Displays Revenue Share (%), by Country 2025 & 2033
- Figure 14: North America Quantum Dot Diffuser For Lcd Displays Volume Share (%), by Country 2025 & 2033
- Figure 15: South America Quantum Dot Diffuser For Lcd Displays Revenue (million), by Application 2025 & 2033
- Figure 16: South America Quantum Dot Diffuser For Lcd Displays Volume (K), by Application 2025 & 2033
- Figure 17: South America Quantum Dot Diffuser For Lcd Displays Revenue Share (%), by Application 2025 & 2033
- Figure 18: South America Quantum Dot Diffuser For Lcd Displays Volume Share (%), by Application 2025 & 2033
- Figure 19: South America Quantum Dot Diffuser For Lcd Displays Revenue (million), by Type 2025 & 2033
- Figure 20: South America Quantum Dot Diffuser For Lcd Displays Volume (K), by Type 2025 & 2033
- Figure 21: South America Quantum Dot Diffuser For Lcd Displays Revenue Share (%), by Type 2025 & 2033
- Figure 22: South America Quantum Dot Diffuser For Lcd Displays Volume Share (%), by Type 2025 & 2033
- Figure 23: South America Quantum Dot Diffuser For Lcd Displays Revenue (million), by Country 2025 & 2033
- Figure 24: South America Quantum Dot Diffuser For Lcd Displays Volume (K), by Country 2025 & 2033
- Figure 25: South America Quantum Dot Diffuser For Lcd Displays Revenue Share (%), by Country 2025 & 2033
- Figure 26: South America Quantum Dot Diffuser For Lcd Displays Volume Share (%), by Country 2025 & 2033
- Figure 27: Europe Quantum Dot Diffuser For Lcd Displays Revenue (million), by Application 2025 & 2033
- Figure 28: Europe Quantum Dot Diffuser For Lcd Displays Volume (K), by Application 2025 & 2033
- Figure 29: Europe Quantum Dot Diffuser For Lcd Displays Revenue Share (%), by Application 2025 & 2033
- Figure 30: Europe Quantum Dot Diffuser For Lcd Displays Volume Share (%), by Application 2025 & 2033
- Figure 31: Europe Quantum Dot Diffuser For Lcd Displays Revenue (million), by Type 2025 & 2033
- Figure 32: Europe Quantum Dot Diffuser For Lcd Displays Volume (K), by Type 2025 & 2033
- Figure 33: Europe Quantum Dot Diffuser For Lcd Displays Revenue Share (%), by Type 2025 & 2033
- Figure 34: Europe Quantum Dot Diffuser For Lcd Displays Volume Share (%), by Type 2025 & 2033
- Figure 35: Europe Quantum Dot Diffuser For Lcd Displays Revenue (million), by Country 2025 & 2033
- Figure 36: Europe Quantum Dot Diffuser For Lcd Displays Volume (K), by Country 2025 & 2033
- Figure 37: Europe Quantum Dot Diffuser For Lcd Displays Revenue Share (%), by Country 2025 & 2033
- Figure 38: Europe Quantum Dot Diffuser For Lcd Displays Volume Share (%), by Country 2025 & 2033
- Figure 39: Middle East & Africa Quantum Dot Diffuser For Lcd Displays Revenue (million), by Application 2025 & 2033
- Figure 40: Middle East & Africa Quantum Dot Diffuser For Lcd Displays Volume (K), by Application 2025 & 2033
- Figure 41: Middle East & Africa Quantum Dot Diffuser For Lcd Displays Revenue Share (%), by Application 2025 & 2033
- Figure 42: Middle East & Africa Quantum Dot Diffuser For Lcd Displays Volume Share (%), by Application 2025 & 2033
- Figure 43: Middle East & Africa Quantum Dot Diffuser For Lcd Displays Revenue (million), by Type 2025 & 2033
- Figure 44: Middle East & Africa Quantum Dot Diffuser For Lcd Displays Volume (K), by Type 2025 & 2033
- Figure 45: Middle East & Africa Quantum Dot Diffuser For Lcd Displays Revenue Share (%), by Type 2025 & 2033
- Figure 46: Middle East & Africa Quantum Dot Diffuser For Lcd Displays Volume Share (%), by Type 2025 & 2033
- Figure 47: Middle East & Africa Quantum Dot Diffuser For Lcd Displays Revenue (million), by Country 2025 & 2033
- Figure 48: Middle East & Africa Quantum Dot Diffuser For Lcd Displays Volume (K), by Country 2025 & 2033
- Figure 49: Middle East & Africa Quantum Dot Diffuser For Lcd Displays Revenue Share (%), by Country 2025 & 2033
- Figure 50: Middle East & Africa Quantum Dot Diffuser For Lcd Displays Volume Share (%), by Country 2025 & 2033
- Figure 51: Asia Pacific Quantum Dot Diffuser For Lcd Displays Revenue (million), by Application 2025 & 2033
- Figure 52: Asia Pacific Quantum Dot Diffuser For Lcd Displays Volume (K), by Application 2025 & 2033
- Figure 53: Asia Pacific Quantum Dot Diffuser For Lcd Displays Revenue Share (%), by Application 2025 & 2033
- Figure 54: Asia Pacific Quantum Dot Diffuser For Lcd Displays Volume Share (%), by Application 2025 & 2033
- Figure 55: Asia Pacific Quantum Dot Diffuser For Lcd Displays Revenue (million), by Type 2025 & 2033
- Figure 56: Asia Pacific Quantum Dot Diffuser For Lcd Displays Volume (K), by Type 2025 & 2033
- Figure 57: Asia Pacific Quantum Dot Diffuser For Lcd Displays Revenue Share (%), by Type 2025 & 2033
- Figure 58: Asia Pacific Quantum Dot Diffuser For Lcd Displays Volume Share (%), by Type 2025 & 2033
- Figure 59: Asia Pacific Quantum Dot Diffuser For Lcd Displays Revenue (million), by Country 2025 & 2033
- Figure 60: Asia Pacific Quantum Dot Diffuser For Lcd Displays Volume (K), by Country 2025 & 2033
- Figure 61: Asia Pacific Quantum Dot Diffuser For Lcd Displays Revenue Share (%), by Country 2025 & 2033
- Figure 62: Asia Pacific Quantum Dot Diffuser For Lcd Displays Volume Share (%), by Country 2025 & 2033
List of Tables
- Table 1: Global Quantum Dot Diffuser For Lcd Displays Revenue million Forecast, by Application 2020 & 2033
- Table 2: Global Quantum Dot Diffuser For Lcd Displays Volume K Forecast, by Application 2020 & 2033
- Table 3: Global Quantum Dot Diffuser For Lcd Displays Revenue million Forecast, by Type 2020 & 2033
- Table 4: Global Quantum Dot Diffuser For Lcd Displays Volume K Forecast, by Type 2020 & 2033
- Table 5: Global Quantum Dot Diffuser For Lcd Displays Revenue million Forecast, by Region 2020 & 2033
- Table 6: Global Quantum Dot Diffuser For Lcd Displays Volume K Forecast, by Region 2020 & 2033
- Table 7: Global Quantum Dot Diffuser For Lcd Displays Revenue million Forecast, by Application 2020 & 2033
- Table 8: Global Quantum Dot Diffuser For Lcd Displays Volume K Forecast, by Application 2020 & 2033
- Table 9: Global Quantum Dot Diffuser For Lcd Displays Revenue million Forecast, by Type 2020 & 2033
- Table 10: Global Quantum Dot Diffuser For Lcd Displays Volume K Forecast, by Type 2020 & 2033
- Table 11: Global Quantum Dot Diffuser For Lcd Displays Revenue million Forecast, by Country 2020 & 2033
- Table 12: Global Quantum Dot Diffuser For Lcd Displays Volume K Forecast, by Country 2020 & 2033
- Table 13: United States Quantum Dot Diffuser For Lcd Displays Revenue (million) Forecast, by Application 2020 & 2033
- Table 14: United States Quantum Dot Diffuser For Lcd Displays Volume (K) Forecast, by Application 2020 & 2033
- Table 15: Canada Quantum Dot Diffuser For Lcd Displays Revenue (million) Forecast, by Application 2020 & 2033
- Table 16: Canada Quantum Dot Diffuser For Lcd Displays Volume (K) Forecast, by Application 2020 & 2033
- Table 17: Mexico Quantum Dot Diffuser For Lcd Displays Revenue (million) Forecast, by Application 2020 & 2033
- Table 18: Mexico Quantum Dot Diffuser For Lcd Displays Volume (K) Forecast, by Application 2020 & 2033
- Table 19: Global Quantum Dot Diffuser For Lcd Displays Revenue million Forecast, by Application 2020 & 2033
- Table 20: Global Quantum Dot Diffuser For Lcd Displays Volume K Forecast, by Application 2020 & 2033
- Table 21: Global Quantum Dot Diffuser For Lcd Displays Revenue million Forecast, by Type 2020 & 2033
- Table 22: Global Quantum Dot Diffuser For Lcd Displays Volume K Forecast, by Type 2020 & 2033
- Table 23: Global Quantum Dot Diffuser For Lcd Displays Revenue million Forecast, by Country 2020 & 2033
- Table 24: Global Quantum Dot Diffuser For Lcd Displays Volume K Forecast, by Country 2020 & 2033
- Table 25: Brazil Quantum Dot Diffuser For Lcd Displays Revenue (million) Forecast, by Application 2020 & 2033
- Table 26: Brazil Quantum Dot Diffuser For Lcd Displays Volume (K) Forecast, by Application 2020 & 2033
- Table 27: Argentina Quantum Dot Diffuser For Lcd Displays Revenue (million) Forecast, by Application 2020 & 2033
- Table 28: Argentina Quantum Dot Diffuser For Lcd Displays Volume (K) Forecast, by Application 2020 & 2033
- Table 29: Rest of South America Quantum Dot Diffuser For Lcd Displays Revenue (million) Forecast, by Application 2020 & 2033
- Table 30: Rest of South America Quantum Dot Diffuser For Lcd Displays Volume (K) Forecast, by Application 2020 & 2033
- Table 31: Global Quantum Dot Diffuser For Lcd Displays Revenue million Forecast, by Application 2020 & 2033
- Table 32: Global Quantum Dot Diffuser For Lcd Displays Volume K Forecast, by Application 2020 & 2033
- Table 33: Global Quantum Dot Diffuser For Lcd Displays Revenue million Forecast, by Type 2020 & 2033
- Table 34: Global Quantum Dot Diffuser For Lcd Displays Volume K Forecast, by Type 2020 & 2033
- Table 35: Global Quantum Dot Diffuser For Lcd Displays Revenue million Forecast, by Country 2020 & 2033
- Table 36: Global Quantum Dot Diffuser For Lcd Displays Volume K Forecast, by Country 2020 & 2033
- Table 37: United Kingdom Quantum Dot Diffuser For Lcd Displays Revenue (million) Forecast, by Application 2020 & 2033
- Table 38: United Kingdom Quantum Dot Diffuser For Lcd Displays Volume (K) Forecast, by Application 2020 & 2033
- Table 39: Germany Quantum Dot Diffuser For Lcd Displays Revenue (million) Forecast, by Application 2020 & 2033
- Table 40: Germany Quantum Dot Diffuser For Lcd Displays Volume (K) Forecast, by Application 2020 & 2033
- Table 41: France Quantum Dot Diffuser For Lcd Displays Revenue (million) Forecast, by Application 2020 & 2033
- Table 42: France Quantum Dot Diffuser For Lcd Displays Volume (K) Forecast, by Application 2020 & 2033
- Table 43: Italy Quantum Dot Diffuser For Lcd Displays Revenue (million) Forecast, by Application 2020 & 2033
- Table 44: Italy Quantum Dot Diffuser For Lcd Displays Volume (K) Forecast, by Application 2020 & 2033
- Table 45: Spain Quantum Dot Diffuser For Lcd Displays Revenue (million) Forecast, by Application 2020 & 2033
- Table 46: Spain Quantum Dot Diffuser For Lcd Displays Volume (K) Forecast, by Application 2020 & 2033
- Table 47: Russia Quantum Dot Diffuser For Lcd Displays Revenue (million) Forecast, by Application 2020 & 2033
- Table 48: Russia Quantum Dot Diffuser For Lcd Displays Volume (K) Forecast, by Application 2020 & 2033
- Table 49: Benelux Quantum Dot Diffuser For Lcd Displays Revenue (million) Forecast, by Application 2020 & 2033
- Table 50: Benelux Quantum Dot Diffuser For Lcd Displays Volume (K) Forecast, by Application 2020 & 2033
- Table 51: Nordics Quantum Dot Diffuser For Lcd Displays Revenue (million) Forecast, by Application 2020 & 2033
- Table 52: Nordics Quantum Dot Diffuser For Lcd Displays Volume (K) Forecast, by Application 2020 & 2033
- Table 53: Rest of Europe Quantum Dot Diffuser For Lcd Displays Revenue (million) Forecast, by Application 2020 & 2033
- Table 54: Rest of Europe Quantum Dot Diffuser For Lcd Displays Volume (K) Forecast, by Application 2020 & 2033
- Table 55: Global Quantum Dot Diffuser For Lcd Displays Revenue million Forecast, by Application 2020 & 2033
- Table 56: Global Quantum Dot Diffuser For Lcd Displays Volume K Forecast, by Application 2020 & 2033
- Table 57: Global Quantum Dot Diffuser For Lcd Displays Revenue million Forecast, by Type 2020 & 2033
- Table 58: Global Quantum Dot Diffuser For Lcd Displays Volume K Forecast, by Type 2020 & 2033
- Table 59: Global Quantum Dot Diffuser For Lcd Displays Revenue million Forecast, by Country 2020 & 2033
- Table 60: Global Quantum Dot Diffuser For Lcd Displays Volume K Forecast, by Country 2020 & 2033
- Table 61: Turkey Quantum Dot Diffuser For Lcd Displays Revenue (million) Forecast, by Application 2020 & 2033
- Table 62: Turkey Quantum Dot Diffuser For Lcd Displays Volume (K) Forecast, by Application 2020 & 2033
- Table 63: Israel Quantum Dot Diffuser For Lcd Displays Revenue (million) Forecast, by Application 2020 & 2033
- Table 64: Israel Quantum Dot Diffuser For Lcd Displays Volume (K) Forecast, by Application 2020 & 2033
- Table 65: GCC Quantum Dot Diffuser For Lcd Displays Revenue (million) Forecast, by Application 2020 & 2033
- Table 66: GCC Quantum Dot Diffuser For Lcd Displays Volume (K) Forecast, by Application 2020 & 2033
- Table 67: North Africa Quantum Dot Diffuser For Lcd Displays Revenue (million) Forecast, by Application 2020 & 2033
- Table 68: North Africa Quantum Dot Diffuser For Lcd Displays Volume (K) Forecast, by Application 2020 & 2033
- Table 69: South Africa Quantum Dot Diffuser For Lcd Displays Revenue (million) Forecast, by Application 2020 & 2033
- Table 70: South Africa Quantum Dot Diffuser For Lcd Displays Volume (K) Forecast, by Application 2020 & 2033
- Table 71: Rest of Middle East & Africa Quantum Dot Diffuser For Lcd Displays Revenue (million) Forecast, by Application 2020 & 2033
- Table 72: Rest of Middle East & Africa Quantum Dot Diffuser For Lcd Displays Volume (K) Forecast, by Application 2020 & 2033
- Table 73: Global Quantum Dot Diffuser For Lcd Displays Revenue million Forecast, by Application 2020 & 2033
- Table 74: Global Quantum Dot Diffuser For Lcd Displays Volume K Forecast, by Application 2020 & 2033
- Table 75: Global Quantum Dot Diffuser For Lcd Displays Revenue million Forecast, by Type 2020 & 2033
- Table 76: Global Quantum Dot Diffuser For Lcd Displays Volume K Forecast, by Type 2020 & 2033
- Table 77: Global Quantum Dot Diffuser For Lcd Displays Revenue million Forecast, by Country 2020 & 2033
- Table 78: Global Quantum Dot Diffuser For Lcd Displays Volume K Forecast, by Country 2020 & 2033
- Table 79: China Quantum Dot Diffuser For Lcd Displays Revenue (million) Forecast, by Application 2020 & 2033
- Table 80: China Quantum Dot Diffuser For Lcd Displays Volume (K) Forecast, by Application 2020 & 2033
- Table 81: India Quantum Dot Diffuser For Lcd Displays Revenue (million) Forecast, by Application 2020 & 2033
- Table 82: India Quantum Dot Diffuser For Lcd Displays Volume (K) Forecast, by Application 2020 & 2033
- Table 83: Japan Quantum Dot Diffuser For Lcd Displays Revenue (million) Forecast, by Application 2020 & 2033
- Table 84: Japan Quantum Dot Diffuser For Lcd Displays Volume (K) Forecast, by Application 2020 & 2033
- Table 85: South Korea Quantum Dot Diffuser For Lcd Displays Revenue (million) Forecast, by Application 2020 & 2033
- Table 86: South Korea Quantum Dot Diffuser For Lcd Displays Volume (K) Forecast, by Application 2020 & 2033
- Table 87: ASEAN Quantum Dot Diffuser For Lcd Displays Revenue (million) Forecast, by Application 2020 & 2033
- Table 88: ASEAN Quantum Dot Diffuser For Lcd Displays Volume (K) Forecast, by Application 2020 & 2033
- Table 89: Oceania Quantum Dot Diffuser For Lcd Displays Revenue (million) Forecast, by Application 2020 & 2033
- Table 90: Oceania Quantum Dot Diffuser For Lcd Displays Volume (K) Forecast, by Application 2020 & 2033
- Table 91: Rest of Asia Pacific Quantum Dot Diffuser For Lcd Displays Revenue (million) Forecast, by Application 2020 & 2033
- Table 92: Rest of Asia Pacific Quantum Dot Diffuser For Lcd Displays Volume (K) Forecast, by Application 2020 & 2033
Frequently Asked Questions
1. What is the projected Compound Annual Growth Rate (CAGR) of the Quantum Dot Diffuser For Lcd Displays?
The projected CAGR is approximately XXX%.
2. Which companies are prominent players in the Quantum Dot Diffuser For Lcd Displays?
Key companies in the market include Nanocrystal Technology Co., Ltd., Ningbo Jizhi Technology, Nantong Chuangyida New Materials, Guangdong Guangna Technology Development Group, Shoei Electronic Material(Nanosys), Mesolight, Migo, 3M, LG.
3. What are the main segments of the Quantum Dot Diffuser For Lcd Displays?
The market segments include Application, Type.
4. Can you provide details about the market size?
The market size is estimated to be USD XXX million as of 2022.
5. What are some drivers contributing to market growth?
N/A
6. What are the notable trends driving market growth?
N/A
7. Are there any restraints impacting market growth?
N/A
8. Can you provide examples of recent developments in the market?
N/A
9. What pricing options are available for accessing the report?
Pricing options include single-user, multi-user, and enterprise licenses priced at USD 3950.00, USD 5925.00, and USD 7900.00 respectively.
10. Is the market size provided in terms of value or volume?
The market size is provided in terms of value, measured in million and volume, measured in K.
11. Are there any specific market keywords associated with the report?
Yes, the market keyword associated with the report is "Quantum Dot Diffuser For Lcd Displays," which aids in identifying and referencing the specific market segment covered.
12. How do I determine which pricing option suits my needs best?
The pricing options vary based on user requirements and access needs. Individual users may opt for single-user licenses, while businesses requiring broader access may choose multi-user or enterprise licenses for cost-effective access to the report.
13. Are there any additional resources or data provided in the Quantum Dot Diffuser For Lcd Displays report?
While the report offers comprehensive insights, it's advisable to review the specific contents or supplementary materials provided to ascertain if additional resources or data are available.
14. How can I stay updated on further developments or reports in the Quantum Dot Diffuser For Lcd Displays?
To stay informed about further developments, trends, and reports in the Quantum Dot Diffuser For Lcd Displays, consider subscribing to industry newsletters, following relevant companies and organizations, or regularly checking reputable industry news sources and publications.
Methodology
Step 1 - Identification of Relevant Samples Size from Population Database


Step 2 - Approaches for Defining Global Market Size (Value, Volume* & Price*)

Note*: In applicable scenarios
Step 3 - Data Sources
Primary Research
- Web Analytics
- Survey Reports
- Research Institute
- Latest Research Reports
- Opinion Leaders
Secondary Research
- Annual Reports
- White Paper
- Latest Press Release
- Industry Association
- Paid Database
- Investor Presentations

Step 4 - Data Triangulation
Involves using different sources of information in order to increase the validity of a study
These sources are likely to be stakeholders in a program - participants, other researchers, program staff, other community members, and so on.
Then we put all data in single framework & apply various statistical tools to find out the dynamic on the market.
During the analysis stage, feedback from the stakeholder groups would be compared to determine areas of agreement as well as areas of divergence