

Key Insights
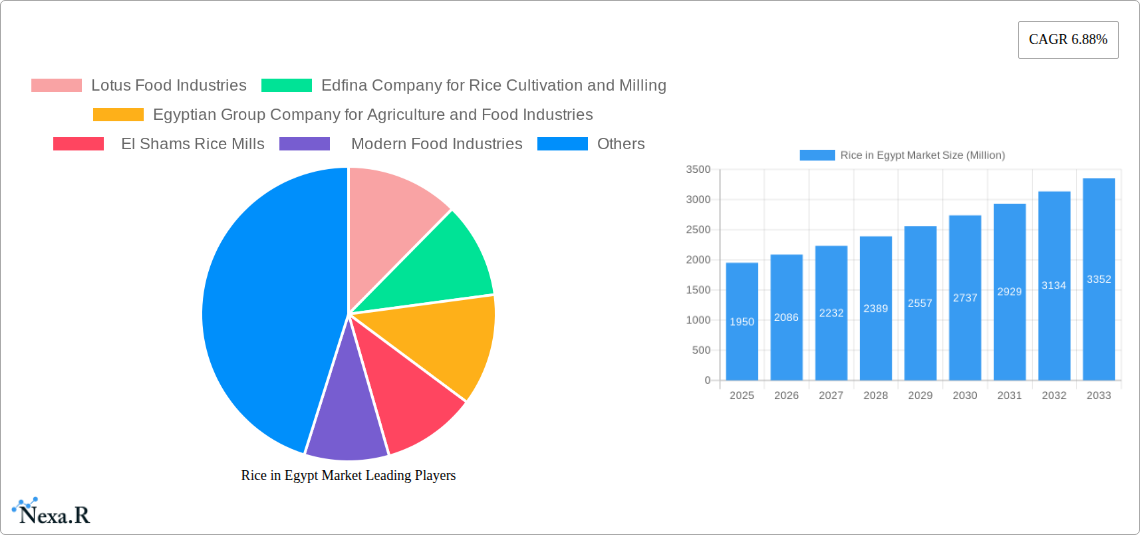
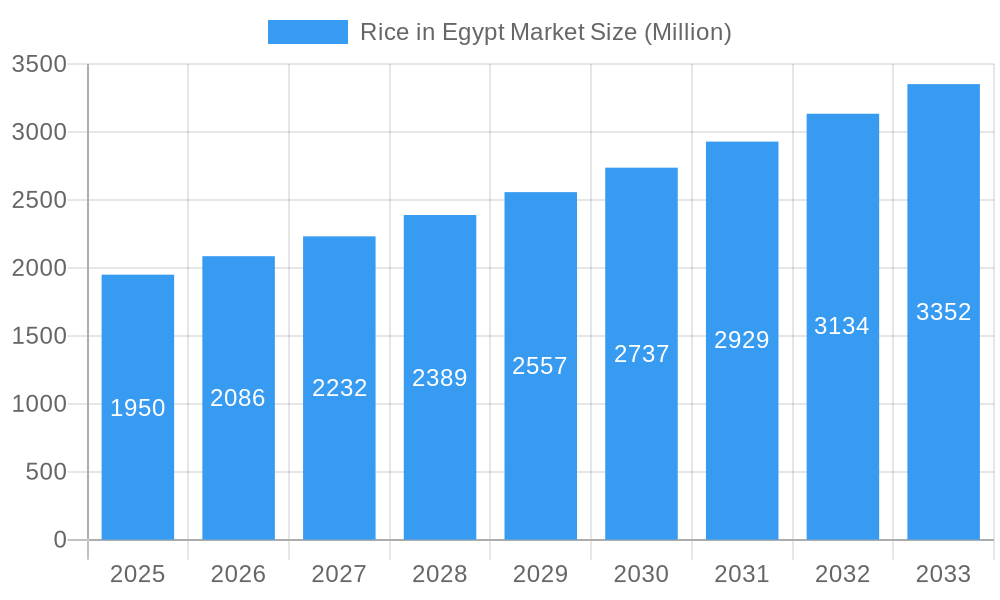
The Egyptian rice market, valued at $1.95 billion in 2025, exhibits robust growth potential, projected to expand at a compound annual growth rate (CAGR) of 6.88% from 2025 to 2033. This growth is fueled by several key factors. Rising population and increasing per capita income are driving greater demand for rice, a staple food in Egypt. Furthermore, government initiatives aimed at boosting agricultural production and improving infrastructure related to rice cultivation and processing contribute to the positive market outlook. Increased consumer preference for premium rice varieties and a growing trend toward convenient, packaged rice products are also shaping market dynamics. However, challenges remain. Fluctuations in water availability due to climate change and the impact of international rice prices on domestic markets pose potential restraints on growth. Competition among established players like Lotus Food Industries, Edfina Company for Rice Cultivation and Milling, Egyptian Group Company for Agriculture and Food Industries, El Shams Rice Mills, and Modern Food Industries will intensify as the market expands. The market is segmented geographically by regions within Egypt, with analysis focusing on production, consumption (both volume and value), import/export dynamics (both volume and value), and price trends. Detailed analysis of these factors provides a comprehensive understanding of the current and future state of the Egyptian rice market.
Rice in Egypt Market Market Size (In Billion)
The Egyptian rice market's regional segmentation allows for a granular understanding of production and consumption patterns across the country. Import and export analyses highlight Egypt's reliance on international trade for certain rice varieties or to meet peak demand periods. Price trend analysis within the report offers insight into the factors influencing rice prices in Egypt, which are crucial for both producers and consumers. The historical data from 2019-2024, combined with the projected forecast until 2033, provides a solid foundation for strategic decision-making by stakeholders within the rice industry. Understanding these dynamics is crucial for companies to formulate effective strategies for market penetration, product innovation, and sustainable growth within the competitive Egyptian rice market.
Rice in Egypt Market Company Market Share
Rice in Egypt Market: A Comprehensive Market Report (2019-2033)
This in-depth report provides a comprehensive analysis of the Rice in Egypt Market, covering the historical period (2019-2024), base year (2025), and forecast period (2025-2033). It delves into market dynamics, growth trends, key players, and future opportunities, offering invaluable insights for industry professionals, investors, and stakeholders. The report meticulously examines both parent and child markets, providing a granular understanding of the Egyptian rice landscape. All volume figures are presented in million units.
Rice in Egypt Market Market Dynamics & Structure
This section analyzes the competitive landscape, technological advancements, regulatory environment, and market trends within the Egyptian rice industry. We examine market concentration, identifying the dominant players and their respective market shares. The impact of technological innovations on production efficiency and product quality is assessed, along with the role of government regulations in shaping market dynamics. Furthermore, the report explores the presence of substitute products and their influence on market competition. The analysis also considers end-user demographics and their consumption patterns, and concludes with an overview of mergers and acquisitions (M&A) activity within the sector.
- Market Concentration: xx% dominated by top 3 players (estimated).
- Technological Innovation: Focus on improving yield and water efficiency (e.g., Sakha Super 300). Barriers include access to technology and funding.
- Regulatory Framework: Analysis of government policies impacting rice production, import/export, and pricing.
- Competitive Substitutes: Analysis of alternative grains and their market penetration.
- End-User Demographics: Consumption patterns based on income levels, geographic location, and cultural preferences.
- M&A Trends: xx number of M&A deals recorded between 2019 and 2024 (estimated).
Rice in Egypt Market Growth Trends & Insights
This section presents a detailed analysis of the Rice in Egypt Market's growth trajectory, leveraging extensive data to illuminate key trends and shifts. We examine market size evolution from 2019 to 2024, providing insights into consumption patterns, production levels, import volumes, and export figures. Technological disruptions and consumer behavior shifts are explored, offering a comprehensive picture of market dynamics and providing forecasts up to 2033. Key performance indicators such as Compound Annual Growth Rate (CAGR) and market penetration rates are included to enhance understanding.
- Market Size Evolution (Volume): Historical data (2019-2024) and forecast (2025-2033) with CAGR.
- Consumption Analysis: Detailed breakdown of per capita consumption and overall consumption patterns.
- Production Analysis: Volume produced annually, highlighting regional variations and yield improvements.
- Import/Export Analysis: Trends in import and export volumes and values, identifying key trading partners.
- Price Trend Analysis: Historical and projected price fluctuations influenced by supply, demand, and global market conditions.
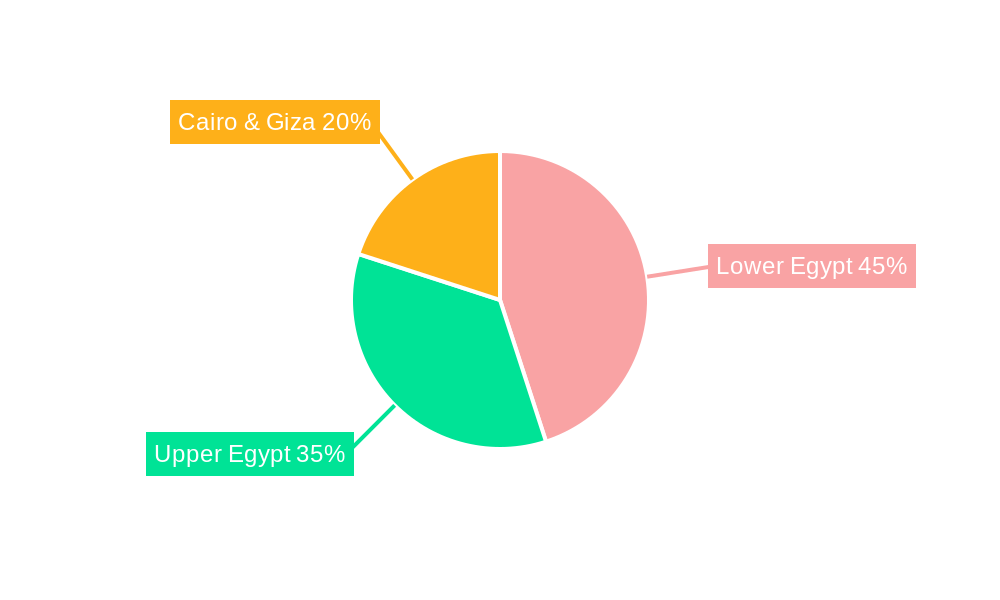
Dominant Regions, Countries, or Segments in Rice in Egypt Market
This section identifies the leading regions, countries, or segments within the Egyptian rice market based on production, consumption, import, and export volumes and values. A detailed analysis examines the factors driving market growth in these dominant areas, including economic policies, infrastructure development, and consumer preferences. Market share and growth potential are also assessed to provide a comprehensive understanding of market dominance.
- Production: Dominant regions within Egypt by volume (e.g., Nile Delta).
- Consumption: Regions with highest per capita consumption and overall consumption volumes.
- Imports: Analysis of main import sources and reasons for importing.
- Exports: Analysis of major export destinations and types of rice exported.
- Price Trends: Regional variations in rice prices and their influencing factors.
Rice in Egypt Market Product Landscape
This section describes the types of rice available in the Egyptian market, including long-grain, medium-grain, and short-grain varieties. It details product innovations, highlighting unique selling propositions and advancements in rice processing and packaging. Performance metrics, such as shelf life and nutritional value, are also considered.
Key Drivers, Barriers & Challenges in Rice in Egypt Market
This section identifies the key factors driving and hindering the growth of the Rice in Egypt Market. Drivers include government support for agricultural development, increasing consumer demand, and technological advancements in rice cultivation and processing. Challenges encompass water scarcity, climate change impacts on yields, and competition from imported rice. Quantifiable impacts of these factors are analyzed.
- Drivers: Increased domestic consumption, government initiatives, technological advancements.
- Challenges: Water scarcity, climate change, competition from imports, supply chain inefficiencies.
Emerging Opportunities in Rice in Egypt Market
This section explores potential opportunities for growth in the Egyptian rice market. These may include expanding into untapped markets, developing new product offerings, or leveraging technological innovations to improve efficiency and sustainability. Focus is placed on innovations in packaging, branding, and marketing, targeting specific consumer segments.
Growth Accelerators in the Rice in Egypt Market Industry
This section highlights the factors that are expected to drive long-term growth in the Rice in Egypt Market. This includes advancements in agricultural technology, strategic partnerships to enhance the supply chain, and successful market expansion strategies. Focus is placed on sustainable farming practices and government policies supporting the sector.
Key Players Shaping the Rice in Egypt Market Market
- Lotus Food Industries
- Edfina Company for Rice Cultivation and Milling
- Egyptian Group Company for Agriculture and Food Industries
- El Shams Rice Mills
- Modern Food Industries
Notable Milestones in Rice in Egypt Market Sector
- April 2022: Egyptian scientist 'Dr. Hamdi Al-Mawafi' received a gold medal at the 2022 Geneva International Exhibition of Inventions for the 'Sakha Super 300' rice variety.
- November 2022: The Rice Farmers Association of Nigeria signed an MoU with Tiamin Rice Company (Egypt).
In-Depth Rice in Egypt Market Market Outlook
This section summarizes the key growth accelerators and their potential impact on the future of the Egyptian rice market. It highlights opportunities for market expansion, technological innovation, and strategic partnerships, emphasizing the potential for long-term sustainable growth. The outlook considers potential challenges and mitigation strategies, providing a balanced perspective on future market potential.
Rice in Egypt Market Segmentation
-
1. Egypt
- 1.1. Production Analysis (Volume)
- 1.2. Consumption Analysis (Volume and Value)
- 1.3. Import Market Analysis (Volume and Value)
- 1.4. Export Market Analysis (Volume and Value)
- 1.5. Price Trend Analysis
-
2. Egypt
- 2.1. Production Analysis (Volume)
- 2.2. Consumption Analysis (Volume and Value)
- 2.3. Import Market Analysis (Volume and Value)
- 2.4. Export Market Analysis (Volume and Value)
- 2.5. Price Trend Analysis
Rice in Egypt Market Segmentation By Geography
-
1. North America
- 1.1. United States
- 1.2. Canada
- 1.3. Mexico
-
2. South America
- 2.1. Brazil
- 2.2. Argentina
- 2.3. Rest of South America
-
3. Europe
- 3.1. United Kingdom
- 3.2. Germany
- 3.3. France
- 3.4. Italy
- 3.5. Spain
- 3.6. Russia
- 3.7. Benelux
- 3.8. Nordics
- 3.9. Rest of Europe
-
4. Middle East & Africa
- 4.1. Turkey
- 4.2. Israel
- 4.3. GCC
- 4.4. North Africa
- 4.5. South Africa
- 4.6. Rest of Middle East & Africa
-
5. Asia Pacific
- 5.1. China
- 5.2. India
- 5.3. Japan
- 5.4. South Korea
- 5.5. ASEAN
- 5.6. Oceania
- 5.7. Rest of Asia Pacific
Rice in Egypt Market Regional Market Share
Geographic Coverage of Rice in Egypt Market
Rice in Egypt Market REPORT HIGHLIGHTS
| Aspects | Details |
|---|---|
| Study Period | 2020-2034 |
| Base Year | 2025 |
| Estimated Year | 2026 |
| Forecast Period | 2026-2034 |
| Historical Period | 2020-2025 |
| Growth Rate | CAGR of 6.88% from 2020-2034 |
| Segmentation |
|
Table of Contents
- 1. Introduction
- 1.1. Research Scope
- 1.2. Market Segmentation
- 1.3. Research Objective
- 1.4. Definitions and Assumptions
- 2. Executive Summary
- 2.1. Market Snapshot
- 3. Market Dynamics
- 3.1. Market Drivers
- 3.2. Market Restrains
- 3.3. Market Trends
- 3.4. Market Opportunities
- 4. Market Factor Analysis
- 4.1. Porters Five Forces
- 4.1.1. Bargaining Power of Suppliers
- 4.1.2. Bargaining Power of Buyers
- 4.1.3. Threat of New Entrants
- 4.1.4. Threat of Substitutes
- 4.1.5. Competitive Rivalry
- 4.2. PESTEL analysis
- 4.3. BCG Analysis
- 4.3.1. Stars (High Growth, High Market Share)
- 4.3.2. Cash Cows (Low Growth, High Market Share)
- 4.3.3. Question Mark (High Growth, Low Market Share)
- 4.3.4. Dogs (Low Growth, Low Market Share)
- 4.4. Ansoff Matrix Analysis
- 4.5. Supply Chain Analysis
- 4.6. Regulatory Landscape
- 4.7. Current Market Potential and Opportunity Assessment (TAM–SAM–SOM Framework)
- 4.8. NRP Analyst Note
- 4.1. Porters Five Forces
- 5. Market Analysis, Insights and Forecast 2021-2033
- 5.1. Market Analysis, Insights and Forecast - by Egypt
- 5.1.1. Production Analysis (Volume)
- 5.1.2. Consumption Analysis (Volume and Value)
- 5.1.3. Import Market Analysis (Volume and Value)
- 5.1.4. Export Market Analysis (Volume and Value)
- 5.1.5. Price Trend Analysis
- 5.2. Market Analysis, Insights and Forecast - by Egypt
- 5.2.1. Production Analysis (Volume)
- 5.2.2. Consumption Analysis (Volume and Value)
- 5.2.3. Import Market Analysis (Volume and Value)
- 5.2.4. Export Market Analysis (Volume and Value)
- 5.2.5. Price Trend Analysis
- 5.3. Market Analysis, Insights and Forecast - by Region
- 5.3.1. North America
- 5.3.2. South America
- 5.3.3. Europe
- 5.3.4. Middle East & Africa
- 5.3.5. Asia Pacific
- 5.1. Market Analysis, Insights and Forecast - by Egypt
- 6. Global Rice in Egypt Market Analysis, Insights and Forecast, 2021-2033
- 6.1. Market Analysis, Insights and Forecast - by Egypt
- 6.1.1. Production Analysis (Volume)
- 6.1.2. Consumption Analysis (Volume and Value)
- 6.1.3. Import Market Analysis (Volume and Value)
- 6.1.4. Export Market Analysis (Volume and Value)
- 6.1.5. Price Trend Analysis
- 6.2. Market Analysis, Insights and Forecast - by Egypt
- 6.2.1. Production Analysis (Volume)
- 6.2.2. Consumption Analysis (Volume and Value)
- 6.2.3. Import Market Analysis (Volume and Value)
- 6.2.4. Export Market Analysis (Volume and Value)
- 6.2.5. Price Trend Analysis
- 6.1. Market Analysis, Insights and Forecast - by Egypt
- 7. North America Rice in Egypt Market Analysis, Insights and Forecast, 2020-2032
- 7.1. Market Analysis, Insights and Forecast - by Egypt
- 7.1.1. Production Analysis (Volume)
- 7.1.2. Consumption Analysis (Volume and Value)
- 7.1.3. Import Market Analysis (Volume and Value)
- 7.1.4. Export Market Analysis (Volume and Value)
- 7.1.5. Price Trend Analysis
- 7.2. Market Analysis, Insights and Forecast - by Egypt
- 7.2.1. Production Analysis (Volume)
- 7.2.2. Consumption Analysis (Volume and Value)
- 7.2.3. Import Market Analysis (Volume and Value)
- 7.2.4. Export Market Analysis (Volume and Value)
- 7.2.5. Price Trend Analysis
- 7.1. Market Analysis, Insights and Forecast - by Egypt
- 8. South America Rice in Egypt Market Analysis, Insights and Forecast, 2020-2032
- 8.1. Market Analysis, Insights and Forecast - by Egypt
- 8.1.1. Production Analysis (Volume)
- 8.1.2. Consumption Analysis (Volume and Value)
- 8.1.3. Import Market Analysis (Volume and Value)
- 8.1.4. Export Market Analysis (Volume and Value)
- 8.1.5. Price Trend Analysis
- 8.2. Market Analysis, Insights and Forecast - by Egypt
- 8.2.1. Production Analysis (Volume)
- 8.2.2. Consumption Analysis (Volume and Value)
- 8.2.3. Import Market Analysis (Volume and Value)
- 8.2.4. Export Market Analysis (Volume and Value)
- 8.2.5. Price Trend Analysis
- 8.1. Market Analysis, Insights and Forecast - by Egypt
- 9. Europe Rice in Egypt Market Analysis, Insights and Forecast, 2020-2032
- 9.1. Market Analysis, Insights and Forecast - by Egypt
- 9.1.1. Production Analysis (Volume)
- 9.1.2. Consumption Analysis (Volume and Value)
- 9.1.3. Import Market Analysis (Volume and Value)
- 9.1.4. Export Market Analysis (Volume and Value)
- 9.1.5. Price Trend Analysis
- 9.2. Market Analysis, Insights and Forecast - by Egypt
- 9.2.1. Production Analysis (Volume)
- 9.2.2. Consumption Analysis (Volume and Value)
- 9.2.3. Import Market Analysis (Volume and Value)
- 9.2.4. Export Market Analysis (Volume and Value)
- 9.2.5. Price Trend Analysis
- 9.1. Market Analysis, Insights and Forecast - by Egypt
- 10. Middle East & Africa Rice in Egypt Market Analysis, Insights and Forecast, 2020-2032
- 10.1. Market Analysis, Insights and Forecast - by Egypt
- 10.1.1. Production Analysis (Volume)
- 10.1.2. Consumption Analysis (Volume and Value)
- 10.1.3. Import Market Analysis (Volume and Value)
- 10.1.4. Export Market Analysis (Volume and Value)
- 10.1.5. Price Trend Analysis
- 10.2. Market Analysis, Insights and Forecast - by Egypt
- 10.2.1. Production Analysis (Volume)
- 10.2.2. Consumption Analysis (Volume and Value)
- 10.2.3. Import Market Analysis (Volume and Value)
- 10.2.4. Export Market Analysis (Volume and Value)
- 10.2.5. Price Trend Analysis
- 10.1. Market Analysis, Insights and Forecast - by Egypt
- 11. Asia Pacific Rice in Egypt Market Analysis, Insights and Forecast, 2020-2032
- 11.1. Market Analysis, Insights and Forecast - by Egypt
- 11.1.1. Production Analysis (Volume)
- 11.1.2. Consumption Analysis (Volume and Value)
- 11.1.3. Import Market Analysis (Volume and Value)
- 11.1.4. Export Market Analysis (Volume and Value)
- 11.1.5. Price Trend Analysis
- 11.2. Market Analysis, Insights and Forecast - by Egypt
- 11.2.1. Production Analysis (Volume)
- 11.2.2. Consumption Analysis (Volume and Value)
- 11.2.3. Import Market Analysis (Volume and Value)
- 11.2.4. Export Market Analysis (Volume and Value)
- 11.2.5. Price Trend Analysis
- 11.1. Market Analysis, Insights and Forecast - by Egypt
- 12. Competitive Analysis
- 12.1. Company Profiles
- 12.1.1 Lotus Food Industries
- 12.1.1.1. Company Overview
- 12.1.1.2. Products
- 12.1.1.3. Company Financials
- 12.1.1.4. SWOT Analysis
- 12.1.2 Edfina Company for Rice Cultivation and Milling
- 12.1.2.1. Company Overview
- 12.1.2.2. Products
- 12.1.2.3. Company Financials
- 12.1.2.4. SWOT Analysis
- 12.1.3 Egyptian Group Company for Agriculture and Food Industries
- 12.1.3.1. Company Overview
- 12.1.3.2. Products
- 12.1.3.3. Company Financials
- 12.1.3.4. SWOT Analysis
- 12.1.4 El Shams Rice Mills
- 12.1.4.1. Company Overview
- 12.1.4.2. Products
- 12.1.4.3. Company Financials
- 12.1.4.4. SWOT Analysis
- 12.1.5 Modern Food Industries
- 12.1.5.1. Company Overview
- 12.1.5.2. Products
- 12.1.5.3. Company Financials
- 12.1.5.4. SWOT Analysis
- 12.1.1 Lotus Food Industries
- 12.2. Market Entropy
- 12.2.1 Company's Key Areas Served
- 12.2.2 Recent Developments
- 12.3. Company Market Share Analysis 2025
- 12.3.1 Top 5 Companies Market Share Analysis
- 12.3.2 Top 3 Companies Market Share Analysis
- 12.4. List of Potential Customers
- 13. Research Methodology
List of Figures
- Figure 1: Global Rice in Egypt Market Revenue Breakdown (Million, %) by Region 2025 & 2033
- Figure 2: Global Rice in Egypt Market Volume Breakdown (Kiloton, %) by Region 2025 & 2033
- Figure 3: North America Rice in Egypt Market Revenue (Million), by Egypt 2025 & 2033
- Figure 4: North America Rice in Egypt Market Volume (Kiloton), by Egypt 2025 & 2033
- Figure 5: North America Rice in Egypt Market Revenue Share (%), by Egypt 2025 & 2033
- Figure 6: North America Rice in Egypt Market Volume Share (%), by Egypt 2025 & 2033
- Figure 7: North America Rice in Egypt Market Revenue (Million), by Egypt 2025 & 2033
- Figure 8: North America Rice in Egypt Market Volume (Kiloton), by Egypt 2025 & 2033
- Figure 9: North America Rice in Egypt Market Revenue Share (%), by Egypt 2025 & 2033
- Figure 10: North America Rice in Egypt Market Volume Share (%), by Egypt 2025 & 2033
- Figure 11: North America Rice in Egypt Market Revenue (Million), by Country 2025 & 2033
- Figure 12: North America Rice in Egypt Market Volume (Kiloton), by Country 2025 & 2033
- Figure 13: North America Rice in Egypt Market Revenue Share (%), by Country 2025 & 2033
- Figure 14: North America Rice in Egypt Market Volume Share (%), by Country 2025 & 2033
- Figure 15: South America Rice in Egypt Market Revenue (Million), by Egypt 2025 & 2033
- Figure 16: South America Rice in Egypt Market Volume (Kiloton), by Egypt 2025 & 2033
- Figure 17: South America Rice in Egypt Market Revenue Share (%), by Egypt 2025 & 2033
- Figure 18: South America Rice in Egypt Market Volume Share (%), by Egypt 2025 & 2033
- Figure 19: South America Rice in Egypt Market Revenue (Million), by Egypt 2025 & 2033
- Figure 20: South America Rice in Egypt Market Volume (Kiloton), by Egypt 2025 & 2033
- Figure 21: South America Rice in Egypt Market Revenue Share (%), by Egypt 2025 & 2033
- Figure 22: South America Rice in Egypt Market Volume Share (%), by Egypt 2025 & 2033
- Figure 23: South America Rice in Egypt Market Revenue (Million), by Country 2025 & 2033
- Figure 24: South America Rice in Egypt Market Volume (Kiloton), by Country 2025 & 2033
- Figure 25: South America Rice in Egypt Market Revenue Share (%), by Country 2025 & 2033
- Figure 26: South America Rice in Egypt Market Volume Share (%), by Country 2025 & 2033
- Figure 27: Europe Rice in Egypt Market Revenue (Million), by Egypt 2025 & 2033
- Figure 28: Europe Rice in Egypt Market Volume (Kiloton), by Egypt 2025 & 2033
- Figure 29: Europe Rice in Egypt Market Revenue Share (%), by Egypt 2025 & 2033
- Figure 30: Europe Rice in Egypt Market Volume Share (%), by Egypt 2025 & 2033
- Figure 31: Europe Rice in Egypt Market Revenue (Million), by Egypt 2025 & 2033
- Figure 32: Europe Rice in Egypt Market Volume (Kiloton), by Egypt 2025 & 2033
- Figure 33: Europe Rice in Egypt Market Revenue Share (%), by Egypt 2025 & 2033
- Figure 34: Europe Rice in Egypt Market Volume Share (%), by Egypt 2025 & 2033
- Figure 35: Europe Rice in Egypt Market Revenue (Million), by Country 2025 & 2033
- Figure 36: Europe Rice in Egypt Market Volume (Kiloton), by Country 2025 & 2033
- Figure 37: Europe Rice in Egypt Market Revenue Share (%), by Country 2025 & 2033
- Figure 38: Europe Rice in Egypt Market Volume Share (%), by Country 2025 & 2033
- Figure 39: Middle East & Africa Rice in Egypt Market Revenue (Million), by Egypt 2025 & 2033
- Figure 40: Middle East & Africa Rice in Egypt Market Volume (Kiloton), by Egypt 2025 & 2033
- Figure 41: Middle East & Africa Rice in Egypt Market Revenue Share (%), by Egypt 2025 & 2033
- Figure 42: Middle East & Africa Rice in Egypt Market Volume Share (%), by Egypt 2025 & 2033
- Figure 43: Middle East & Africa Rice in Egypt Market Revenue (Million), by Egypt 2025 & 2033
- Figure 44: Middle East & Africa Rice in Egypt Market Volume (Kiloton), by Egypt 2025 & 2033
- Figure 45: Middle East & Africa Rice in Egypt Market Revenue Share (%), by Egypt 2025 & 2033
- Figure 46: Middle East & Africa Rice in Egypt Market Volume Share (%), by Egypt 2025 & 2033
- Figure 47: Middle East & Africa Rice in Egypt Market Revenue (Million), by Country 2025 & 2033
- Figure 48: Middle East & Africa Rice in Egypt Market Volume (Kiloton), by Country 2025 & 2033
- Figure 49: Middle East & Africa Rice in Egypt Market Revenue Share (%), by Country 2025 & 2033
- Figure 50: Middle East & Africa Rice in Egypt Market Volume Share (%), by Country 2025 & 2033
- Figure 51: Asia Pacific Rice in Egypt Market Revenue (Million), by Egypt 2025 & 2033
- Figure 52: Asia Pacific Rice in Egypt Market Volume (Kiloton), by Egypt 2025 & 2033
- Figure 53: Asia Pacific Rice in Egypt Market Revenue Share (%), by Egypt 2025 & 2033
- Figure 54: Asia Pacific Rice in Egypt Market Volume Share (%), by Egypt 2025 & 2033
- Figure 55: Asia Pacific Rice in Egypt Market Revenue (Million), by Egypt 2025 & 2033
- Figure 56: Asia Pacific Rice in Egypt Market Volume (Kiloton), by Egypt 2025 & 2033
- Figure 57: Asia Pacific Rice in Egypt Market Revenue Share (%), by Egypt 2025 & 2033
- Figure 58: Asia Pacific Rice in Egypt Market Volume Share (%), by Egypt 2025 & 2033
- Figure 59: Asia Pacific Rice in Egypt Market Revenue (Million), by Country 2025 & 2033
- Figure 60: Asia Pacific Rice in Egypt Market Volume (Kiloton), by Country 2025 & 2033
- Figure 61: Asia Pacific Rice in Egypt Market Revenue Share (%), by Country 2025 & 2033
- Figure 62: Asia Pacific Rice in Egypt Market Volume Share (%), by Country 2025 & 2033
List of Tables
- Table 1: Global Rice in Egypt Market Revenue Million Forecast, by Egypt 2020 & 2033
- Table 2: Global Rice in Egypt Market Volume Kiloton Forecast, by Egypt 2020 & 2033
- Table 3: Global Rice in Egypt Market Revenue Million Forecast, by Egypt 2020 & 2033
- Table 4: Global Rice in Egypt Market Volume Kiloton Forecast, by Egypt 2020 & 2033
- Table 5: Global Rice in Egypt Market Revenue Million Forecast, by Region 2020 & 2033
- Table 6: Global Rice in Egypt Market Volume Kiloton Forecast, by Region 2020 & 2033
- Table 7: Global Rice in Egypt Market Revenue Million Forecast, by Egypt 2020 & 2033
- Table 8: Global Rice in Egypt Market Volume Kiloton Forecast, by Egypt 2020 & 2033
- Table 9: Global Rice in Egypt Market Revenue Million Forecast, by Egypt 2020 & 2033
- Table 10: Global Rice in Egypt Market Volume Kiloton Forecast, by Egypt 2020 & 2033
- Table 11: Global Rice in Egypt Market Revenue Million Forecast, by Country 2020 & 2033
- Table 12: Global Rice in Egypt Market Volume Kiloton Forecast, by Country 2020 & 2033
- Table 13: United States Rice in Egypt Market Revenue (Million) Forecast, by Application 2020 & 2033
- Table 14: United States Rice in Egypt Market Volume (Kiloton) Forecast, by Application 2020 & 2033
- Table 15: Canada Rice in Egypt Market Revenue (Million) Forecast, by Application 2020 & 2033
- Table 16: Canada Rice in Egypt Market Volume (Kiloton) Forecast, by Application 2020 & 2033
- Table 17: Mexico Rice in Egypt Market Revenue (Million) Forecast, by Application 2020 & 2033
- Table 18: Mexico Rice in Egypt Market Volume (Kiloton) Forecast, by Application 2020 & 2033
- Table 19: Global Rice in Egypt Market Revenue Million Forecast, by Egypt 2020 & 2033
- Table 20: Global Rice in Egypt Market Volume Kiloton Forecast, by Egypt 2020 & 2033
- Table 21: Global Rice in Egypt Market Revenue Million Forecast, by Egypt 2020 & 2033
- Table 22: Global Rice in Egypt Market Volume Kiloton Forecast, by Egypt 2020 & 2033
- Table 23: Global Rice in Egypt Market Revenue Million Forecast, by Country 2020 & 2033
- Table 24: Global Rice in Egypt Market Volume Kiloton Forecast, by Country 2020 & 2033
- Table 25: Brazil Rice in Egypt Market Revenue (Million) Forecast, by Application 2020 & 2033
- Table 26: Brazil Rice in Egypt Market Volume (Kiloton) Forecast, by Application 2020 & 2033
- Table 27: Argentina Rice in Egypt Market Revenue (Million) Forecast, by Application 2020 & 2033
- Table 28: Argentina Rice in Egypt Market Volume (Kiloton) Forecast, by Application 2020 & 2033
- Table 29: Rest of South America Rice in Egypt Market Revenue (Million) Forecast, by Application 2020 & 2033
- Table 30: Rest of South America Rice in Egypt Market Volume (Kiloton) Forecast, by Application 2020 & 2033
- Table 31: Global Rice in Egypt Market Revenue Million Forecast, by Egypt 2020 & 2033
- Table 32: Global Rice in Egypt Market Volume Kiloton Forecast, by Egypt 2020 & 2033
- Table 33: Global Rice in Egypt Market Revenue Million Forecast, by Egypt 2020 & 2033
- Table 34: Global Rice in Egypt Market Volume Kiloton Forecast, by Egypt 2020 & 2033
- Table 35: Global Rice in Egypt Market Revenue Million Forecast, by Country 2020 & 2033
- Table 36: Global Rice in Egypt Market Volume Kiloton Forecast, by Country 2020 & 2033
- Table 37: United Kingdom Rice in Egypt Market Revenue (Million) Forecast, by Application 2020 & 2033
- Table 38: United Kingdom Rice in Egypt Market Volume (Kiloton) Forecast, by Application 2020 & 2033
- Table 39: Germany Rice in Egypt Market Revenue (Million) Forecast, by Application 2020 & 2033
- Table 40: Germany Rice in Egypt Market Volume (Kiloton) Forecast, by Application 2020 & 2033
- Table 41: France Rice in Egypt Market Revenue (Million) Forecast, by Application 2020 & 2033
- Table 42: France Rice in Egypt Market Volume (Kiloton) Forecast, by Application 2020 & 2033
- Table 43: Italy Rice in Egypt Market Revenue (Million) Forecast, by Application 2020 & 2033
- Table 44: Italy Rice in Egypt Market Volume (Kiloton) Forecast, by Application 2020 & 2033
- Table 45: Spain Rice in Egypt Market Revenue (Million) Forecast, by Application 2020 & 2033
- Table 46: Spain Rice in Egypt Market Volume (Kiloton) Forecast, by Application 2020 & 2033
- Table 47: Russia Rice in Egypt Market Revenue (Million) Forecast, by Application 2020 & 2033
- Table 48: Russia Rice in Egypt Market Volume (Kiloton) Forecast, by Application 2020 & 2033
- Table 49: Benelux Rice in Egypt Market Revenue (Million) Forecast, by Application 2020 & 2033
- Table 50: Benelux Rice in Egypt Market Volume (Kiloton) Forecast, by Application 2020 & 2033
- Table 51: Nordics Rice in Egypt Market Revenue (Million) Forecast, by Application 2020 & 2033
- Table 52: Nordics Rice in Egypt Market Volume (Kiloton) Forecast, by Application 2020 & 2033
- Table 53: Rest of Europe Rice in Egypt Market Revenue (Million) Forecast, by Application 2020 & 2033
- Table 54: Rest of Europe Rice in Egypt Market Volume (Kiloton) Forecast, by Application 2020 & 2033
- Table 55: Global Rice in Egypt Market Revenue Million Forecast, by Egypt 2020 & 2033
- Table 56: Global Rice in Egypt Market Volume Kiloton Forecast, by Egypt 2020 & 2033
- Table 57: Global Rice in Egypt Market Revenue Million Forecast, by Egypt 2020 & 2033
- Table 58: Global Rice in Egypt Market Volume Kiloton Forecast, by Egypt 2020 & 2033
- Table 59: Global Rice in Egypt Market Revenue Million Forecast, by Country 2020 & 2033
- Table 60: Global Rice in Egypt Market Volume Kiloton Forecast, by Country 2020 & 2033
- Table 61: Turkey Rice in Egypt Market Revenue (Million) Forecast, by Application 2020 & 2033
- Table 62: Turkey Rice in Egypt Market Volume (Kiloton) Forecast, by Application 2020 & 2033
- Table 63: Israel Rice in Egypt Market Revenue (Million) Forecast, by Application 2020 & 2033
- Table 64: Israel Rice in Egypt Market Volume (Kiloton) Forecast, by Application 2020 & 2033
- Table 65: GCC Rice in Egypt Market Revenue (Million) Forecast, by Application 2020 & 2033
- Table 66: GCC Rice in Egypt Market Volume (Kiloton) Forecast, by Application 2020 & 2033
- Table 67: North Africa Rice in Egypt Market Revenue (Million) Forecast, by Application 2020 & 2033
- Table 68: North Africa Rice in Egypt Market Volume (Kiloton) Forecast, by Application 2020 & 2033
- Table 69: South Africa Rice in Egypt Market Revenue (Million) Forecast, by Application 2020 & 2033
- Table 70: South Africa Rice in Egypt Market Volume (Kiloton) Forecast, by Application 2020 & 2033
- Table 71: Rest of Middle East & Africa Rice in Egypt Market Revenue (Million) Forecast, by Application 2020 & 2033
- Table 72: Rest of Middle East & Africa Rice in Egypt Market Volume (Kiloton) Forecast, by Application 2020 & 2033
- Table 73: Global Rice in Egypt Market Revenue Million Forecast, by Egypt 2020 & 2033
- Table 74: Global Rice in Egypt Market Volume Kiloton Forecast, by Egypt 2020 & 2033
- Table 75: Global Rice in Egypt Market Revenue Million Forecast, by Egypt 2020 & 2033
- Table 76: Global Rice in Egypt Market Volume Kiloton Forecast, by Egypt 2020 & 2033
- Table 77: Global Rice in Egypt Market Revenue Million Forecast, by Country 2020 & 2033
- Table 78: Global Rice in Egypt Market Volume Kiloton Forecast, by Country 2020 & 2033
- Table 79: China Rice in Egypt Market Revenue (Million) Forecast, by Application 2020 & 2033
- Table 80: China Rice in Egypt Market Volume (Kiloton) Forecast, by Application 2020 & 2033
- Table 81: India Rice in Egypt Market Revenue (Million) Forecast, by Application 2020 & 2033
- Table 82: India Rice in Egypt Market Volume (Kiloton) Forecast, by Application 2020 & 2033
- Table 83: Japan Rice in Egypt Market Revenue (Million) Forecast, by Application 2020 & 2033
- Table 84: Japan Rice in Egypt Market Volume (Kiloton) Forecast, by Application 2020 & 2033
- Table 85: South Korea Rice in Egypt Market Revenue (Million) Forecast, by Application 2020 & 2033
- Table 86: South Korea Rice in Egypt Market Volume (Kiloton) Forecast, by Application 2020 & 2033
- Table 87: ASEAN Rice in Egypt Market Revenue (Million) Forecast, by Application 2020 & 2033
- Table 88: ASEAN Rice in Egypt Market Volume (Kiloton) Forecast, by Application 2020 & 2033
- Table 89: Oceania Rice in Egypt Market Revenue (Million) Forecast, by Application 2020 & 2033
- Table 90: Oceania Rice in Egypt Market Volume (Kiloton) Forecast, by Application 2020 & 2033
- Table 91: Rest of Asia Pacific Rice in Egypt Market Revenue (Million) Forecast, by Application 2020 & 2033
- Table 92: Rest of Asia Pacific Rice in Egypt Market Volume (Kiloton) Forecast, by Application 2020 & 2033
Frequently Asked Questions
1. What is the projected Compound Annual Growth Rate (CAGR) of the Rice in Egypt Market?
The projected CAGR is approximately 6.88%.
2. Which companies are prominent players in the Rice in Egypt Market?
Key companies in the market include Lotus Food Industries, Edfina Company for Rice Cultivation and Milling, Egyptian Group Company for Agriculture and Food Industries , El Shams Rice Mills, Modern Food Industries.
3. What are the main segments of the Rice in Egypt Market?
The market segments include Egypt, Egypt.
4. Can you provide details about the market size?
The market size is estimated to be USD 1.95 Million as of 2022.
5. What are some drivers contributing to market growth?
Rising Consumption of Cashew Nuts in the Country; Favorable Government Initiatives.
6. What are the notable trends driving market growth?
Increase in demand of rice due to rising population.
7. Are there any restraints impacting market growth?
Hazardous Climatic Condition Hinders Cashew Production; Stringent Regulations Related to Food Quality Standards.
8. Can you provide examples of recent developments in the market?
November 2022: The Rice Farmers Association of Nigeria signed a memorandum of understanding with Tiamin Rice Company (Egypt) for processing and selling rice locally and internationally.
9. What pricing options are available for accessing the report?
Pricing options include single-user, multi-user, and enterprise licenses priced at USD 3800, USD 4500, and USD 5800 respectively.
10. Is the market size provided in terms of value or volume?
The market size is provided in terms of value, measured in Million and volume, measured in Kiloton.
11. Are there any specific market keywords associated with the report?
Yes, the market keyword associated with the report is "Rice in Egypt Market," which aids in identifying and referencing the specific market segment covered.
12. How do I determine which pricing option suits my needs best?
The pricing options vary based on user requirements and access needs. Individual users may opt for single-user licenses, while businesses requiring broader access may choose multi-user or enterprise licenses for cost-effective access to the report.
13. Are there any additional resources or data provided in the Rice in Egypt Market report?
While the report offers comprehensive insights, it's advisable to review the specific contents or supplementary materials provided to ascertain if additional resources or data are available.
14. How can I stay updated on further developments or reports in the Rice in Egypt Market?
To stay informed about further developments, trends, and reports in the Rice in Egypt Market, consider subscribing to industry newsletters, following relevant companies and organizations, or regularly checking reputable industry news sources and publications.
Methodology
Step 1 - Identification of Relevant Samples Size from Population Database


Step 2 - Approaches for Defining Global Market Size (Value, Volume* & Price*)

Note*: In applicable scenarios
Step 3 - Data Sources
Primary Research
- Web Analytics
- Survey Reports
- Research Institute
- Latest Research Reports
- Opinion Leaders
Secondary Research
- Annual Reports
- White Paper
- Latest Press Release
- Industry Association
- Paid Database
- Investor Presentations

Step 4 - Data Triangulation
Involves using different sources of information in order to increase the validity of a study
These sources are likely to be stakeholders in a program - participants, other researchers, program staff, other community members, and so on.
Then we put all data in single framework & apply various statistical tools to find out the dynamic on the market.
During the analysis stage, feedback from the stakeholder groups would be compared to determine areas of agreement as well as areas of divergence