

Key Insights
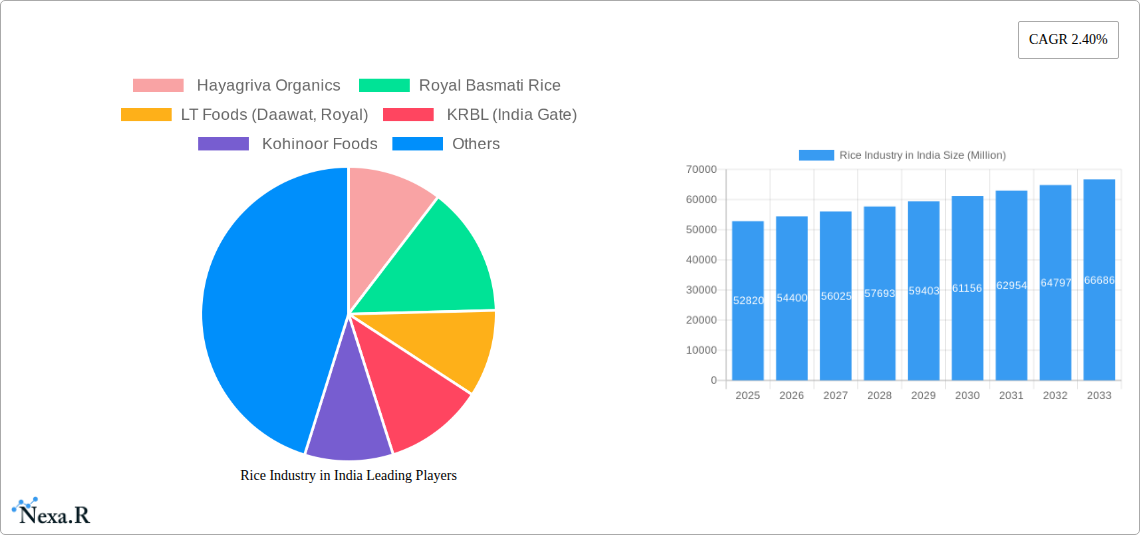
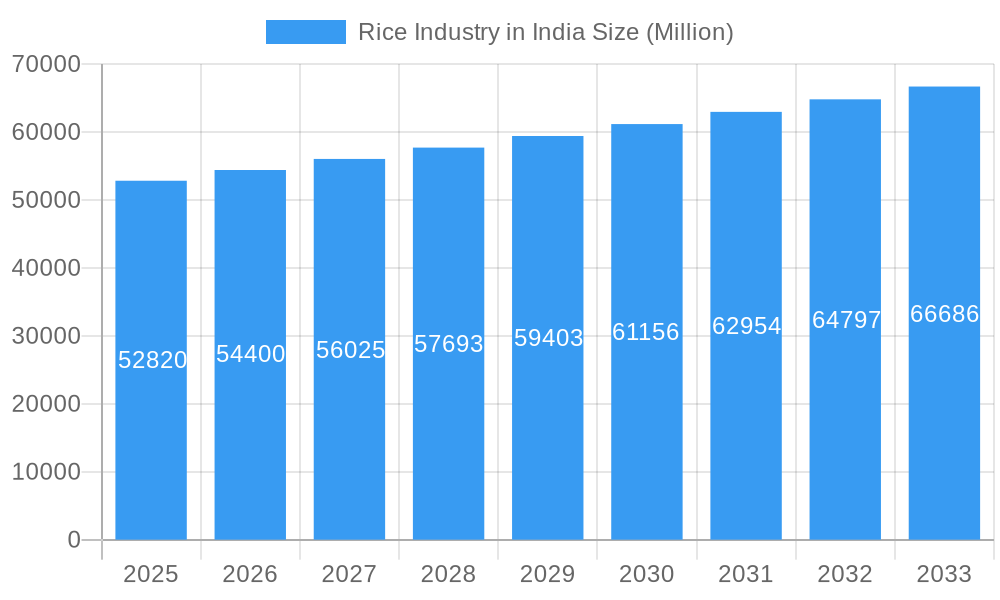
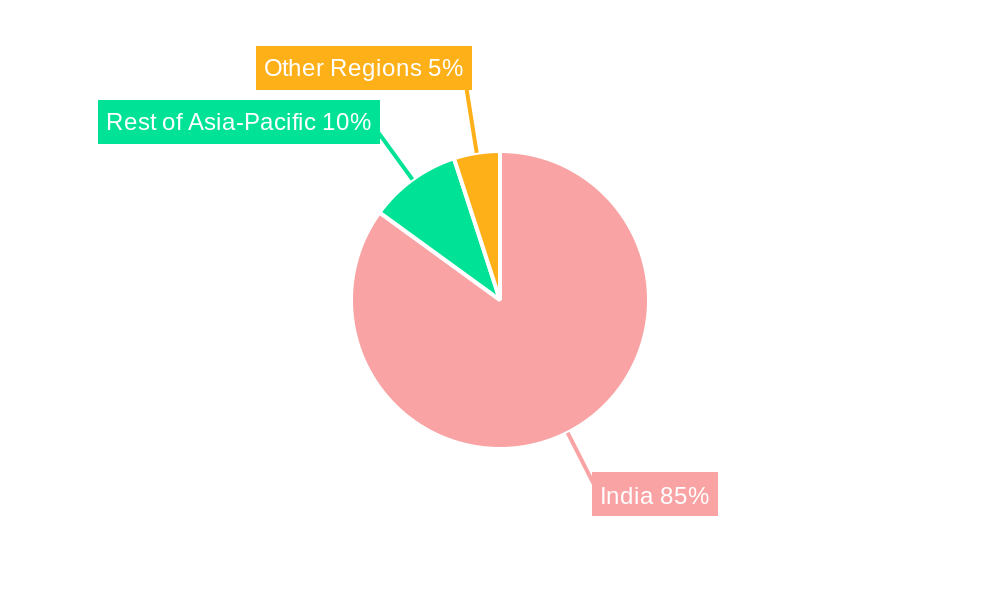
The Indian rice market, valued at $52.82 billion in 2025, is projected to experience steady growth, driven by factors such as increasing population, rising disposable incomes, and evolving consumer preferences towards convenience and healthier rice varieties. The Compound Annual Growth Rate (CAGR) of 2.40% over the forecast period (2025-2033) indicates a consistent, albeit moderate, expansion. This growth is fueled by the strong demand for basmati rice, both domestically and internationally, alongside the increasing popularity of fortified rice, catering to health-conscious consumers. While the market faces challenges such as climate change impacting yields and fluctuating international prices, the diverse segments within the rice industry—basmati, non-basmati, fortified, and specialty rice—offer avenues for sustained growth. Major players like LT Foods (Daawat, Royal), KRBL (India Gate), Kohinoor Foods, and Hayagriva Organics are actively shaping the market through branding, innovation, and strategic expansions, contributing to the overall market stability and expansion. The Asia-Pacific region, particularly India, remains the dominant market, fueled by strong domestic consumption and exports.
Rice Industry in India Market Size (In Billion)
The segmentation within the Indian rice market provides opportunities for specialized marketing strategies. The premium segment, featuring basmati and specialty rice, is expected to witness higher growth rates driven by increasing purchasing power and a preference for higher-quality products. Conversely, the non-basmati segment, despite holding a larger volume share, may experience moderate growth due to price sensitivity. Fortified rice presents a significant opportunity for growth, driven by government initiatives promoting nutritional security and public health awareness. To capitalize on these opportunities, companies are investing in research and development, exploring new varieties, and improving processing and packaging techniques. Strategic partnerships and collaborations are also key to market expansion, particularly within the export sector. Overall, the future of the Indian rice industry remains promising, with significant potential for growth across different segments and regions.
Rice Industry in India Company Market Share
Rice Industry in India: A Comprehensive Market Report (2019-2033)
This in-depth report provides a comprehensive analysis of the Indian rice industry, encompassing market dynamics, growth trends, key players, and future outlook. With a study period spanning 2019-2033, a base year of 2025, and a forecast period of 2025-2033, this report is an essential resource for industry professionals, investors, and stakeholders seeking to navigate this dynamic market. The report leverages extensive data analysis and expert insights to provide actionable intelligence across the entire rice value chain. Market sizes are presented in Million units.
Rice Industry in India Market Dynamics & Structure
The Indian rice industry, a cornerstone of the nation's agricultural economy, exhibits a complex interplay of factors influencing its structure and growth. Market concentration is moderate, with several large players dominating the branded segments, alongside a vast number of smaller, regional producers. Technological innovation, though present, faces barriers including fragmented farmer networks and limited access to advanced technologies in certain regions. Regulatory frameworks, including export policies and agricultural subsidies, significantly impact production and trade. Competitive product substitutes are limited, with rice holding a dominant position in the staple food market. End-user demographics show a largely homogenous consumption pattern, with rice being a staple across various socioeconomic groups. M&A activity has been moderate, primarily focused on consolidating market share and expanding distribution networks.
- Market Concentration: Moderate, with top players holding xx% market share (2024).
- Technological Innovation: Driven by improved seed varieties and mechanization, but hampered by adoption barriers in smaller farms.
- Regulatory Framework: Significant impact from export policies and agricultural support schemes.
- Competitive Substitutes: Limited; rice remains the dominant staple.
- End-User Demographics: Primarily homogenous consumption across socioeconomic groups.
- M&A Trends: Moderate activity, primarily focused on consolidation and distribution expansion. xx deals recorded in 2024.
Rice Industry in India Growth Trends & Insights
The Indian rice market demonstrates robust growth, driven by a burgeoning population, rising disposable incomes, and increasing urbanization. Market size expanded steadily during the historical period (2019-2024), experiencing a CAGR of xx%. This growth is expected to continue during the forecast period (2025-2033), albeit at a slightly moderated pace, projecting a CAGR of xx%. Adoption rates for improved rice varieties and sustainable farming practices are increasing but remain uneven across regions. Technological disruptions, such as precision agriculture and automation, are gradually gaining traction, though penetration is still relatively low. Consumer behavior is shifting towards premium and specialty rice varieties, reflecting rising health consciousness and willingness to pay for quality.
Dominant Regions, Countries, or Segments in Rice Industry in India
The Indian rice market is geographically diverse, with certain regions showing significantly higher production and consumption levels. While several states contribute to overall production, Punjab, Uttar Pradesh, West Bengal, and Andhra Pradesh stand out as major players. Regarding product segments, Non-Basmati rice dominates by volume due to its widespread consumption across the country. However, Basmati rice commands premium prices and contributes significantly to export revenue. Fortified rice and specialty rice segments are exhibiting strong growth, fueled by health concerns and evolving consumer preferences.
- Basmati Rice: High export demand, premium pricing, dominant in Northern India. Growth driven by global demand and brand development.
- Non-Basmati Rice: Largest segment by volume, widespread consumption, price sensitivity. Growth linked to population growth and domestic demand.
- Fortified Rice: Emerging segment, driven by nutritional awareness and government initiatives. Growth potential linked to public health programs.
- Specialty Rice: Niche segment catering to premium consumers, increasing demand for organic and unique varieties. Growth driven by evolving consumer preferences.
Rice Industry in India Product Landscape
The Indian rice market features a broad range of products, from traditional varieties to innovative, value-added offerings. Basmati rice maintains its reputation for superior aroma and flavor, while Non-Basmati rice encompasses a diverse array of varieties tailored to local preferences and culinary uses. The emergence of fortified rice addresses nutritional deficiencies, and specialty rice caters to discerning consumers seeking unique flavors, textures, and health benefits. Technological advancements in rice processing and packaging are enhancing product quality, shelf life, and consumer appeal. Key innovations include improved seed varieties with higher yields and pest resistance and advanced milling technologies for superior grain quality.
Key Drivers, Barriers & Challenges in Rice Industry in India
Key Drivers: Rising population and disposable incomes; increasing urbanization and changing dietary habits; government support for agricultural development; export opportunities for Basmati rice; and technological advancements in seed production and farming practices.
Key Challenges: Climate change and water scarcity; supply chain inefficiencies; volatile commodity prices; and challenges in maintaining consistent quality and hygiene across the diverse production landscape. Post-harvest losses are estimated to be xx Million units annually.
Emerging Opportunities in Rice Industry in India
Untapped potential exists in expanding the fortified rice market through public-private partnerships and government initiatives. Growth opportunities are also visible in the specialty rice segment, targeting health-conscious consumers seeking organic, gluten-free, or other unique rice varieties. Further, innovative applications of rice by-products, such as rice bran oil and rice husk ash, present opportunities for value addition and waste reduction. Export diversification beyond Basmati rice to cater to global demand for other varieties could significantly boost the sector.
Growth Accelerators in the Rice Industry in India Industry
Strategic partnerships between seed companies, agricultural technology providers, and processors are crucial for accelerating growth. Investing in efficient irrigation systems and sustainable water management practices will mitigate the risks of climate change and water scarcity. Strengthening the cold chain infrastructure will minimize post-harvest losses and enhance product quality. Furthermore, fostering innovation in rice processing and packaging technologies will improve efficiency and meet evolving consumer demands.
Key Players Shaping the Rice Industry in India Market
- Hayagriva Organics
- Royal Basmati Rice
- LT Foods (Daawat, Royal)
- KRBL (India Gate)
- Kohinoor Foods
- Chaman Lal Setia Exports
- Amira Nature Foods
Notable Milestones in Rice Industry in India Sector
- June 2024: Acharya N.G. Ranga Agricultural University releases new high-yielding, pest-resistant rice varieties (MTU 1271, BPT 2846, BPT 2841, and NLR 3238) for Andhra Pradesh, boosting regional production.
- September 2022: Government of India prohibits broken rice exports, aiming to increase domestic availability for poultry feed and ethanol production, impacting export dynamics.
- June 2022: Vida Carbon Corp. partners with Core CarbonX Solutions to improve rice farming practices across 100,000 hectares in Telangana, promoting sustainable agriculture and potentially enhancing yields.
In-Depth Rice Industry in India Market Outlook
The Indian rice industry is poised for continued growth, driven by a combination of factors. The increasing adoption of sustainable agricultural practices, technological advancements, and favorable government policies will contribute to increased productivity and efficiency. Furthermore, the expanding domestic market and growing global demand for Indian rice, particularly Basmati, will fuel market expansion. Strategic investments in infrastructure development, value addition, and branding will further enhance the competitiveness of the Indian rice industry on the global stage. The long-term outlook is positive, presenting significant opportunities for growth and investment.
Rice Industry in India Segmentation
- 1. Production Analysis (Volume)
- 2. Consumption Analysis (Value and Volume)
- 3. Import Analysis (Value and Volume)
- 4. Export Analysis (Value and Volume)
- 5. Price Trend Analysis
- 6. Production Analysis (Volume)
- 7. Consumption Analysis (Value and Volume)
- 8. Import Analysis (Value and Volume)
- 9. Export Analysis (Value and Volume)
- 10. Price Trend Analysis
Rice Industry in India Segmentation By Geography
-
1. North America
- 1.1. United States
- 1.2. Canada
- 1.3. Mexico
-
2. South America
- 2.1. Brazil
- 2.2. Argentina
- 2.3. Rest of South America
-
3. Europe
- 3.1. United Kingdom
- 3.2. Germany
- 3.3. France
- 3.4. Italy
- 3.5. Spain
- 3.6. Russia
- 3.7. Benelux
- 3.8. Nordics
- 3.9. Rest of Europe
-
4. Middle East & Africa
- 4.1. Turkey
- 4.2. Israel
- 4.3. GCC
- 4.4. North Africa
- 4.5. South Africa
- 4.6. Rest of Middle East & Africa
-
5. Asia Pacific
- 5.1. China
- 5.2. India
- 5.3. Japan
- 5.4. South Korea
- 5.5. ASEAN
- 5.6. Oceania
- 5.7. Rest of Asia Pacific
Rice Industry in India Regional Market Share
Geographic Coverage of Rice Industry in India
Rice Industry in India REPORT HIGHLIGHTS
| Aspects | Details |
|---|---|
| Study Period | 2020-2034 |
| Base Year | 2025 |
| Estimated Year | 2026 |
| Forecast Period | 2026-2034 |
| Historical Period | 2020-2025 |
| Growth Rate | CAGR of 2.40% from 2020-2034 |
| Segmentation |
|
Table of Contents
- 1. Introduction
- 1.1. Research Scope
- 1.2. Market Segmentation
- 1.3. Research Methodology
- 1.4. Definitions and Assumptions
- 2. Executive Summary
- 2.1. Introduction
- 3. Market Dynamics
- 3.1. Introduction
- 3.2. Market Drivers
- 3.2.1. Increasing Demand for Indian Rice; Enhancing Production Capacities; Increasing Government Initiatives
- 3.3. Market Restrains
- 3.3.1. Abiotic and Biotic Stresses in Rice Cultivation; High Market Entry Costs
- 3.4. Market Trends
- 3.4.1. Increasing Demand for Indian Rice
- 4. Market Factor Analysis
- 4.1. Porters Five Forces
- 4.2. Supply/Value Chain
- 4.3. PESTEL analysis
- 4.4. Market Entropy
- 4.5. Patent/Trademark Analysis
- 5. Global Rice Industry in India Analysis, Insights and Forecast, 2020-2032
- 5.1. Market Analysis, Insights and Forecast - by Production Analysis (Volume)
- 5.2. Market Analysis, Insights and Forecast - by Consumption Analysis (Value and Volume)
- 5.3. Market Analysis, Insights and Forecast - by Import Analysis (Value and Volume)
- 5.4. Market Analysis, Insights and Forecast - by Export Analysis (Value and Volume)
- 5.5. Market Analysis, Insights and Forecast - by Price Trend Analysis
- 5.6. Market Analysis, Insights and Forecast - by Production Analysis (Volume)
- 5.7. Market Analysis, Insights and Forecast - by Consumption Analysis (Value and Volume)
- 5.8. Market Analysis, Insights and Forecast - by Import Analysis (Value and Volume)
- 5.9. Market Analysis, Insights and Forecast - by Export Analysis (Value and Volume)
- 5.10. Market Analysis, Insights and Forecast - by Price Trend Analysis
- 5.11. Market Analysis, Insights and Forecast - by Region
- 5.11.1. North America
- 5.11.2. South America
- 5.11.3. Europe
- 5.11.4. Middle East & Africa
- 5.11.5. Asia Pacific
- 5.1. Market Analysis, Insights and Forecast - by Production Analysis (Volume)
- 6. North America Rice Industry in India Analysis, Insights and Forecast, 2020-2032
- 6.1. Market Analysis, Insights and Forecast - by Production Analysis (Volume)
- 6.2. Market Analysis, Insights and Forecast - by Consumption Analysis (Value and Volume)
- 6.3. Market Analysis, Insights and Forecast - by Import Analysis (Value and Volume)
- 6.4. Market Analysis, Insights and Forecast - by Export Analysis (Value and Volume)
- 6.5. Market Analysis, Insights and Forecast - by Price Trend Analysis
- 6.6. Market Analysis, Insights and Forecast - by Production Analysis (Volume)
- 6.7. Market Analysis, Insights and Forecast - by Consumption Analysis (Value and Volume)
- 6.8. Market Analysis, Insights and Forecast - by Import Analysis (Value and Volume)
- 6.9. Market Analysis, Insights and Forecast - by Export Analysis (Value and Volume)
- 6.10. Market Analysis, Insights and Forecast - by Price Trend Analysis
- 6.1. Market Analysis, Insights and Forecast - by Production Analysis (Volume)
- 7. South America Rice Industry in India Analysis, Insights and Forecast, 2020-2032
- 7.1. Market Analysis, Insights and Forecast - by Production Analysis (Volume)
- 7.2. Market Analysis, Insights and Forecast - by Consumption Analysis (Value and Volume)
- 7.3. Market Analysis, Insights and Forecast - by Import Analysis (Value and Volume)
- 7.4. Market Analysis, Insights and Forecast - by Export Analysis (Value and Volume)
- 7.5. Market Analysis, Insights and Forecast - by Price Trend Analysis
- 7.6. Market Analysis, Insights and Forecast - by Production Analysis (Volume)
- 7.7. Market Analysis, Insights and Forecast - by Consumption Analysis (Value and Volume)
- 7.8. Market Analysis, Insights and Forecast - by Import Analysis (Value and Volume)
- 7.9. Market Analysis, Insights and Forecast - by Export Analysis (Value and Volume)
- 7.10. Market Analysis, Insights and Forecast - by Price Trend Analysis
- 7.1. Market Analysis, Insights and Forecast - by Production Analysis (Volume)
- 8. Europe Rice Industry in India Analysis, Insights and Forecast, 2020-2032
- 8.1. Market Analysis, Insights and Forecast - by Production Analysis (Volume)
- 8.2. Market Analysis, Insights and Forecast - by Consumption Analysis (Value and Volume)
- 8.3. Market Analysis, Insights and Forecast - by Import Analysis (Value and Volume)
- 8.4. Market Analysis, Insights and Forecast - by Export Analysis (Value and Volume)
- 8.5. Market Analysis, Insights and Forecast - by Price Trend Analysis
- 8.6. Market Analysis, Insights and Forecast - by Production Analysis (Volume)
- 8.7. Market Analysis, Insights and Forecast - by Consumption Analysis (Value and Volume)
- 8.8. Market Analysis, Insights and Forecast - by Import Analysis (Value and Volume)
- 8.9. Market Analysis, Insights and Forecast - by Export Analysis (Value and Volume)
- 8.10. Market Analysis, Insights and Forecast - by Price Trend Analysis
- 8.1. Market Analysis, Insights and Forecast - by Production Analysis (Volume)
- 9. Middle East & Africa Rice Industry in India Analysis, Insights and Forecast, 2020-2032
- 9.1. Market Analysis, Insights and Forecast - by Production Analysis (Volume)
- 9.2. Market Analysis, Insights and Forecast - by Consumption Analysis (Value and Volume)
- 9.3. Market Analysis, Insights and Forecast - by Import Analysis (Value and Volume)
- 9.4. Market Analysis, Insights and Forecast - by Export Analysis (Value and Volume)
- 9.5. Market Analysis, Insights and Forecast - by Price Trend Analysis
- 9.6. Market Analysis, Insights and Forecast - by Production Analysis (Volume)
- 9.7. Market Analysis, Insights and Forecast - by Consumption Analysis (Value and Volume)
- 9.8. Market Analysis, Insights and Forecast - by Import Analysis (Value and Volume)
- 9.9. Market Analysis, Insights and Forecast - by Export Analysis (Value and Volume)
- 9.10. Market Analysis, Insights and Forecast - by Price Trend Analysis
- 9.1. Market Analysis, Insights and Forecast - by Production Analysis (Volume)
- 10. Asia Pacific Rice Industry in India Analysis, Insights and Forecast, 2020-2032
- 10.1. Market Analysis, Insights and Forecast - by Production Analysis (Volume)
- 10.2. Market Analysis, Insights and Forecast - by Consumption Analysis (Value and Volume)
- 10.3. Market Analysis, Insights and Forecast - by Import Analysis (Value and Volume)
- 10.4. Market Analysis, Insights and Forecast - by Export Analysis (Value and Volume)
- 10.5. Market Analysis, Insights and Forecast - by Price Trend Analysis
- 10.6. Market Analysis, Insights and Forecast - by Production Analysis (Volume)
- 10.7. Market Analysis, Insights and Forecast - by Consumption Analysis (Value and Volume)
- 10.8. Market Analysis, Insights and Forecast - by Import Analysis (Value and Volume)
- 10.9. Market Analysis, Insights and Forecast - by Export Analysis (Value and Volume)
- 10.10. Market Analysis, Insights and Forecast - by Price Trend Analysis
- 10.1. Market Analysis, Insights and Forecast - by Production Analysis (Volume)
- 11. Competitive Analysis
- 11.1. Global Market Share Analysis 2025
- 11.2. Company Profiles
- 11.2.1 Hayagriva Organics
- 11.2.1.1. Overview
- 11.2.1.2. Products
- 11.2.1.3. SWOT Analysis
- 11.2.1.4. Recent Developments
- 11.2.1.5. Financials (Based on Availability)
- 11.2.2 Royal Basmati Rice
- 11.2.2.1. Overview
- 11.2.2.2. Products
- 11.2.2.3. SWOT Analysis
- 11.2.2.4. Recent Developments
- 11.2.2.5. Financials (Based on Availability)
- 11.2.3 LT Foods (Daawat Royal)
- 11.2.3.1. Overview
- 11.2.3.2. Products
- 11.2.3.3. SWOT Analysis
- 11.2.3.4. Recent Developments
- 11.2.3.5. Financials (Based on Availability)
- 11.2.4 KRBL (India Gate)
- 11.2.4.1. Overview
- 11.2.4.2. Products
- 11.2.4.3. SWOT Analysis
- 11.2.4.4. Recent Developments
- 11.2.4.5. Financials (Based on Availability)
- 11.2.5 Kohinoor Foods
- 11.2.5.1. Overview
- 11.2.5.2. Products
- 11.2.5.3. SWOT Analysis
- 11.2.5.4. Recent Developments
- 11.2.5.5. Financials (Based on Availability)
- 11.2.6 Chaman Lal Setia Exports
- 11.2.6.1. Overview
- 11.2.6.2. Products
- 11.2.6.3. SWOT Analysis
- 11.2.6.4. Recent Developments
- 11.2.6.5. Financials (Based on Availability)
- 11.2.7 Amira Nature Foods
- 11.2.7.1. Overview
- 11.2.7.2. Products
- 11.2.7.3. SWOT Analysis
- 11.2.7.4. Recent Developments
- 11.2.7.5. Financials (Based on Availability)
- 11.2.1 Hayagriva Organics
List of Figures
- Figure 1: Global Rice Industry in India Revenue Breakdown (Million, %) by Region 2025 & 2033
- Figure 2: Global Rice Industry in India Volume Breakdown (Kiloton, %) by Region 2025 & 2033
- Figure 3: North America Rice Industry in India Revenue (Million), by Production Analysis (Volume) 2025 & 2033
- Figure 4: North America Rice Industry in India Volume (Kiloton), by Production Analysis (Volume) 2025 & 2033
- Figure 5: North America Rice Industry in India Revenue Share (%), by Production Analysis (Volume) 2025 & 2033
- Figure 6: North America Rice Industry in India Volume Share (%), by Production Analysis (Volume) 2025 & 2033
- Figure 7: North America Rice Industry in India Revenue (Million), by Consumption Analysis (Value and Volume) 2025 & 2033
- Figure 8: North America Rice Industry in India Volume (Kiloton), by Consumption Analysis (Value and Volume) 2025 & 2033
- Figure 9: North America Rice Industry in India Revenue Share (%), by Consumption Analysis (Value and Volume) 2025 & 2033
- Figure 10: North America Rice Industry in India Volume Share (%), by Consumption Analysis (Value and Volume) 2025 & 2033
- Figure 11: North America Rice Industry in India Revenue (Million), by Import Analysis (Value and Volume) 2025 & 2033
- Figure 12: North America Rice Industry in India Volume (Kiloton), by Import Analysis (Value and Volume) 2025 & 2033
- Figure 13: North America Rice Industry in India Revenue Share (%), by Import Analysis (Value and Volume) 2025 & 2033
- Figure 14: North America Rice Industry in India Volume Share (%), by Import Analysis (Value and Volume) 2025 & 2033
- Figure 15: North America Rice Industry in India Revenue (Million), by Export Analysis (Value and Volume) 2025 & 2033
- Figure 16: North America Rice Industry in India Volume (Kiloton), by Export Analysis (Value and Volume) 2025 & 2033
- Figure 17: North America Rice Industry in India Revenue Share (%), by Export Analysis (Value and Volume) 2025 & 2033
- Figure 18: North America Rice Industry in India Volume Share (%), by Export Analysis (Value and Volume) 2025 & 2033
- Figure 19: North America Rice Industry in India Revenue (Million), by Price Trend Analysis 2025 & 2033
- Figure 20: North America Rice Industry in India Volume (Kiloton), by Price Trend Analysis 2025 & 2033
- Figure 21: North America Rice Industry in India Revenue Share (%), by Price Trend Analysis 2025 & 2033
- Figure 22: North America Rice Industry in India Volume Share (%), by Price Trend Analysis 2025 & 2033
- Figure 23: North America Rice Industry in India Revenue (Million), by Production Analysis (Volume) 2025 & 2033
- Figure 24: North America Rice Industry in India Volume (Kiloton), by Production Analysis (Volume) 2025 & 2033
- Figure 25: North America Rice Industry in India Revenue Share (%), by Production Analysis (Volume) 2025 & 2033
- Figure 26: North America Rice Industry in India Volume Share (%), by Production Analysis (Volume) 2025 & 2033
- Figure 27: North America Rice Industry in India Revenue (Million), by Consumption Analysis (Value and Volume) 2025 & 2033
- Figure 28: North America Rice Industry in India Volume (Kiloton), by Consumption Analysis (Value and Volume) 2025 & 2033
- Figure 29: North America Rice Industry in India Revenue Share (%), by Consumption Analysis (Value and Volume) 2025 & 2033
- Figure 30: North America Rice Industry in India Volume Share (%), by Consumption Analysis (Value and Volume) 2025 & 2033
- Figure 31: North America Rice Industry in India Revenue (Million), by Import Analysis (Value and Volume) 2025 & 2033
- Figure 32: North America Rice Industry in India Volume (Kiloton), by Import Analysis (Value and Volume) 2025 & 2033
- Figure 33: North America Rice Industry in India Revenue Share (%), by Import Analysis (Value and Volume) 2025 & 2033
- Figure 34: North America Rice Industry in India Volume Share (%), by Import Analysis (Value and Volume) 2025 & 2033
- Figure 35: North America Rice Industry in India Revenue (Million), by Export Analysis (Value and Volume) 2025 & 2033
- Figure 36: North America Rice Industry in India Volume (Kiloton), by Export Analysis (Value and Volume) 2025 & 2033
- Figure 37: North America Rice Industry in India Revenue Share (%), by Export Analysis (Value and Volume) 2025 & 2033
- Figure 38: North America Rice Industry in India Volume Share (%), by Export Analysis (Value and Volume) 2025 & 2033
- Figure 39: North America Rice Industry in India Revenue (Million), by Price Trend Analysis 2025 & 2033
- Figure 40: North America Rice Industry in India Volume (Kiloton), by Price Trend Analysis 2025 & 2033
- Figure 41: North America Rice Industry in India Revenue Share (%), by Price Trend Analysis 2025 & 2033
- Figure 42: North America Rice Industry in India Volume Share (%), by Price Trend Analysis 2025 & 2033
- Figure 43: North America Rice Industry in India Revenue (Million), by Country 2025 & 2033
- Figure 44: North America Rice Industry in India Volume (Kiloton), by Country 2025 & 2033
- Figure 45: North America Rice Industry in India Revenue Share (%), by Country 2025 & 2033
- Figure 46: North America Rice Industry in India Volume Share (%), by Country 2025 & 2033
- Figure 47: South America Rice Industry in India Revenue (Million), by Production Analysis (Volume) 2025 & 2033
- Figure 48: South America Rice Industry in India Volume (Kiloton), by Production Analysis (Volume) 2025 & 2033
- Figure 49: South America Rice Industry in India Revenue Share (%), by Production Analysis (Volume) 2025 & 2033
- Figure 50: South America Rice Industry in India Volume Share (%), by Production Analysis (Volume) 2025 & 2033
- Figure 51: South America Rice Industry in India Revenue (Million), by Consumption Analysis (Value and Volume) 2025 & 2033
- Figure 52: South America Rice Industry in India Volume (Kiloton), by Consumption Analysis (Value and Volume) 2025 & 2033
- Figure 53: South America Rice Industry in India Revenue Share (%), by Consumption Analysis (Value and Volume) 2025 & 2033
- Figure 54: South America Rice Industry in India Volume Share (%), by Consumption Analysis (Value and Volume) 2025 & 2033
- Figure 55: South America Rice Industry in India Revenue (Million), by Import Analysis (Value and Volume) 2025 & 2033
- Figure 56: South America Rice Industry in India Volume (Kiloton), by Import Analysis (Value and Volume) 2025 & 2033
- Figure 57: South America Rice Industry in India Revenue Share (%), by Import Analysis (Value and Volume) 2025 & 2033
- Figure 58: South America Rice Industry in India Volume Share (%), by Import Analysis (Value and Volume) 2025 & 2033
- Figure 59: South America Rice Industry in India Revenue (Million), by Export Analysis (Value and Volume) 2025 & 2033
- Figure 60: South America Rice Industry in India Volume (Kiloton), by Export Analysis (Value and Volume) 2025 & 2033
- Figure 61: South America Rice Industry in India Revenue Share (%), by Export Analysis (Value and Volume) 2025 & 2033
- Figure 62: South America Rice Industry in India Volume Share (%), by Export Analysis (Value and Volume) 2025 & 2033
- Figure 63: South America Rice Industry in India Revenue (Million), by Price Trend Analysis 2025 & 2033
- Figure 64: South America Rice Industry in India Volume (Kiloton), by Price Trend Analysis 2025 & 2033
- Figure 65: South America Rice Industry in India Revenue Share (%), by Price Trend Analysis 2025 & 2033
- Figure 66: South America Rice Industry in India Volume Share (%), by Price Trend Analysis 2025 & 2033
- Figure 67: South America Rice Industry in India Revenue (Million), by Production Analysis (Volume) 2025 & 2033
- Figure 68: South America Rice Industry in India Volume (Kiloton), by Production Analysis (Volume) 2025 & 2033
- Figure 69: South America Rice Industry in India Revenue Share (%), by Production Analysis (Volume) 2025 & 2033
- Figure 70: South America Rice Industry in India Volume Share (%), by Production Analysis (Volume) 2025 & 2033
- Figure 71: South America Rice Industry in India Revenue (Million), by Consumption Analysis (Value and Volume) 2025 & 2033
- Figure 72: South America Rice Industry in India Volume (Kiloton), by Consumption Analysis (Value and Volume) 2025 & 2033
- Figure 73: South America Rice Industry in India Revenue Share (%), by Consumption Analysis (Value and Volume) 2025 & 2033
- Figure 74: South America Rice Industry in India Volume Share (%), by Consumption Analysis (Value and Volume) 2025 & 2033
- Figure 75: South America Rice Industry in India Revenue (Million), by Import Analysis (Value and Volume) 2025 & 2033
- Figure 76: South America Rice Industry in India Volume (Kiloton), by Import Analysis (Value and Volume) 2025 & 2033
- Figure 77: South America Rice Industry in India Revenue Share (%), by Import Analysis (Value and Volume) 2025 & 2033
- Figure 78: South America Rice Industry in India Volume Share (%), by Import Analysis (Value and Volume) 2025 & 2033
- Figure 79: South America Rice Industry in India Revenue (Million), by Export Analysis (Value and Volume) 2025 & 2033
- Figure 80: South America Rice Industry in India Volume (Kiloton), by Export Analysis (Value and Volume) 2025 & 2033
- Figure 81: South America Rice Industry in India Revenue Share (%), by Export Analysis (Value and Volume) 2025 & 2033
- Figure 82: South America Rice Industry in India Volume Share (%), by Export Analysis (Value and Volume) 2025 & 2033
- Figure 83: South America Rice Industry in India Revenue (Million), by Price Trend Analysis 2025 & 2033
- Figure 84: South America Rice Industry in India Volume (Kiloton), by Price Trend Analysis 2025 & 2033
- Figure 85: South America Rice Industry in India Revenue Share (%), by Price Trend Analysis 2025 & 2033
- Figure 86: South America Rice Industry in India Volume Share (%), by Price Trend Analysis 2025 & 2033
- Figure 87: South America Rice Industry in India Revenue (Million), by Country 2025 & 2033
- Figure 88: South America Rice Industry in India Volume (Kiloton), by Country 2025 & 2033
- Figure 89: South America Rice Industry in India Revenue Share (%), by Country 2025 & 2033
- Figure 90: South America Rice Industry in India Volume Share (%), by Country 2025 & 2033
- Figure 91: Europe Rice Industry in India Revenue (Million), by Production Analysis (Volume) 2025 & 2033
- Figure 92: Europe Rice Industry in India Volume (Kiloton), by Production Analysis (Volume) 2025 & 2033
- Figure 93: Europe Rice Industry in India Revenue Share (%), by Production Analysis (Volume) 2025 & 2033
- Figure 94: Europe Rice Industry in India Volume Share (%), by Production Analysis (Volume) 2025 & 2033
- Figure 95: Europe Rice Industry in India Revenue (Million), by Consumption Analysis (Value and Volume) 2025 & 2033
- Figure 96: Europe Rice Industry in India Volume (Kiloton), by Consumption Analysis (Value and Volume) 2025 & 2033
- Figure 97: Europe Rice Industry in India Revenue Share (%), by Consumption Analysis (Value and Volume) 2025 & 2033
- Figure 98: Europe Rice Industry in India Volume Share (%), by Consumption Analysis (Value and Volume) 2025 & 2033
- Figure 99: Europe Rice Industry in India Revenue (Million), by Import Analysis (Value and Volume) 2025 & 2033
- Figure 100: Europe Rice Industry in India Volume (Kiloton), by Import Analysis (Value and Volume) 2025 & 2033
- Figure 101: Europe Rice Industry in India Revenue Share (%), by Import Analysis (Value and Volume) 2025 & 2033
- Figure 102: Europe Rice Industry in India Volume Share (%), by Import Analysis (Value and Volume) 2025 & 2033
- Figure 103: Europe Rice Industry in India Revenue (Million), by Export Analysis (Value and Volume) 2025 & 2033
- Figure 104: Europe Rice Industry in India Volume (Kiloton), by Export Analysis (Value and Volume) 2025 & 2033
- Figure 105: Europe Rice Industry in India Revenue Share (%), by Export Analysis (Value and Volume) 2025 & 2033
- Figure 106: Europe Rice Industry in India Volume Share (%), by Export Analysis (Value and Volume) 2025 & 2033
- Figure 107: Europe Rice Industry in India Revenue (Million), by Price Trend Analysis 2025 & 2033
- Figure 108: Europe Rice Industry in India Volume (Kiloton), by Price Trend Analysis 2025 & 2033
- Figure 109: Europe Rice Industry in India Revenue Share (%), by Price Trend Analysis 2025 & 2033
- Figure 110: Europe Rice Industry in India Volume Share (%), by Price Trend Analysis 2025 & 2033
- Figure 111: Europe Rice Industry in India Revenue (Million), by Production Analysis (Volume) 2025 & 2033
- Figure 112: Europe Rice Industry in India Volume (Kiloton), by Production Analysis (Volume) 2025 & 2033
- Figure 113: Europe Rice Industry in India Revenue Share (%), by Production Analysis (Volume) 2025 & 2033
- Figure 114: Europe Rice Industry in India Volume Share (%), by Production Analysis (Volume) 2025 & 2033
- Figure 115: Europe Rice Industry in India Revenue (Million), by Consumption Analysis (Value and Volume) 2025 & 2033
- Figure 116: Europe Rice Industry in India Volume (Kiloton), by Consumption Analysis (Value and Volume) 2025 & 2033
- Figure 117: Europe Rice Industry in India Revenue Share (%), by Consumption Analysis (Value and Volume) 2025 & 2033
- Figure 118: Europe Rice Industry in India Volume Share (%), by Consumption Analysis (Value and Volume) 2025 & 2033
- Figure 119: Europe Rice Industry in India Revenue (Million), by Import Analysis (Value and Volume) 2025 & 2033
- Figure 120: Europe Rice Industry in India Volume (Kiloton), by Import Analysis (Value and Volume) 2025 & 2033
- Figure 121: Europe Rice Industry in India Revenue Share (%), by Import Analysis (Value and Volume) 2025 & 2033
- Figure 122: Europe Rice Industry in India Volume Share (%), by Import Analysis (Value and Volume) 2025 & 2033
- Figure 123: Europe Rice Industry in India Revenue (Million), by Export Analysis (Value and Volume) 2025 & 2033
- Figure 124: Europe Rice Industry in India Volume (Kiloton), by Export Analysis (Value and Volume) 2025 & 2033
- Figure 125: Europe Rice Industry in India Revenue Share (%), by Export Analysis (Value and Volume) 2025 & 2033
- Figure 126: Europe Rice Industry in India Volume Share (%), by Export Analysis (Value and Volume) 2025 & 2033
- Figure 127: Europe Rice Industry in India Revenue (Million), by Price Trend Analysis 2025 & 2033
- Figure 128: Europe Rice Industry in India Volume (Kiloton), by Price Trend Analysis 2025 & 2033
- Figure 129: Europe Rice Industry in India Revenue Share (%), by Price Trend Analysis 2025 & 2033
- Figure 130: Europe Rice Industry in India Volume Share (%), by Price Trend Analysis 2025 & 2033
- Figure 131: Europe Rice Industry in India Revenue (Million), by Country 2025 & 2033
- Figure 132: Europe Rice Industry in India Volume (Kiloton), by Country 2025 & 2033
- Figure 133: Europe Rice Industry in India Revenue Share (%), by Country 2025 & 2033
- Figure 134: Europe Rice Industry in India Volume Share (%), by Country 2025 & 2033
- Figure 135: Middle East & Africa Rice Industry in India Revenue (Million), by Production Analysis (Volume) 2025 & 2033
- Figure 136: Middle East & Africa Rice Industry in India Volume (Kiloton), by Production Analysis (Volume) 2025 & 2033
- Figure 137: Middle East & Africa Rice Industry in India Revenue Share (%), by Production Analysis (Volume) 2025 & 2033
- Figure 138: Middle East & Africa Rice Industry in India Volume Share (%), by Production Analysis (Volume) 2025 & 2033
- Figure 139: Middle East & Africa Rice Industry in India Revenue (Million), by Consumption Analysis (Value and Volume) 2025 & 2033
- Figure 140: Middle East & Africa Rice Industry in India Volume (Kiloton), by Consumption Analysis (Value and Volume) 2025 & 2033
- Figure 141: Middle East & Africa Rice Industry in India Revenue Share (%), by Consumption Analysis (Value and Volume) 2025 & 2033
- Figure 142: Middle East & Africa Rice Industry in India Volume Share (%), by Consumption Analysis (Value and Volume) 2025 & 2033
- Figure 143: Middle East & Africa Rice Industry in India Revenue (Million), by Import Analysis (Value and Volume) 2025 & 2033
- Figure 144: Middle East & Africa Rice Industry in India Volume (Kiloton), by Import Analysis (Value and Volume) 2025 & 2033
- Figure 145: Middle East & Africa Rice Industry in India Revenue Share (%), by Import Analysis (Value and Volume) 2025 & 2033
- Figure 146: Middle East & Africa Rice Industry in India Volume Share (%), by Import Analysis (Value and Volume) 2025 & 2033
- Figure 147: Middle East & Africa Rice Industry in India Revenue (Million), by Export Analysis (Value and Volume) 2025 & 2033
- Figure 148: Middle East & Africa Rice Industry in India Volume (Kiloton), by Export Analysis (Value and Volume) 2025 & 2033
- Figure 149: Middle East & Africa Rice Industry in India Revenue Share (%), by Export Analysis (Value and Volume) 2025 & 2033
- Figure 150: Middle East & Africa Rice Industry in India Volume Share (%), by Export Analysis (Value and Volume) 2025 & 2033
- Figure 151: Middle East & Africa Rice Industry in India Revenue (Million), by Price Trend Analysis 2025 & 2033
- Figure 152: Middle East & Africa Rice Industry in India Volume (Kiloton), by Price Trend Analysis 2025 & 2033
- Figure 153: Middle East & Africa Rice Industry in India Revenue Share (%), by Price Trend Analysis 2025 & 2033
- Figure 154: Middle East & Africa Rice Industry in India Volume Share (%), by Price Trend Analysis 2025 & 2033
- Figure 155: Middle East & Africa Rice Industry in India Revenue (Million), by Production Analysis (Volume) 2025 & 2033
- Figure 156: Middle East & Africa Rice Industry in India Volume (Kiloton), by Production Analysis (Volume) 2025 & 2033
- Figure 157: Middle East & Africa Rice Industry in India Revenue Share (%), by Production Analysis (Volume) 2025 & 2033
- Figure 158: Middle East & Africa Rice Industry in India Volume Share (%), by Production Analysis (Volume) 2025 & 2033
- Figure 159: Middle East & Africa Rice Industry in India Revenue (Million), by Consumption Analysis (Value and Volume) 2025 & 2033
- Figure 160: Middle East & Africa Rice Industry in India Volume (Kiloton), by Consumption Analysis (Value and Volume) 2025 & 2033
- Figure 161: Middle East & Africa Rice Industry in India Revenue Share (%), by Consumption Analysis (Value and Volume) 2025 & 2033
- Figure 162: Middle East & Africa Rice Industry in India Volume Share (%), by Consumption Analysis (Value and Volume) 2025 & 2033
- Figure 163: Middle East & Africa Rice Industry in India Revenue (Million), by Import Analysis (Value and Volume) 2025 & 2033
- Figure 164: Middle East & Africa Rice Industry in India Volume (Kiloton), by Import Analysis (Value and Volume) 2025 & 2033
- Figure 165: Middle East & Africa Rice Industry in India Revenue Share (%), by Import Analysis (Value and Volume) 2025 & 2033
- Figure 166: Middle East & Africa Rice Industry in India Volume Share (%), by Import Analysis (Value and Volume) 2025 & 2033
- Figure 167: Middle East & Africa Rice Industry in India Revenue (Million), by Export Analysis (Value and Volume) 2025 & 2033
- Figure 168: Middle East & Africa Rice Industry in India Volume (Kiloton), by Export Analysis (Value and Volume) 2025 & 2033
- Figure 169: Middle East & Africa Rice Industry in India Revenue Share (%), by Export Analysis (Value and Volume) 2025 & 2033
- Figure 170: Middle East & Africa Rice Industry in India Volume Share (%), by Export Analysis (Value and Volume) 2025 & 2033
- Figure 171: Middle East & Africa Rice Industry in India Revenue (Million), by Price Trend Analysis 2025 & 2033
- Figure 172: Middle East & Africa Rice Industry in India Volume (Kiloton), by Price Trend Analysis 2025 & 2033
- Figure 173: Middle East & Africa Rice Industry in India Revenue Share (%), by Price Trend Analysis 2025 & 2033
- Figure 174: Middle East & Africa Rice Industry in India Volume Share (%), by Price Trend Analysis 2025 & 2033
- Figure 175: Middle East & Africa Rice Industry in India Revenue (Million), by Country 2025 & 2033
- Figure 176: Middle East & Africa Rice Industry in India Volume (Kiloton), by Country 2025 & 2033
- Figure 177: Middle East & Africa Rice Industry in India Revenue Share (%), by Country 2025 & 2033
- Figure 178: Middle East & Africa Rice Industry in India Volume Share (%), by Country 2025 & 2033
- Figure 179: Asia Pacific Rice Industry in India Revenue (Million), by Production Analysis (Volume) 2025 & 2033
- Figure 180: Asia Pacific Rice Industry in India Volume (Kiloton), by Production Analysis (Volume) 2025 & 2033
- Figure 181: Asia Pacific Rice Industry in India Revenue Share (%), by Production Analysis (Volume) 2025 & 2033
- Figure 182: Asia Pacific Rice Industry in India Volume Share (%), by Production Analysis (Volume) 2025 & 2033
- Figure 183: Asia Pacific Rice Industry in India Revenue (Million), by Consumption Analysis (Value and Volume) 2025 & 2033
- Figure 184: Asia Pacific Rice Industry in India Volume (Kiloton), by Consumption Analysis (Value and Volume) 2025 & 2033
- Figure 185: Asia Pacific Rice Industry in India Revenue Share (%), by Consumption Analysis (Value and Volume) 2025 & 2033
- Figure 186: Asia Pacific Rice Industry in India Volume Share (%), by Consumption Analysis (Value and Volume) 2025 & 2033
- Figure 187: Asia Pacific Rice Industry in India Revenue (Million), by Import Analysis (Value and Volume) 2025 & 2033
- Figure 188: Asia Pacific Rice Industry in India Volume (Kiloton), by Import Analysis (Value and Volume) 2025 & 2033
- Figure 189: Asia Pacific Rice Industry in India Revenue Share (%), by Import Analysis (Value and Volume) 2025 & 2033
- Figure 190: Asia Pacific Rice Industry in India Volume Share (%), by Import Analysis (Value and Volume) 2025 & 2033
- Figure 191: Asia Pacific Rice Industry in India Revenue (Million), by Export Analysis (Value and Volume) 2025 & 2033
- Figure 192: Asia Pacific Rice Industry in India Volume (Kiloton), by Export Analysis (Value and Volume) 2025 & 2033
- Figure 193: Asia Pacific Rice Industry in India Revenue Share (%), by Export Analysis (Value and Volume) 2025 & 2033
- Figure 194: Asia Pacific Rice Industry in India Volume Share (%), by Export Analysis (Value and Volume) 2025 & 2033
- Figure 195: Asia Pacific Rice Industry in India Revenue (Million), by Price Trend Analysis 2025 & 2033
- Figure 196: Asia Pacific Rice Industry in India Volume (Kiloton), by Price Trend Analysis 2025 & 2033
- Figure 197: Asia Pacific Rice Industry in India Revenue Share (%), by Price Trend Analysis 2025 & 2033
- Figure 198: Asia Pacific Rice Industry in India Volume Share (%), by Price Trend Analysis 2025 & 2033
- Figure 199: Asia Pacific Rice Industry in India Revenue (Million), by Production Analysis (Volume) 2025 & 2033
- Figure 200: Asia Pacific Rice Industry in India Volume (Kiloton), by Production Analysis (Volume) 2025 & 2033
- Figure 201: Asia Pacific Rice Industry in India Revenue Share (%), by Production Analysis (Volume) 2025 & 2033
- Figure 202: Asia Pacific Rice Industry in India Volume Share (%), by Production Analysis (Volume) 2025 & 2033
- Figure 203: Asia Pacific Rice Industry in India Revenue (Million), by Consumption Analysis (Value and Volume) 2025 & 2033
- Figure 204: Asia Pacific Rice Industry in India Volume (Kiloton), by Consumption Analysis (Value and Volume) 2025 & 2033
- Figure 205: Asia Pacific Rice Industry in India Revenue Share (%), by Consumption Analysis (Value and Volume) 2025 & 2033
- Figure 206: Asia Pacific Rice Industry in India Volume Share (%), by Consumption Analysis (Value and Volume) 2025 & 2033
- Figure 207: Asia Pacific Rice Industry in India Revenue (Million), by Import Analysis (Value and Volume) 2025 & 2033
- Figure 208: Asia Pacific Rice Industry in India Volume (Kiloton), by Import Analysis (Value and Volume) 2025 & 2033
- Figure 209: Asia Pacific Rice Industry in India Revenue Share (%), by Import Analysis (Value and Volume) 2025 & 2033
- Figure 210: Asia Pacific Rice Industry in India Volume Share (%), by Import Analysis (Value and Volume) 2025 & 2033
- Figure 211: Asia Pacific Rice Industry in India Revenue (Million), by Export Analysis (Value and Volume) 2025 & 2033
- Figure 212: Asia Pacific Rice Industry in India Volume (Kiloton), by Export Analysis (Value and Volume) 2025 & 2033
- Figure 213: Asia Pacific Rice Industry in India Revenue Share (%), by Export Analysis (Value and Volume) 2025 & 2033
- Figure 214: Asia Pacific Rice Industry in India Volume Share (%), by Export Analysis (Value and Volume) 2025 & 2033
- Figure 215: Asia Pacific Rice Industry in India Revenue (Million), by Price Trend Analysis 2025 & 2033
- Figure 216: Asia Pacific Rice Industry in India Volume (Kiloton), by Price Trend Analysis 2025 & 2033
- Figure 217: Asia Pacific Rice Industry in India Revenue Share (%), by Price Trend Analysis 2025 & 2033
- Figure 218: Asia Pacific Rice Industry in India Volume Share (%), by Price Trend Analysis 2025 & 2033
- Figure 219: Asia Pacific Rice Industry in India Revenue (Million), by Country 2025 & 2033
- Figure 220: Asia Pacific Rice Industry in India Volume (Kiloton), by Country 2025 & 2033
- Figure 221: Asia Pacific Rice Industry in India Revenue Share (%), by Country 2025 & 2033
- Figure 222: Asia Pacific Rice Industry in India Volume Share (%), by Country 2025 & 2033
List of Tables
- Table 1: Global Rice Industry in India Revenue Million Forecast, by Production Analysis (Volume) 2020 & 2033
- Table 2: Global Rice Industry in India Volume Kiloton Forecast, by Production Analysis (Volume) 2020 & 2033
- Table 3: Global Rice Industry in India Revenue Million Forecast, by Consumption Analysis (Value and Volume) 2020 & 2033
- Table 4: Global Rice Industry in India Volume Kiloton Forecast, by Consumption Analysis (Value and Volume) 2020 & 2033
- Table 5: Global Rice Industry in India Revenue Million Forecast, by Import Analysis (Value and Volume) 2020 & 2033
- Table 6: Global Rice Industry in India Volume Kiloton Forecast, by Import Analysis (Value and Volume) 2020 & 2033
- Table 7: Global Rice Industry in India Revenue Million Forecast, by Export Analysis (Value and Volume) 2020 & 2033
- Table 8: Global Rice Industry in India Volume Kiloton Forecast, by Export Analysis (Value and Volume) 2020 & 2033
- Table 9: Global Rice Industry in India Revenue Million Forecast, by Price Trend Analysis 2020 & 2033
- Table 10: Global Rice Industry in India Volume Kiloton Forecast, by Price Trend Analysis 2020 & 2033
- Table 11: Global Rice Industry in India Revenue Million Forecast, by Production Analysis (Volume) 2020 & 2033
- Table 12: Global Rice Industry in India Volume Kiloton Forecast, by Production Analysis (Volume) 2020 & 2033
- Table 13: Global Rice Industry in India Revenue Million Forecast, by Consumption Analysis (Value and Volume) 2020 & 2033
- Table 14: Global Rice Industry in India Volume Kiloton Forecast, by Consumption Analysis (Value and Volume) 2020 & 2033
- Table 15: Global Rice Industry in India Revenue Million Forecast, by Import Analysis (Value and Volume) 2020 & 2033
- Table 16: Global Rice Industry in India Volume Kiloton Forecast, by Import Analysis (Value and Volume) 2020 & 2033
- Table 17: Global Rice Industry in India Revenue Million Forecast, by Export Analysis (Value and Volume) 2020 & 2033
- Table 18: Global Rice Industry in India Volume Kiloton Forecast, by Export Analysis (Value and Volume) 2020 & 2033
- Table 19: Global Rice Industry in India Revenue Million Forecast, by Price Trend Analysis 2020 & 2033
- Table 20: Global Rice Industry in India Volume Kiloton Forecast, by Price Trend Analysis 2020 & 2033
- Table 21: Global Rice Industry in India Revenue Million Forecast, by Region 2020 & 2033
- Table 22: Global Rice Industry in India Volume Kiloton Forecast, by Region 2020 & 2033
- Table 23: Global Rice Industry in India Revenue Million Forecast, by Production Analysis (Volume) 2020 & 2033
- Table 24: Global Rice Industry in India Volume Kiloton Forecast, by Production Analysis (Volume) 2020 & 2033
- Table 25: Global Rice Industry in India Revenue Million Forecast, by Consumption Analysis (Value and Volume) 2020 & 2033
- Table 26: Global Rice Industry in India Volume Kiloton Forecast, by Consumption Analysis (Value and Volume) 2020 & 2033
- Table 27: Global Rice Industry in India Revenue Million Forecast, by Import Analysis (Value and Volume) 2020 & 2033
- Table 28: Global Rice Industry in India Volume Kiloton Forecast, by Import Analysis (Value and Volume) 2020 & 2033
- Table 29: Global Rice Industry in India Revenue Million Forecast, by Export Analysis (Value and Volume) 2020 & 2033
- Table 30: Global Rice Industry in India Volume Kiloton Forecast, by Export Analysis (Value and Volume) 2020 & 2033
- Table 31: Global Rice Industry in India Revenue Million Forecast, by Price Trend Analysis 2020 & 2033
- Table 32: Global Rice Industry in India Volume Kiloton Forecast, by Price Trend Analysis 2020 & 2033
- Table 33: Global Rice Industry in India Revenue Million Forecast, by Production Analysis (Volume) 2020 & 2033
- Table 34: Global Rice Industry in India Volume Kiloton Forecast, by Production Analysis (Volume) 2020 & 2033
- Table 35: Global Rice Industry in India Revenue Million Forecast, by Consumption Analysis (Value and Volume) 2020 & 2033
- Table 36: Global Rice Industry in India Volume Kiloton Forecast, by Consumption Analysis (Value and Volume) 2020 & 2033
- Table 37: Global Rice Industry in India Revenue Million Forecast, by Import Analysis (Value and Volume) 2020 & 2033
- Table 38: Global Rice Industry in India Volume Kiloton Forecast, by Import Analysis (Value and Volume) 2020 & 2033
- Table 39: Global Rice Industry in India Revenue Million Forecast, by Export Analysis (Value and Volume) 2020 & 2033
- Table 40: Global Rice Industry in India Volume Kiloton Forecast, by Export Analysis (Value and Volume) 2020 & 2033
- Table 41: Global Rice Industry in India Revenue Million Forecast, by Price Trend Analysis 2020 & 2033
- Table 42: Global Rice Industry in India Volume Kiloton Forecast, by Price Trend Analysis 2020 & 2033
- Table 43: Global Rice Industry in India Revenue Million Forecast, by Country 2020 & 2033
- Table 44: Global Rice Industry in India Volume Kiloton Forecast, by Country 2020 & 2033
- Table 45: United States Rice Industry in India Revenue (Million) Forecast, by Application 2020 & 2033
- Table 46: United States Rice Industry in India Volume (Kiloton) Forecast, by Application 2020 & 2033
- Table 47: Canada Rice Industry in India Revenue (Million) Forecast, by Application 2020 & 2033
- Table 48: Canada Rice Industry in India Volume (Kiloton) Forecast, by Application 2020 & 2033
- Table 49: Mexico Rice Industry in India Revenue (Million) Forecast, by Application 2020 & 2033
- Table 50: Mexico Rice Industry in India Volume (Kiloton) Forecast, by Application 2020 & 2033
- Table 51: Global Rice Industry in India Revenue Million Forecast, by Production Analysis (Volume) 2020 & 2033
- Table 52: Global Rice Industry in India Volume Kiloton Forecast, by Production Analysis (Volume) 2020 & 2033
- Table 53: Global Rice Industry in India Revenue Million Forecast, by Consumption Analysis (Value and Volume) 2020 & 2033
- Table 54: Global Rice Industry in India Volume Kiloton Forecast, by Consumption Analysis (Value and Volume) 2020 & 2033
- Table 55: Global Rice Industry in India Revenue Million Forecast, by Import Analysis (Value and Volume) 2020 & 2033
- Table 56: Global Rice Industry in India Volume Kiloton Forecast, by Import Analysis (Value and Volume) 2020 & 2033
- Table 57: Global Rice Industry in India Revenue Million Forecast, by Export Analysis (Value and Volume) 2020 & 2033
- Table 58: Global Rice Industry in India Volume Kiloton Forecast, by Export Analysis (Value and Volume) 2020 & 2033
- Table 59: Global Rice Industry in India Revenue Million Forecast, by Price Trend Analysis 2020 & 2033
- Table 60: Global Rice Industry in India Volume Kiloton Forecast, by Price Trend Analysis 2020 & 2033
- Table 61: Global Rice Industry in India Revenue Million Forecast, by Production Analysis (Volume) 2020 & 2033
- Table 62: Global Rice Industry in India Volume Kiloton Forecast, by Production Analysis (Volume) 2020 & 2033
- Table 63: Global Rice Industry in India Revenue Million Forecast, by Consumption Analysis (Value and Volume) 2020 & 2033
- Table 64: Global Rice Industry in India Volume Kiloton Forecast, by Consumption Analysis (Value and Volume) 2020 & 2033
- Table 65: Global Rice Industry in India Revenue Million Forecast, by Import Analysis (Value and Volume) 2020 & 2033
- Table 66: Global Rice Industry in India Volume Kiloton Forecast, by Import Analysis (Value and Volume) 2020 & 2033
- Table 67: Global Rice Industry in India Revenue Million Forecast, by Export Analysis (Value and Volume) 2020 & 2033
- Table 68: Global Rice Industry in India Volume Kiloton Forecast, by Export Analysis (Value and Volume) 2020 & 2033
- Table 69: Global Rice Industry in India Revenue Million Forecast, by Price Trend Analysis 2020 & 2033
- Table 70: Global Rice Industry in India Volume Kiloton Forecast, by Price Trend Analysis 2020 & 2033
- Table 71: Global Rice Industry in India Revenue Million Forecast, by Country 2020 & 2033
- Table 72: Global Rice Industry in India Volume Kiloton Forecast, by Country 2020 & 2033
- Table 73: Brazil Rice Industry in India Revenue (Million) Forecast, by Application 2020 & 2033
- Table 74: Brazil Rice Industry in India Volume (Kiloton) Forecast, by Application 2020 & 2033
- Table 75: Argentina Rice Industry in India Revenue (Million) Forecast, by Application 2020 & 2033
- Table 76: Argentina Rice Industry in India Volume (Kiloton) Forecast, by Application 2020 & 2033
- Table 77: Rest of South America Rice Industry in India Revenue (Million) Forecast, by Application 2020 & 2033
- Table 78: Rest of South America Rice Industry in India Volume (Kiloton) Forecast, by Application 2020 & 2033
- Table 79: Global Rice Industry in India Revenue Million Forecast, by Production Analysis (Volume) 2020 & 2033
- Table 80: Global Rice Industry in India Volume Kiloton Forecast, by Production Analysis (Volume) 2020 & 2033
- Table 81: Global Rice Industry in India Revenue Million Forecast, by Consumption Analysis (Value and Volume) 2020 & 2033
- Table 82: Global Rice Industry in India Volume Kiloton Forecast, by Consumption Analysis (Value and Volume) 2020 & 2033
- Table 83: Global Rice Industry in India Revenue Million Forecast, by Import Analysis (Value and Volume) 2020 & 2033
- Table 84: Global Rice Industry in India Volume Kiloton Forecast, by Import Analysis (Value and Volume) 2020 & 2033
- Table 85: Global Rice Industry in India Revenue Million Forecast, by Export Analysis (Value and Volume) 2020 & 2033
- Table 86: Global Rice Industry in India Volume Kiloton Forecast, by Export Analysis (Value and Volume) 2020 & 2033
- Table 87: Global Rice Industry in India Revenue Million Forecast, by Price Trend Analysis 2020 & 2033
- Table 88: Global Rice Industry in India Volume Kiloton Forecast, by Price Trend Analysis 2020 & 2033
- Table 89: Global Rice Industry in India Revenue Million Forecast, by Production Analysis (Volume) 2020 & 2033
- Table 90: Global Rice Industry in India Volume Kiloton Forecast, by Production Analysis (Volume) 2020 & 2033
- Table 91: Global Rice Industry in India Revenue Million Forecast, by Consumption Analysis (Value and Volume) 2020 & 2033
- Table 92: Global Rice Industry in India Volume Kiloton Forecast, by Consumption Analysis (Value and Volume) 2020 & 2033
- Table 93: Global Rice Industry in India Revenue Million Forecast, by Import Analysis (Value and Volume) 2020 & 2033
- Table 94: Global Rice Industry in India Volume Kiloton Forecast, by Import Analysis (Value and Volume) 2020 & 2033
- Table 95: Global Rice Industry in India Revenue Million Forecast, by Export Analysis (Value and Volume) 2020 & 2033
- Table 96: Global Rice Industry in India Volume Kiloton Forecast, by Export Analysis (Value and Volume) 2020 & 2033
- Table 97: Global Rice Industry in India Revenue Million Forecast, by Price Trend Analysis 2020 & 2033
- Table 98: Global Rice Industry in India Volume Kiloton Forecast, by Price Trend Analysis 2020 & 2033
- Table 99: Global Rice Industry in India Revenue Million Forecast, by Country 2020 & 2033
- Table 100: Global Rice Industry in India Volume Kiloton Forecast, by Country 2020 & 2033
- Table 101: United Kingdom Rice Industry in India Revenue (Million) Forecast, by Application 2020 & 2033
- Table 102: United Kingdom Rice Industry in India Volume (Kiloton) Forecast, by Application 2020 & 2033
- Table 103: Germany Rice Industry in India Revenue (Million) Forecast, by Application 2020 & 2033
- Table 104: Germany Rice Industry in India Volume (Kiloton) Forecast, by Application 2020 & 2033
- Table 105: France Rice Industry in India Revenue (Million) Forecast, by Application 2020 & 2033
- Table 106: France Rice Industry in India Volume (Kiloton) Forecast, by Application 2020 & 2033
- Table 107: Italy Rice Industry in India Revenue (Million) Forecast, by Application 2020 & 2033
- Table 108: Italy Rice Industry in India Volume (Kiloton) Forecast, by Application 2020 & 2033
- Table 109: Spain Rice Industry in India Revenue (Million) Forecast, by Application 2020 & 2033
- Table 110: Spain Rice Industry in India Volume (Kiloton) Forecast, by Application 2020 & 2033
- Table 111: Russia Rice Industry in India Revenue (Million) Forecast, by Application 2020 & 2033
- Table 112: Russia Rice Industry in India Volume (Kiloton) Forecast, by Application 2020 & 2033
- Table 113: Benelux Rice Industry in India Revenue (Million) Forecast, by Application 2020 & 2033
- Table 114: Benelux Rice Industry in India Volume (Kiloton) Forecast, by Application 2020 & 2033
- Table 115: Nordics Rice Industry in India Revenue (Million) Forecast, by Application 2020 & 2033
- Table 116: Nordics Rice Industry in India Volume (Kiloton) Forecast, by Application 2020 & 2033
- Table 117: Rest of Europe Rice Industry in India Revenue (Million) Forecast, by Application 2020 & 2033
- Table 118: Rest of Europe Rice Industry in India Volume (Kiloton) Forecast, by Application 2020 & 2033
- Table 119: Global Rice Industry in India Revenue Million Forecast, by Production Analysis (Volume) 2020 & 2033
- Table 120: Global Rice Industry in India Volume Kiloton Forecast, by Production Analysis (Volume) 2020 & 2033
- Table 121: Global Rice Industry in India Revenue Million Forecast, by Consumption Analysis (Value and Volume) 2020 & 2033
- Table 122: Global Rice Industry in India Volume Kiloton Forecast, by Consumption Analysis (Value and Volume) 2020 & 2033
- Table 123: Global Rice Industry in India Revenue Million Forecast, by Import Analysis (Value and Volume) 2020 & 2033
- Table 124: Global Rice Industry in India Volume Kiloton Forecast, by Import Analysis (Value and Volume) 2020 & 2033
- Table 125: Global Rice Industry in India Revenue Million Forecast, by Export Analysis (Value and Volume) 2020 & 2033
- Table 126: Global Rice Industry in India Volume Kiloton Forecast, by Export Analysis (Value and Volume) 2020 & 2033
- Table 127: Global Rice Industry in India Revenue Million Forecast, by Price Trend Analysis 2020 & 2033
- Table 128: Global Rice Industry in India Volume Kiloton Forecast, by Price Trend Analysis 2020 & 2033
- Table 129: Global Rice Industry in India Revenue Million Forecast, by Production Analysis (Volume) 2020 & 2033
- Table 130: Global Rice Industry in India Volume Kiloton Forecast, by Production Analysis (Volume) 2020 & 2033
- Table 131: Global Rice Industry in India Revenue Million Forecast, by Consumption Analysis (Value and Volume) 2020 & 2033
- Table 132: Global Rice Industry in India Volume Kiloton Forecast, by Consumption Analysis (Value and Volume) 2020 & 2033
- Table 133: Global Rice Industry in India Revenue Million Forecast, by Import Analysis (Value and Volume) 2020 & 2033
- Table 134: Global Rice Industry in India Volume Kiloton Forecast, by Import Analysis (Value and Volume) 2020 & 2033
- Table 135: Global Rice Industry in India Revenue Million Forecast, by Export Analysis (Value and Volume) 2020 & 2033
- Table 136: Global Rice Industry in India Volume Kiloton Forecast, by Export Analysis (Value and Volume) 2020 & 2033
- Table 137: Global Rice Industry in India Revenue Million Forecast, by Price Trend Analysis 2020 & 2033
- Table 138: Global Rice Industry in India Volume Kiloton Forecast, by Price Trend Analysis 2020 & 2033
- Table 139: Global Rice Industry in India Revenue Million Forecast, by Country 2020 & 2033
- Table 140: Global Rice Industry in India Volume Kiloton Forecast, by Country 2020 & 2033
- Table 141: Turkey Rice Industry in India Revenue (Million) Forecast, by Application 2020 & 2033
- Table 142: Turkey Rice Industry in India Volume (Kiloton) Forecast, by Application 2020 & 2033
- Table 143: Israel Rice Industry in India Revenue (Million) Forecast, by Application 2020 & 2033
- Table 144: Israel Rice Industry in India Volume (Kiloton) Forecast, by Application 2020 & 2033
- Table 145: GCC Rice Industry in India Revenue (Million) Forecast, by Application 2020 & 2033
- Table 146: GCC Rice Industry in India Volume (Kiloton) Forecast, by Application 2020 & 2033
- Table 147: North Africa Rice Industry in India Revenue (Million) Forecast, by Application 2020 & 2033
- Table 148: North Africa Rice Industry in India Volume (Kiloton) Forecast, by Application 2020 & 2033
- Table 149: South Africa Rice Industry in India Revenue (Million) Forecast, by Application 2020 & 2033
- Table 150: South Africa Rice Industry in India Volume (Kiloton) Forecast, by Application 2020 & 2033
- Table 151: Rest of Middle East & Africa Rice Industry in India Revenue (Million) Forecast, by Application 2020 & 2033
- Table 152: Rest of Middle East & Africa Rice Industry in India Volume (Kiloton) Forecast, by Application 2020 & 2033
- Table 153: Global Rice Industry in India Revenue Million Forecast, by Production Analysis (Volume) 2020 & 2033
- Table 154: Global Rice Industry in India Volume Kiloton Forecast, by Production Analysis (Volume) 2020 & 2033
- Table 155: Global Rice Industry in India Revenue Million Forecast, by Consumption Analysis (Value and Volume) 2020 & 2033
- Table 156: Global Rice Industry in India Volume Kiloton Forecast, by Consumption Analysis (Value and Volume) 2020 & 2033
- Table 157: Global Rice Industry in India Revenue Million Forecast, by Import Analysis (Value and Volume) 2020 & 2033
- Table 158: Global Rice Industry in India Volume Kiloton Forecast, by Import Analysis (Value and Volume) 2020 & 2033
- Table 159: Global Rice Industry in India Revenue Million Forecast, by Export Analysis (Value and Volume) 2020 & 2033
- Table 160: Global Rice Industry in India Volume Kiloton Forecast, by Export Analysis (Value and Volume) 2020 & 2033
- Table 161: Global Rice Industry in India Revenue Million Forecast, by Price Trend Analysis 2020 & 2033
- Table 162: Global Rice Industry in India Volume Kiloton Forecast, by Price Trend Analysis 2020 & 2033
- Table 163: Global Rice Industry in India Revenue Million Forecast, by Production Analysis (Volume) 2020 & 2033
- Table 164: Global Rice Industry in India Volume Kiloton Forecast, by Production Analysis (Volume) 2020 & 2033
- Table 165: Global Rice Industry in India Revenue Million Forecast, by Consumption Analysis (Value and Volume) 2020 & 2033
- Table 166: Global Rice Industry in India Volume Kiloton Forecast, by Consumption Analysis (Value and Volume) 2020 & 2033
- Table 167: Global Rice Industry in India Revenue Million Forecast, by Import Analysis (Value and Volume) 2020 & 2033
- Table 168: Global Rice Industry in India Volume Kiloton Forecast, by Import Analysis (Value and Volume) 2020 & 2033
- Table 169: Global Rice Industry in India Revenue Million Forecast, by Export Analysis (Value and Volume) 2020 & 2033
- Table 170: Global Rice Industry in India Volume Kiloton Forecast, by Export Analysis (Value and Volume) 2020 & 2033
- Table 171: Global Rice Industry in India Revenue Million Forecast, by Price Trend Analysis 2020 & 2033
- Table 172: Global Rice Industry in India Volume Kiloton Forecast, by Price Trend Analysis 2020 & 2033
- Table 173: Global Rice Industry in India Revenue Million Forecast, by Country 2020 & 2033
- Table 174: Global Rice Industry in India Volume Kiloton Forecast, by Country 2020 & 2033
- Table 175: China Rice Industry in India Revenue (Million) Forecast, by Application 2020 & 2033
- Table 176: China Rice Industry in India Volume (Kiloton) Forecast, by Application 2020 & 2033
- Table 177: India Rice Industry in India Revenue (Million) Forecast, by Application 2020 & 2033
- Table 178: India Rice Industry in India Volume (Kiloton) Forecast, by Application 2020 & 2033
- Table 179: Japan Rice Industry in India Revenue (Million) Forecast, by Application 2020 & 2033
- Table 180: Japan Rice Industry in India Volume (Kiloton) Forecast, by Application 2020 & 2033
- Table 181: South Korea Rice Industry in India Revenue (Million) Forecast, by Application 2020 & 2033
- Table 182: South Korea Rice Industry in India Volume (Kiloton) Forecast, by Application 2020 & 2033
- Table 183: ASEAN Rice Industry in India Revenue (Million) Forecast, by Application 2020 & 2033
- Table 184: ASEAN Rice Industry in India Volume (Kiloton) Forecast, by Application 2020 & 2033
- Table 185: Oceania Rice Industry in India Revenue (Million) Forecast, by Application 2020 & 2033
- Table 186: Oceania Rice Industry in India Volume (Kiloton) Forecast, by Application 2020 & 2033
- Table 187: Rest of Asia Pacific Rice Industry in India Revenue (Million) Forecast, by Application 2020 & 2033
- Table 188: Rest of Asia Pacific Rice Industry in India Volume (Kiloton) Forecast, by Application 2020 & 2033
Frequently Asked Questions
1. What is the projected Compound Annual Growth Rate (CAGR) of the Rice Industry in India?
The projected CAGR is approximately 2.40%.
2. Which companies are prominent players in the Rice Industry in India?
Key companies in the market include Hayagriva Organics , Royal Basmati Rice , LT Foods (Daawat, Royal), KRBL (India Gate), Kohinoor Foods, Chaman Lal Setia Exports, Amira Nature Foods.
3. What are the main segments of the Rice Industry in India?
The market segments include Production Analysis (Volume), Consumption Analysis (Value and Volume), Import Analysis (Value and Volume), Export Analysis (Value and Volume), Price Trend Analysis, Production Analysis (Volume), Consumption Analysis (Value and Volume), Import Analysis (Value and Volume), Export Analysis (Value and Volume), Price Trend Analysis.
4. Can you provide details about the market size?
The market size is estimated to be USD 52.82 Million as of 2022.
5. What are some drivers contributing to market growth?
Increasing Demand for Indian Rice; Enhancing Production Capacities; Increasing Government Initiatives.
6. What are the notable trends driving market growth?
Increasing Demand for Indian Rice.
7. Are there any restraints impacting market growth?
Abiotic and Biotic Stresses in Rice Cultivation; High Market Entry Costs.
8. Can you provide examples of recent developments in the market?
June 2024: The Acharya N.G. Ranga Agricultural University released rice varieties suitable for Andhra Pradesh. The varieties are MTU 1271, BPT 2846, BPT 2841, and NLR 3238. The new varieties are high-yielding and resistant to various pests and diseases.
9. What pricing options are available for accessing the report?
Pricing options include single-user, multi-user, and enterprise licenses priced at USD 3800, USD 4500, and USD 5800 respectively.
10. Is the market size provided in terms of value or volume?
The market size is provided in terms of value, measured in Million and volume, measured in Kiloton.
11. Are there any specific market keywords associated with the report?
Yes, the market keyword associated with the report is "Rice Industry in India," which aids in identifying and referencing the specific market segment covered.
12. How do I determine which pricing option suits my needs best?
The pricing options vary based on user requirements and access needs. Individual users may opt for single-user licenses, while businesses requiring broader access may choose multi-user or enterprise licenses for cost-effective access to the report.
13. Are there any additional resources or data provided in the Rice Industry in India report?
While the report offers comprehensive insights, it's advisable to review the specific contents or supplementary materials provided to ascertain if additional resources or data are available.
14. How can I stay updated on further developments or reports in the Rice Industry in India?
To stay informed about further developments, trends, and reports in the Rice Industry in India, consider subscribing to industry newsletters, following relevant companies and organizations, or regularly checking reputable industry news sources and publications.
Methodology
Step 1 - Identification of Relevant Samples Size from Population Database


Step 2 - Approaches for Defining Global Market Size (Value, Volume* & Price*)

Note*: In applicable scenarios
Step 3 - Data Sources
Primary Research
- Web Analytics
- Survey Reports
- Research Institute
- Latest Research Reports
- Opinion Leaders
Secondary Research
- Annual Reports
- White Paper
- Latest Press Release
- Industry Association
- Paid Database
- Investor Presentations

Step 4 - Data Triangulation
Involves using different sources of information in order to increase the validity of a study
These sources are likely to be stakeholders in a program - participants, other researchers, program staff, other community members, and so on.
Then we put all data in single framework & apply various statistical tools to find out the dynamic on the market.
During the analysis stage, feedback from the stakeholder groups would be compared to determine areas of agreement as well as areas of divergence