

Key Insights
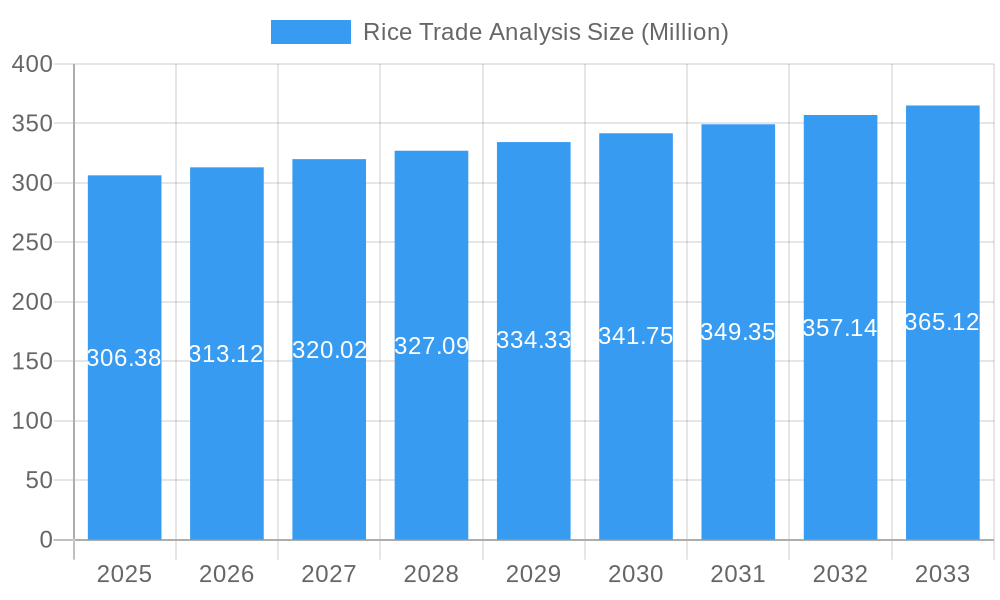
The global rice trade, valued at $306.38 billion in 2025, is projected to experience steady growth, with a compound annual growth rate (CAGR) of 2.20% from 2025 to 2033. This growth is driven by several factors, including a rising global population fueling increased demand for staple foods like rice, expanding food processing industries incorporating rice as a key ingredient, and the growing popularity of specialty rice varieties such as organic and aromatic rice, catering to health-conscious consumers. Increased disposable incomes in developing economies also contribute to higher per capita rice consumption, further boosting market expansion. However, challenges such as fluctuating rice prices due to climate change impacts on crop yields and the potential for trade disruptions act as restraints on market growth. Market segmentation reveals significant demand across various types, including hybrid rice, non-basmati rice, and specialty rice, with applications spanning food processing, household consumption, and livestock feed. Major players like Cargill, Adani Wilmar, and KRBL Ltd. dominate the market, leveraging their established supply chains and distribution networks. Regional analysis indicates strong growth potential in Asia-Pacific, driven primarily by India and China, while North and South America exhibit moderate growth trajectories. Europe and the MEA region also contribute significantly to the overall market size, showcasing a diverse and globally distributed rice trade landscape.
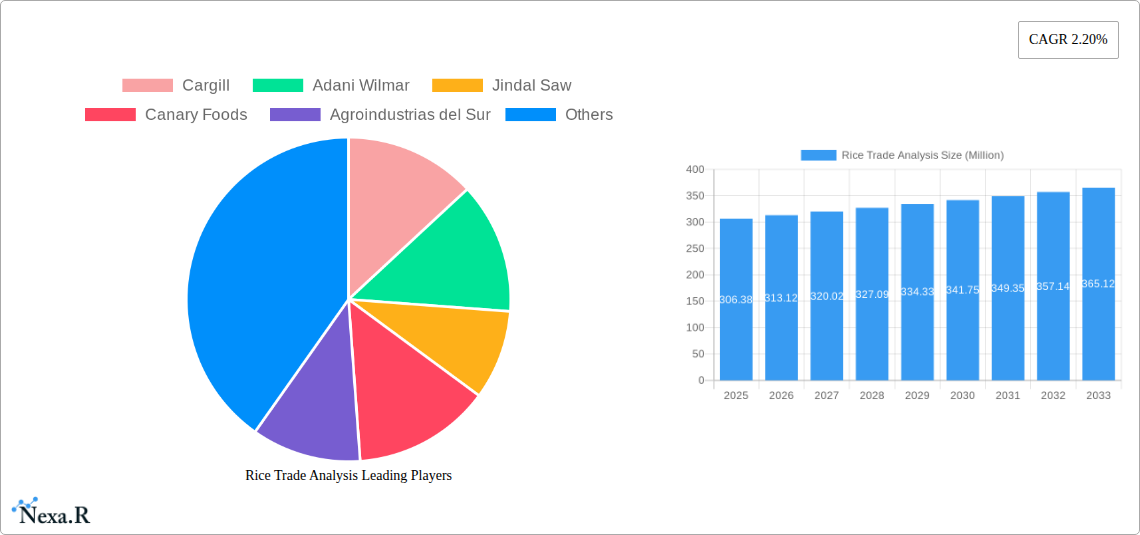
Rice Trade Analysis Market Size (In Million)
The forecast period (2025-2033) anticipates continued growth, albeit at a moderate pace. This projection considers the interplay of driving forces such as increased consumer demand and the challenges posed by climate variability and global economic conditions. The market segmentation analysis provides valuable insights into emerging trends within the rice industry, including the growing focus on sustainable and ethically sourced rice and the innovation in rice processing technologies to enhance product quality and shelf life. These trends will influence the strategies of key players and shape the future trajectory of the global rice trade. The competitive landscape is expected to remain dynamic, with existing players focusing on expansion strategies and new entrants vying for market share.
Rice Trade Analysis Company Market Share
Rice Trade Analysis: A Comprehensive Market Report (2019-2033)
This in-depth Rice Trade Analysis report provides a comprehensive overview of the global rice market, encompassing market dynamics, growth trends, regional dominance, product landscape, and future outlook. The report covers the historical period (2019-2024), base year (2025), and forecast period (2025-2033), offering invaluable insights for industry professionals, investors, and stakeholders. The report analyzes the parent market of agricultural commodities and the child market of rice, specifically focusing on key segments like Hybrid Rice, Non-Basmati Rice, and Specialty Rice (Organic, Aromatic), across applications including Food Processing, Household Consumption, and Livestock Feed.
Rice Trade Analysis Market Dynamics & Structure
This section offers a comprehensive analysis of the competitive landscape within the global rice market. We delve into market concentration, the impact of technological advancements, the intricacies of regulatory frameworks, the influence of substitute products, and the evolving demographics of end-users. Our exploration includes a quantitative assessment of mergers and acquisitions (M&A) activity, providing data on market share shifts and deal volumes. Furthermore, we critically examine qualitative factors such as barriers to innovation and regulatory complexities that shape the market. The global rice market is projected to reach approximately [Insert Estimated Market Size in Million Units] million units by 2025, reflecting robust growth potential.
- Market Concentration: The global rice market exhibits varying degrees of concentration. While certain regions are dominated by a few key players who command substantial market shares, other areas present a more fragmented competitive environment. It is estimated that the top 5 players will collectively hold approximately [Insert Top 5 Market Share Percentage]% of the global market share in 2025.
- Technological Innovation: Significant advancements are being made in areas such as the development of improved seed varieties, the adoption of precision agriculture techniques for optimized resource management, and the enhancement of efficient milling technologies. However, substantial R&D investments and the rigorous process of obtaining regulatory approvals represent key barriers to innovation within the sector.
- Regulatory Framework: Government policies governing trade, agricultural subsidies, and national food security strategies play a pivotal role in shaping market dynamics. Recent export restrictions implemented by countries like India have demonstrably influenced global supply chains and pricing, highlighting the sensitive nature of these regulations.
- Competitive Substitutes: Rice faces competition from other grains and staple foods in various culinary applications and industrial uses. Shifts in consumer preferences and economic factors can influence the demand for these substitutes, impacting overall rice consumption patterns.
- End-User Demographics: The continuous growth of the global population, coupled with evolving dietary habits and an increasing preference for rice as a staple, particularly in developing economies, are significant drivers of demand across key consuming regions.
- M&A Trends: The rice industry is witnessing a trend towards consolidation. This is largely driven by companies seeking to achieve economies of scale, expand their geographical reach, and enhance their competitive positioning. An estimated [Insert Number of M&A Deals] M&A deals were recorded in the period between 2019 and 2024, indicating active strategic maneuvering.
Rice Trade Analysis Growth Trends & Insights
This section details the evolution of the rice market size, adoption rates, technological disruptions, and shifts in consumer behavior from 2019 to 2033. Key metrics, including the Compound Annual Growth Rate (CAGR) and market penetration, are analyzed for deeper insights. The global rice market is projected to witness a CAGR of xx% during the forecast period (2025-2033), driven by factors such as increasing global population, rising disposable incomes, and changing dietary preferences. The market size is expected to reach xx million units by 2033. Specific regional variations in consumption and production will be detailed. Technological advancements, such as improved seed varieties and precision agriculture, are expected to contribute significantly to growth, alongside shifts in consumer demand towards healthier and more convenient rice products. Further analysis will explore the impact of trade policies and climate change on production and market dynamics.
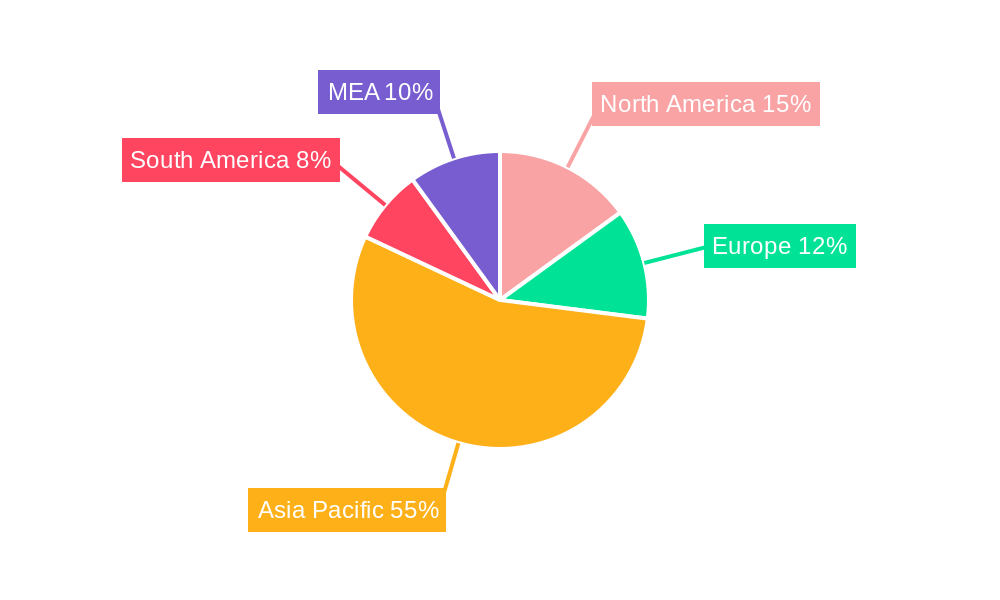
Dominant Regions, Countries, or Segments in Rice Trade Analysis
This section identifies the leading geographical regions, key countries, and specific market segments (categorized by Type and Application) that are instrumental in driving the expansion of the global rice market. We highlight crucial growth drivers, including the impact of favorable economic policies and the development of essential agricultural infrastructure, using concise bullet points for clarity. Detailed analysis is provided on the factors contributing to regional and segment dominance, such as market share and future growth potential. Asia, with nations like India and China at its forefront, is anticipated to maintain its position as the dominant force in both rice production and consumption.
- By Type: Non-Basmati rice is projected to retain the largest market share in 2025, followed by Hybrid rice and then Specialty Rice varieties, indicating a diverse product landscape.
- By Application: Household consumption remains the most significant application segment for rice. This is followed by its use in the food processing industry and as a component in livestock feed.
- Key Drivers: The sustained growth of the global population, a rise in disposable incomes particularly in emerging markets, supportive government initiatives such as subsidies for farmers, and substantial investments in agricultural infrastructure are key factors propelling market expansion.
Rice Trade Analysis Product Landscape
This section offers a detailed overview of product innovations, diverse applications, and performance metrics associated with various rice varieties. We emphasize the unique selling propositions and technological enhancements that contribute to improved yield, superior quality, and enriched nutritional value. Advances in rice breeding technologies are continuously leading to the development of varieties that are not only high-yielding but also resistant to diseases and resilient to climate change. The emergence of specialty rice, including organic and aromatic varieties, is a significant contributor to market growth. Furthermore, the increasing popularity of value-added products such as ready-to-cook rice meals and rice-based snacks in developed markets signifies a growing consumer demand for convenience and diversified rice consumption options.
Key Drivers, Barriers & Challenges in Rice Trade Analysis
This section comprehensively outlines the pivotal forces that are propelling market growth, alongside the significant challenges and restraints that are currently impacting market expansion.
Key Drivers:
- The unrelenting increase in the global population is a primary driver of escalating demand for rice.
- Rising disposable incomes in developing economies are leading to increased consumer spending on essential food staples like rice.
- Robust government support for rice production and international trade, through various policies and programs, is a significant facilitator of market growth.
- Ongoing technological advancements in both agricultural practices and food processing are contributing to improved efficiency and product quality.
Key Challenges:
- The pervasive and unpredictable nature of climate change poses a significant threat to rice yields and traditional production patterns, creating volatility.
- Geopolitical instability and resulting supply chain disruptions can lead to significant price fluctuations and availability issues in the global rice market.
- Navigating complex regulatory environments and adhering to evolving international trade restrictions can present substantial hurdles for market participants.
- Intense competition from other grains and staple foods, particularly in certain food segments, can impact market share and demand. The cumulative impact of these challenges is estimated to result in a [Insert Estimated Percentage Reduction]% reduction in market growth during periods of significant disruption.
Emerging Opportunities in Rice Trade Analysis
This section highlights emerging trends and opportunities within the rice market.
- Expansion into untapped markets in Africa and Latin America.
- Growing demand for functional and fortified rice products.
- Innovation in rice processing and packaging technologies.
- Development of sustainable and climate-resilient rice farming practices.
Growth Accelerators in the Rice Trade Analysis Industry
Technological breakthroughs in seed technology, precision agriculture, and efficient milling processes are expected to significantly accelerate growth. Strategic partnerships and joint ventures between rice producers, processors, and retailers will streamline operations and improve market access. Expansion into new markets and the development of innovative value-added products will also drive market expansion.
Key Players Shaping the Rice Trade Analysis Market
- Cargill
- Adani Wilmar
- Jindal Saw
- Canary Foods
- Agroindustrias del Sur
- Saurer
- KRBL Ltd
- Vigoro
- Thai Binh Rice
- Agroindustrial Rueda
Notable Milestones in Rice Trade Analysis Sector
- September 2022: India banned the export of broken rice and imposed a 20% export duty on non-basmati rice.
- August 2022: The Indian government planned to procure 51.8 million tons of rice for the 2022-2023 season.
- February 2022: China set minimum purchase prices for rice varieties, limiting the volume to 50 million tons.
In-Depth Rice Trade Analysis Market Outlook
The global rice market is poised for substantial growth over the next decade, driven by a combination of factors including population growth, rising incomes, and increasing demand for value-added rice products. Strategic partnerships, technological innovation, and efficient supply chains will be crucial in unlocking the market’s full potential. The focus on sustainable and climate-resilient farming practices will be critical for long-term growth and stability.
Rice Trade Analysis Segmentation
- 1. Production Analysis
- 2. Consumption Analysis
- 3. Import Market Analysis (Value & Volume)
- 4. Export Market Analysis (Value & Volume)
- 5. Price Trend Analysis
Rice Trade Analysis Segmentation By Geography
-
1. North America
- 1.1. United States
- 1.2. Canada
-
2. Europe
- 2.1. France
- 2.2. United Kingdom
- 2.3. Germany
- 2.4. Italy
- 2.5. Spain
-
3. Asia Pacific
- 3.1. China
- 3.2. India
- 3.3. Thailand
- 3.4. Vietnam
- 3.5. Pakistan
-
4. South America
- 4.1. Brazil
- 4.2. Argentina
-
5. Africa
- 5.1. South Africa
Rice Trade Analysis Regional Market Share
Geographic Coverage of Rice Trade Analysis
Rice Trade Analysis REPORT HIGHLIGHTS
| Aspects | Details |
|---|---|
| Study Period | 2020-2034 |
| Base Year | 2025 |
| Estimated Year | 2026 |
| Forecast Period | 2026-2034 |
| Historical Period | 2020-2025 |
| Growth Rate | CAGR of 2.20% from 2020-2034 |
| Segmentation |
|
Table of Contents
- 1. Introduction
- 1.1. Research Scope
- 1.2. Market Segmentation
- 1.3. Research Methodology
- 1.4. Definitions and Assumptions
- 2. Executive Summary
- 2.1. Introduction
- 3. Market Dynamics
- 3.1. Introduction
- 3.2. Market Drivers
- 3.3. Market Restrains
- 3.4. Market Trends
- 3.4.1. Favorable Trade Policies
- 4. Market Factor Analysis
- 4.1. Porters Five Forces
- 4.2. Supply/Value Chain
- 4.3. PESTEL analysis
- 4.4. Market Entropy
- 4.5. Patent/Trademark Analysis
- 5. Global Rice Trade Analysis Analysis, Insights and Forecast, 2020-2032
- 5.1. Market Analysis, Insights and Forecast - by Production Analysis
- 5.2. Market Analysis, Insights and Forecast - by Consumption Analysis
- 5.3. Market Analysis, Insights and Forecast - by Import Market Analysis (Value & Volume)
- 5.4. Market Analysis, Insights and Forecast - by Export Market Analysis (Value & Volume)
- 5.5. Market Analysis, Insights and Forecast - by Price Trend Analysis
- 5.6. Market Analysis, Insights and Forecast - by Region
- 5.6.1. North America
- 5.6.2. Europe
- 5.6.3. Asia Pacific
- 5.6.4. South America
- 5.6.5. Africa
- 5.1. Market Analysis, Insights and Forecast - by Production Analysis
- 6. North America Rice Trade Analysis Analysis, Insights and Forecast, 2020-2032
- 6.1. Market Analysis, Insights and Forecast - by Production Analysis
- 6.2. Market Analysis, Insights and Forecast - by Consumption Analysis
- 6.3. Market Analysis, Insights and Forecast - by Import Market Analysis (Value & Volume)
- 6.4. Market Analysis, Insights and Forecast - by Export Market Analysis (Value & Volume)
- 6.5. Market Analysis, Insights and Forecast - by Price Trend Analysis
- 6.1. Market Analysis, Insights and Forecast - by Production Analysis
- 7. Europe Rice Trade Analysis Analysis, Insights and Forecast, 2020-2032
- 7.1. Market Analysis, Insights and Forecast - by Production Analysis
- 7.2. Market Analysis, Insights and Forecast - by Consumption Analysis
- 7.3. Market Analysis, Insights and Forecast - by Import Market Analysis (Value & Volume)
- 7.4. Market Analysis, Insights and Forecast - by Export Market Analysis (Value & Volume)
- 7.5. Market Analysis, Insights and Forecast - by Price Trend Analysis
- 7.1. Market Analysis, Insights and Forecast - by Production Analysis
- 8. Asia Pacific Rice Trade Analysis Analysis, Insights and Forecast, 2020-2032
- 8.1. Market Analysis, Insights and Forecast - by Production Analysis
- 8.2. Market Analysis, Insights and Forecast - by Consumption Analysis
- 8.3. Market Analysis, Insights and Forecast - by Import Market Analysis (Value & Volume)
- 8.4. Market Analysis, Insights and Forecast - by Export Market Analysis (Value & Volume)
- 8.5. Market Analysis, Insights and Forecast - by Price Trend Analysis
- 8.1. Market Analysis, Insights and Forecast - by Production Analysis
- 9. South America Rice Trade Analysis Analysis, Insights and Forecast, 2020-2032
- 9.1. Market Analysis, Insights and Forecast - by Production Analysis
- 9.2. Market Analysis, Insights and Forecast - by Consumption Analysis
- 9.3. Market Analysis, Insights and Forecast - by Import Market Analysis (Value & Volume)
- 9.4. Market Analysis, Insights and Forecast - by Export Market Analysis (Value & Volume)
- 9.5. Market Analysis, Insights and Forecast - by Price Trend Analysis
- 9.1. Market Analysis, Insights and Forecast - by Production Analysis
- 10. Africa Rice Trade Analysis Analysis, Insights and Forecast, 2020-2032
- 10.1. Market Analysis, Insights and Forecast - by Production Analysis
- 10.2. Market Analysis, Insights and Forecast - by Consumption Analysis
- 10.3. Market Analysis, Insights and Forecast - by Import Market Analysis (Value & Volume)
- 10.4. Market Analysis, Insights and Forecast - by Export Market Analysis (Value & Volume)
- 10.5. Market Analysis, Insights and Forecast - by Price Trend Analysis
- 10.1. Market Analysis, Insights and Forecast - by Production Analysis
- 11. Competitive Analysis
- 11.1. Global Market Share Analysis 2025
- 11.2. Company Profiles
- 11.2.1 Cargill
- 11.2.1.1. Overview
- 11.2.1.2. Products
- 11.2.1.3. SWOT Analysis
- 11.2.1.4. Recent Developments
- 11.2.1.5. Financials (Based on Availability)
- 11.2.2 Adani Wilmar
- 11.2.2.1. Overview
- 11.2.2.2. Products
- 11.2.2.3. SWOT Analysis
- 11.2.2.4. Recent Developments
- 11.2.2.5. Financials (Based on Availability)
- 11.2.3 Jindal Saw
- 11.2.3.1. Overview
- 11.2.3.2. Products
- 11.2.3.3. SWOT Analysis
- 11.2.3.4. Recent Developments
- 11.2.3.5. Financials (Based on Availability)
- 11.2.4 Canary Foods
- 11.2.4.1. Overview
- 11.2.4.2. Products
- 11.2.4.3. SWOT Analysis
- 11.2.4.4. Recent Developments
- 11.2.4.5. Financials (Based on Availability)
- 11.2.5 Agroindustrias del Sur
- 11.2.5.1. Overview
- 11.2.5.2. Products
- 11.2.5.3. SWOT Analysis
- 11.2.5.4. Recent Developments
- 11.2.5.5. Financials (Based on Availability)
- 11.2.6 Saurer
- 11.2.6.1. Overview
- 11.2.6.2. Products
- 11.2.6.3. SWOT Analysis
- 11.2.6.4. Recent Developments
- 11.2.6.5. Financials (Based on Availability)
- 11.2.7 KRBL Ltd
- 11.2.7.1. Overview
- 11.2.7.2. Products
- 11.2.7.3. SWOT Analysis
- 11.2.7.4. Recent Developments
- 11.2.7.5. Financials (Based on Availability)
- 11.2.8 Vigoro
- 11.2.8.1. Overview
- 11.2.8.2. Products
- 11.2.8.3. SWOT Analysis
- 11.2.8.4. Recent Developments
- 11.2.8.5. Financials (Based on Availability)
- 11.2.9 Thai Binh Rice
- 11.2.9.1. Overview
- 11.2.9.2. Products
- 11.2.9.3. SWOT Analysis
- 11.2.9.4. Recent Developments
- 11.2.9.5. Financials (Based on Availability)
- 11.2.10 Agroindustrial Rueda
- 11.2.10.1. Overview
- 11.2.10.2. Products
- 11.2.10.3. SWOT Analysis
- 11.2.10.4. Recent Developments
- 11.2.10.5. Financials (Based on Availability)
- 11.2.1 Cargill
List of Figures
- Figure 1: Global Rice Trade Analysis Revenue Breakdown (Million, %) by Region 2025 & 2033
- Figure 2: Global Rice Trade Analysis Volume Breakdown (Kiloton, %) by Region 2025 & 2033
- Figure 3: North America Rice Trade Analysis Revenue (Million), by Production Analysis 2025 & 2033
- Figure 4: North America Rice Trade Analysis Volume (Kiloton), by Production Analysis 2025 & 2033
- Figure 5: North America Rice Trade Analysis Revenue Share (%), by Production Analysis 2025 & 2033
- Figure 6: North America Rice Trade Analysis Volume Share (%), by Production Analysis 2025 & 2033
- Figure 7: North America Rice Trade Analysis Revenue (Million), by Consumption Analysis 2025 & 2033
- Figure 8: North America Rice Trade Analysis Volume (Kiloton), by Consumption Analysis 2025 & 2033
- Figure 9: North America Rice Trade Analysis Revenue Share (%), by Consumption Analysis 2025 & 2033
- Figure 10: North America Rice Trade Analysis Volume Share (%), by Consumption Analysis 2025 & 2033
- Figure 11: North America Rice Trade Analysis Revenue (Million), by Import Market Analysis (Value & Volume) 2025 & 2033
- Figure 12: North America Rice Trade Analysis Volume (Kiloton), by Import Market Analysis (Value & Volume) 2025 & 2033
- Figure 13: North America Rice Trade Analysis Revenue Share (%), by Import Market Analysis (Value & Volume) 2025 & 2033
- Figure 14: North America Rice Trade Analysis Volume Share (%), by Import Market Analysis (Value & Volume) 2025 & 2033
- Figure 15: North America Rice Trade Analysis Revenue (Million), by Export Market Analysis (Value & Volume) 2025 & 2033
- Figure 16: North America Rice Trade Analysis Volume (Kiloton), by Export Market Analysis (Value & Volume) 2025 & 2033
- Figure 17: North America Rice Trade Analysis Revenue Share (%), by Export Market Analysis (Value & Volume) 2025 & 2033
- Figure 18: North America Rice Trade Analysis Volume Share (%), by Export Market Analysis (Value & Volume) 2025 & 2033
- Figure 19: North America Rice Trade Analysis Revenue (Million), by Price Trend Analysis 2025 & 2033
- Figure 20: North America Rice Trade Analysis Volume (Kiloton), by Price Trend Analysis 2025 & 2033
- Figure 21: North America Rice Trade Analysis Revenue Share (%), by Price Trend Analysis 2025 & 2033
- Figure 22: North America Rice Trade Analysis Volume Share (%), by Price Trend Analysis 2025 & 2033
- Figure 23: North America Rice Trade Analysis Revenue (Million), by Country 2025 & 2033
- Figure 24: North America Rice Trade Analysis Volume (Kiloton), by Country 2025 & 2033
- Figure 25: North America Rice Trade Analysis Revenue Share (%), by Country 2025 & 2033
- Figure 26: North America Rice Trade Analysis Volume Share (%), by Country 2025 & 2033
- Figure 27: Europe Rice Trade Analysis Revenue (Million), by Production Analysis 2025 & 2033
- Figure 28: Europe Rice Trade Analysis Volume (Kiloton), by Production Analysis 2025 & 2033
- Figure 29: Europe Rice Trade Analysis Revenue Share (%), by Production Analysis 2025 & 2033
- Figure 30: Europe Rice Trade Analysis Volume Share (%), by Production Analysis 2025 & 2033
- Figure 31: Europe Rice Trade Analysis Revenue (Million), by Consumption Analysis 2025 & 2033
- Figure 32: Europe Rice Trade Analysis Volume (Kiloton), by Consumption Analysis 2025 & 2033
- Figure 33: Europe Rice Trade Analysis Revenue Share (%), by Consumption Analysis 2025 & 2033
- Figure 34: Europe Rice Trade Analysis Volume Share (%), by Consumption Analysis 2025 & 2033
- Figure 35: Europe Rice Trade Analysis Revenue (Million), by Import Market Analysis (Value & Volume) 2025 & 2033
- Figure 36: Europe Rice Trade Analysis Volume (Kiloton), by Import Market Analysis (Value & Volume) 2025 & 2033
- Figure 37: Europe Rice Trade Analysis Revenue Share (%), by Import Market Analysis (Value & Volume) 2025 & 2033
- Figure 38: Europe Rice Trade Analysis Volume Share (%), by Import Market Analysis (Value & Volume) 2025 & 2033
- Figure 39: Europe Rice Trade Analysis Revenue (Million), by Export Market Analysis (Value & Volume) 2025 & 2033
- Figure 40: Europe Rice Trade Analysis Volume (Kiloton), by Export Market Analysis (Value & Volume) 2025 & 2033
- Figure 41: Europe Rice Trade Analysis Revenue Share (%), by Export Market Analysis (Value & Volume) 2025 & 2033
- Figure 42: Europe Rice Trade Analysis Volume Share (%), by Export Market Analysis (Value & Volume) 2025 & 2033
- Figure 43: Europe Rice Trade Analysis Revenue (Million), by Price Trend Analysis 2025 & 2033
- Figure 44: Europe Rice Trade Analysis Volume (Kiloton), by Price Trend Analysis 2025 & 2033
- Figure 45: Europe Rice Trade Analysis Revenue Share (%), by Price Trend Analysis 2025 & 2033
- Figure 46: Europe Rice Trade Analysis Volume Share (%), by Price Trend Analysis 2025 & 2033
- Figure 47: Europe Rice Trade Analysis Revenue (Million), by Country 2025 & 2033
- Figure 48: Europe Rice Trade Analysis Volume (Kiloton), by Country 2025 & 2033
- Figure 49: Europe Rice Trade Analysis Revenue Share (%), by Country 2025 & 2033
- Figure 50: Europe Rice Trade Analysis Volume Share (%), by Country 2025 & 2033
- Figure 51: Asia Pacific Rice Trade Analysis Revenue (Million), by Production Analysis 2025 & 2033
- Figure 52: Asia Pacific Rice Trade Analysis Volume (Kiloton), by Production Analysis 2025 & 2033
- Figure 53: Asia Pacific Rice Trade Analysis Revenue Share (%), by Production Analysis 2025 & 2033
- Figure 54: Asia Pacific Rice Trade Analysis Volume Share (%), by Production Analysis 2025 & 2033
- Figure 55: Asia Pacific Rice Trade Analysis Revenue (Million), by Consumption Analysis 2025 & 2033
- Figure 56: Asia Pacific Rice Trade Analysis Volume (Kiloton), by Consumption Analysis 2025 & 2033
- Figure 57: Asia Pacific Rice Trade Analysis Revenue Share (%), by Consumption Analysis 2025 & 2033
- Figure 58: Asia Pacific Rice Trade Analysis Volume Share (%), by Consumption Analysis 2025 & 2033
- Figure 59: Asia Pacific Rice Trade Analysis Revenue (Million), by Import Market Analysis (Value & Volume) 2025 & 2033
- Figure 60: Asia Pacific Rice Trade Analysis Volume (Kiloton), by Import Market Analysis (Value & Volume) 2025 & 2033
- Figure 61: Asia Pacific Rice Trade Analysis Revenue Share (%), by Import Market Analysis (Value & Volume) 2025 & 2033
- Figure 62: Asia Pacific Rice Trade Analysis Volume Share (%), by Import Market Analysis (Value & Volume) 2025 & 2033
- Figure 63: Asia Pacific Rice Trade Analysis Revenue (Million), by Export Market Analysis (Value & Volume) 2025 & 2033
- Figure 64: Asia Pacific Rice Trade Analysis Volume (Kiloton), by Export Market Analysis (Value & Volume) 2025 & 2033
- Figure 65: Asia Pacific Rice Trade Analysis Revenue Share (%), by Export Market Analysis (Value & Volume) 2025 & 2033
- Figure 66: Asia Pacific Rice Trade Analysis Volume Share (%), by Export Market Analysis (Value & Volume) 2025 & 2033
- Figure 67: Asia Pacific Rice Trade Analysis Revenue (Million), by Price Trend Analysis 2025 & 2033
- Figure 68: Asia Pacific Rice Trade Analysis Volume (Kiloton), by Price Trend Analysis 2025 & 2033
- Figure 69: Asia Pacific Rice Trade Analysis Revenue Share (%), by Price Trend Analysis 2025 & 2033
- Figure 70: Asia Pacific Rice Trade Analysis Volume Share (%), by Price Trend Analysis 2025 & 2033
- Figure 71: Asia Pacific Rice Trade Analysis Revenue (Million), by Country 2025 & 2033
- Figure 72: Asia Pacific Rice Trade Analysis Volume (Kiloton), by Country 2025 & 2033
- Figure 73: Asia Pacific Rice Trade Analysis Revenue Share (%), by Country 2025 & 2033
- Figure 74: Asia Pacific Rice Trade Analysis Volume Share (%), by Country 2025 & 2033
- Figure 75: South America Rice Trade Analysis Revenue (Million), by Production Analysis 2025 & 2033
- Figure 76: South America Rice Trade Analysis Volume (Kiloton), by Production Analysis 2025 & 2033
- Figure 77: South America Rice Trade Analysis Revenue Share (%), by Production Analysis 2025 & 2033
- Figure 78: South America Rice Trade Analysis Volume Share (%), by Production Analysis 2025 & 2033
- Figure 79: South America Rice Trade Analysis Revenue (Million), by Consumption Analysis 2025 & 2033
- Figure 80: South America Rice Trade Analysis Volume (Kiloton), by Consumption Analysis 2025 & 2033
- Figure 81: South America Rice Trade Analysis Revenue Share (%), by Consumption Analysis 2025 & 2033
- Figure 82: South America Rice Trade Analysis Volume Share (%), by Consumption Analysis 2025 & 2033
- Figure 83: South America Rice Trade Analysis Revenue (Million), by Import Market Analysis (Value & Volume) 2025 & 2033
- Figure 84: South America Rice Trade Analysis Volume (Kiloton), by Import Market Analysis (Value & Volume) 2025 & 2033
- Figure 85: South America Rice Trade Analysis Revenue Share (%), by Import Market Analysis (Value & Volume) 2025 & 2033
- Figure 86: South America Rice Trade Analysis Volume Share (%), by Import Market Analysis (Value & Volume) 2025 & 2033
- Figure 87: South America Rice Trade Analysis Revenue (Million), by Export Market Analysis (Value & Volume) 2025 & 2033
- Figure 88: South America Rice Trade Analysis Volume (Kiloton), by Export Market Analysis (Value & Volume) 2025 & 2033
- Figure 89: South America Rice Trade Analysis Revenue Share (%), by Export Market Analysis (Value & Volume) 2025 & 2033
- Figure 90: South America Rice Trade Analysis Volume Share (%), by Export Market Analysis (Value & Volume) 2025 & 2033
- Figure 91: South America Rice Trade Analysis Revenue (Million), by Price Trend Analysis 2025 & 2033
- Figure 92: South America Rice Trade Analysis Volume (Kiloton), by Price Trend Analysis 2025 & 2033
- Figure 93: South America Rice Trade Analysis Revenue Share (%), by Price Trend Analysis 2025 & 2033
- Figure 94: South America Rice Trade Analysis Volume Share (%), by Price Trend Analysis 2025 & 2033
- Figure 95: South America Rice Trade Analysis Revenue (Million), by Country 2025 & 2033
- Figure 96: South America Rice Trade Analysis Volume (Kiloton), by Country 2025 & 2033
- Figure 97: South America Rice Trade Analysis Revenue Share (%), by Country 2025 & 2033
- Figure 98: South America Rice Trade Analysis Volume Share (%), by Country 2025 & 2033
- Figure 99: Africa Rice Trade Analysis Revenue (Million), by Production Analysis 2025 & 2033
- Figure 100: Africa Rice Trade Analysis Volume (Kiloton), by Production Analysis 2025 & 2033
- Figure 101: Africa Rice Trade Analysis Revenue Share (%), by Production Analysis 2025 & 2033
- Figure 102: Africa Rice Trade Analysis Volume Share (%), by Production Analysis 2025 & 2033
- Figure 103: Africa Rice Trade Analysis Revenue (Million), by Consumption Analysis 2025 & 2033
- Figure 104: Africa Rice Trade Analysis Volume (Kiloton), by Consumption Analysis 2025 & 2033
- Figure 105: Africa Rice Trade Analysis Revenue Share (%), by Consumption Analysis 2025 & 2033
- Figure 106: Africa Rice Trade Analysis Volume Share (%), by Consumption Analysis 2025 & 2033
- Figure 107: Africa Rice Trade Analysis Revenue (Million), by Import Market Analysis (Value & Volume) 2025 & 2033
- Figure 108: Africa Rice Trade Analysis Volume (Kiloton), by Import Market Analysis (Value & Volume) 2025 & 2033
- Figure 109: Africa Rice Trade Analysis Revenue Share (%), by Import Market Analysis (Value & Volume) 2025 & 2033
- Figure 110: Africa Rice Trade Analysis Volume Share (%), by Import Market Analysis (Value & Volume) 2025 & 2033
- Figure 111: Africa Rice Trade Analysis Revenue (Million), by Export Market Analysis (Value & Volume) 2025 & 2033
- Figure 112: Africa Rice Trade Analysis Volume (Kiloton), by Export Market Analysis (Value & Volume) 2025 & 2033
- Figure 113: Africa Rice Trade Analysis Revenue Share (%), by Export Market Analysis (Value & Volume) 2025 & 2033
- Figure 114: Africa Rice Trade Analysis Volume Share (%), by Export Market Analysis (Value & Volume) 2025 & 2033
- Figure 115: Africa Rice Trade Analysis Revenue (Million), by Price Trend Analysis 2025 & 2033
- Figure 116: Africa Rice Trade Analysis Volume (Kiloton), by Price Trend Analysis 2025 & 2033
- Figure 117: Africa Rice Trade Analysis Revenue Share (%), by Price Trend Analysis 2025 & 2033
- Figure 118: Africa Rice Trade Analysis Volume Share (%), by Price Trend Analysis 2025 & 2033
- Figure 119: Africa Rice Trade Analysis Revenue (Million), by Country 2025 & 2033
- Figure 120: Africa Rice Trade Analysis Volume (Kiloton), by Country 2025 & 2033
- Figure 121: Africa Rice Trade Analysis Revenue Share (%), by Country 2025 & 2033
- Figure 122: Africa Rice Trade Analysis Volume Share (%), by Country 2025 & 2033
List of Tables
- Table 1: Global Rice Trade Analysis Revenue Million Forecast, by Production Analysis 2020 & 2033
- Table 2: Global Rice Trade Analysis Volume Kiloton Forecast, by Production Analysis 2020 & 2033
- Table 3: Global Rice Trade Analysis Revenue Million Forecast, by Consumption Analysis 2020 & 2033
- Table 4: Global Rice Trade Analysis Volume Kiloton Forecast, by Consumption Analysis 2020 & 2033
- Table 5: Global Rice Trade Analysis Revenue Million Forecast, by Import Market Analysis (Value & Volume) 2020 & 2033
- Table 6: Global Rice Trade Analysis Volume Kiloton Forecast, by Import Market Analysis (Value & Volume) 2020 & 2033
- Table 7: Global Rice Trade Analysis Revenue Million Forecast, by Export Market Analysis (Value & Volume) 2020 & 2033
- Table 8: Global Rice Trade Analysis Volume Kiloton Forecast, by Export Market Analysis (Value & Volume) 2020 & 2033
- Table 9: Global Rice Trade Analysis Revenue Million Forecast, by Price Trend Analysis 2020 & 2033
- Table 10: Global Rice Trade Analysis Volume Kiloton Forecast, by Price Trend Analysis 2020 & 2033
- Table 11: Global Rice Trade Analysis Revenue Million Forecast, by Region 2020 & 2033
- Table 12: Global Rice Trade Analysis Volume Kiloton Forecast, by Region 2020 & 2033
- Table 13: Global Rice Trade Analysis Revenue Million Forecast, by Production Analysis 2020 & 2033
- Table 14: Global Rice Trade Analysis Volume Kiloton Forecast, by Production Analysis 2020 & 2033
- Table 15: Global Rice Trade Analysis Revenue Million Forecast, by Consumption Analysis 2020 & 2033
- Table 16: Global Rice Trade Analysis Volume Kiloton Forecast, by Consumption Analysis 2020 & 2033
- Table 17: Global Rice Trade Analysis Revenue Million Forecast, by Import Market Analysis (Value & Volume) 2020 & 2033
- Table 18: Global Rice Trade Analysis Volume Kiloton Forecast, by Import Market Analysis (Value & Volume) 2020 & 2033
- Table 19: Global Rice Trade Analysis Revenue Million Forecast, by Export Market Analysis (Value & Volume) 2020 & 2033
- Table 20: Global Rice Trade Analysis Volume Kiloton Forecast, by Export Market Analysis (Value & Volume) 2020 & 2033
- Table 21: Global Rice Trade Analysis Revenue Million Forecast, by Price Trend Analysis 2020 & 2033
- Table 22: Global Rice Trade Analysis Volume Kiloton Forecast, by Price Trend Analysis 2020 & 2033
- Table 23: Global Rice Trade Analysis Revenue Million Forecast, by Country 2020 & 2033
- Table 24: Global Rice Trade Analysis Volume Kiloton Forecast, by Country 2020 & 2033
- Table 25: United States Rice Trade Analysis Revenue (Million) Forecast, by Application 2020 & 2033
- Table 26: United States Rice Trade Analysis Volume (Kiloton) Forecast, by Application 2020 & 2033
- Table 27: Canada Rice Trade Analysis Revenue (Million) Forecast, by Application 2020 & 2033
- Table 28: Canada Rice Trade Analysis Volume (Kiloton) Forecast, by Application 2020 & 2033
- Table 29: Global Rice Trade Analysis Revenue Million Forecast, by Production Analysis 2020 & 2033
- Table 30: Global Rice Trade Analysis Volume Kiloton Forecast, by Production Analysis 2020 & 2033
- Table 31: Global Rice Trade Analysis Revenue Million Forecast, by Consumption Analysis 2020 & 2033
- Table 32: Global Rice Trade Analysis Volume Kiloton Forecast, by Consumption Analysis 2020 & 2033
- Table 33: Global Rice Trade Analysis Revenue Million Forecast, by Import Market Analysis (Value & Volume) 2020 & 2033
- Table 34: Global Rice Trade Analysis Volume Kiloton Forecast, by Import Market Analysis (Value & Volume) 2020 & 2033
- Table 35: Global Rice Trade Analysis Revenue Million Forecast, by Export Market Analysis (Value & Volume) 2020 & 2033
- Table 36: Global Rice Trade Analysis Volume Kiloton Forecast, by Export Market Analysis (Value & Volume) 2020 & 2033
- Table 37: Global Rice Trade Analysis Revenue Million Forecast, by Price Trend Analysis 2020 & 2033
- Table 38: Global Rice Trade Analysis Volume Kiloton Forecast, by Price Trend Analysis 2020 & 2033
- Table 39: Global Rice Trade Analysis Revenue Million Forecast, by Country 2020 & 2033
- Table 40: Global Rice Trade Analysis Volume Kiloton Forecast, by Country 2020 & 2033
- Table 41: France Rice Trade Analysis Revenue (Million) Forecast, by Application 2020 & 2033
- Table 42: France Rice Trade Analysis Volume (Kiloton) Forecast, by Application 2020 & 2033
- Table 43: United Kingdom Rice Trade Analysis Revenue (Million) Forecast, by Application 2020 & 2033
- Table 44: United Kingdom Rice Trade Analysis Volume (Kiloton) Forecast, by Application 2020 & 2033
- Table 45: Germany Rice Trade Analysis Revenue (Million) Forecast, by Application 2020 & 2033
- Table 46: Germany Rice Trade Analysis Volume (Kiloton) Forecast, by Application 2020 & 2033
- Table 47: Italy Rice Trade Analysis Revenue (Million) Forecast, by Application 2020 & 2033
- Table 48: Italy Rice Trade Analysis Volume (Kiloton) Forecast, by Application 2020 & 2033
- Table 49: Spain Rice Trade Analysis Revenue (Million) Forecast, by Application 2020 & 2033
- Table 50: Spain Rice Trade Analysis Volume (Kiloton) Forecast, by Application 2020 & 2033
- Table 51: Global Rice Trade Analysis Revenue Million Forecast, by Production Analysis 2020 & 2033
- Table 52: Global Rice Trade Analysis Volume Kiloton Forecast, by Production Analysis 2020 & 2033
- Table 53: Global Rice Trade Analysis Revenue Million Forecast, by Consumption Analysis 2020 & 2033
- Table 54: Global Rice Trade Analysis Volume Kiloton Forecast, by Consumption Analysis 2020 & 2033
- Table 55: Global Rice Trade Analysis Revenue Million Forecast, by Import Market Analysis (Value & Volume) 2020 & 2033
- Table 56: Global Rice Trade Analysis Volume Kiloton Forecast, by Import Market Analysis (Value & Volume) 2020 & 2033
- Table 57: Global Rice Trade Analysis Revenue Million Forecast, by Export Market Analysis (Value & Volume) 2020 & 2033
- Table 58: Global Rice Trade Analysis Volume Kiloton Forecast, by Export Market Analysis (Value & Volume) 2020 & 2033
- Table 59: Global Rice Trade Analysis Revenue Million Forecast, by Price Trend Analysis 2020 & 2033
- Table 60: Global Rice Trade Analysis Volume Kiloton Forecast, by Price Trend Analysis 2020 & 2033
- Table 61: Global Rice Trade Analysis Revenue Million Forecast, by Country 2020 & 2033
- Table 62: Global Rice Trade Analysis Volume Kiloton Forecast, by Country 2020 & 2033
- Table 63: China Rice Trade Analysis Revenue (Million) Forecast, by Application 2020 & 2033
- Table 64: China Rice Trade Analysis Volume (Kiloton) Forecast, by Application 2020 & 2033
- Table 65: India Rice Trade Analysis Revenue (Million) Forecast, by Application 2020 & 2033
- Table 66: India Rice Trade Analysis Volume (Kiloton) Forecast, by Application 2020 & 2033
- Table 67: Thailand Rice Trade Analysis Revenue (Million) Forecast, by Application 2020 & 2033
- Table 68: Thailand Rice Trade Analysis Volume (Kiloton) Forecast, by Application 2020 & 2033
- Table 69: Vietnam Rice Trade Analysis Revenue (Million) Forecast, by Application 2020 & 2033
- Table 70: Vietnam Rice Trade Analysis Volume (Kiloton) Forecast, by Application 2020 & 2033
- Table 71: Pakistan Rice Trade Analysis Revenue (Million) Forecast, by Application 2020 & 2033
- Table 72: Pakistan Rice Trade Analysis Volume (Kiloton) Forecast, by Application 2020 & 2033
- Table 73: Global Rice Trade Analysis Revenue Million Forecast, by Production Analysis 2020 & 2033
- Table 74: Global Rice Trade Analysis Volume Kiloton Forecast, by Production Analysis 2020 & 2033
- Table 75: Global Rice Trade Analysis Revenue Million Forecast, by Consumption Analysis 2020 & 2033
- Table 76: Global Rice Trade Analysis Volume Kiloton Forecast, by Consumption Analysis 2020 & 2033
- Table 77: Global Rice Trade Analysis Revenue Million Forecast, by Import Market Analysis (Value & Volume) 2020 & 2033
- Table 78: Global Rice Trade Analysis Volume Kiloton Forecast, by Import Market Analysis (Value & Volume) 2020 & 2033
- Table 79: Global Rice Trade Analysis Revenue Million Forecast, by Export Market Analysis (Value & Volume) 2020 & 2033
- Table 80: Global Rice Trade Analysis Volume Kiloton Forecast, by Export Market Analysis (Value & Volume) 2020 & 2033
- Table 81: Global Rice Trade Analysis Revenue Million Forecast, by Price Trend Analysis 2020 & 2033
- Table 82: Global Rice Trade Analysis Volume Kiloton Forecast, by Price Trend Analysis 2020 & 2033
- Table 83: Global Rice Trade Analysis Revenue Million Forecast, by Country 2020 & 2033
- Table 84: Global Rice Trade Analysis Volume Kiloton Forecast, by Country 2020 & 2033
- Table 85: Brazil Rice Trade Analysis Revenue (Million) Forecast, by Application 2020 & 2033
- Table 86: Brazil Rice Trade Analysis Volume (Kiloton) Forecast, by Application 2020 & 2033
- Table 87: Argentina Rice Trade Analysis Revenue (Million) Forecast, by Application 2020 & 2033
- Table 88: Argentina Rice Trade Analysis Volume (Kiloton) Forecast, by Application 2020 & 2033
- Table 89: Global Rice Trade Analysis Revenue Million Forecast, by Production Analysis 2020 & 2033
- Table 90: Global Rice Trade Analysis Volume Kiloton Forecast, by Production Analysis 2020 & 2033
- Table 91: Global Rice Trade Analysis Revenue Million Forecast, by Consumption Analysis 2020 & 2033
- Table 92: Global Rice Trade Analysis Volume Kiloton Forecast, by Consumption Analysis 2020 & 2033
- Table 93: Global Rice Trade Analysis Revenue Million Forecast, by Import Market Analysis (Value & Volume) 2020 & 2033
- Table 94: Global Rice Trade Analysis Volume Kiloton Forecast, by Import Market Analysis (Value & Volume) 2020 & 2033
- Table 95: Global Rice Trade Analysis Revenue Million Forecast, by Export Market Analysis (Value & Volume) 2020 & 2033
- Table 96: Global Rice Trade Analysis Volume Kiloton Forecast, by Export Market Analysis (Value & Volume) 2020 & 2033
- Table 97: Global Rice Trade Analysis Revenue Million Forecast, by Price Trend Analysis 2020 & 2033
- Table 98: Global Rice Trade Analysis Volume Kiloton Forecast, by Price Trend Analysis 2020 & 2033
- Table 99: Global Rice Trade Analysis Revenue Million Forecast, by Country 2020 & 2033
- Table 100: Global Rice Trade Analysis Volume Kiloton Forecast, by Country 2020 & 2033
- Table 101: South Africa Rice Trade Analysis Revenue (Million) Forecast, by Application 2020 & 2033
- Table 102: South Africa Rice Trade Analysis Volume (Kiloton) Forecast, by Application 2020 & 2033
Frequently Asked Questions
1. What is the projected Compound Annual Growth Rate (CAGR) of the Rice Trade Analysis?
The projected CAGR is approximately 2.20%.
2. Which companies are prominent players in the Rice Trade Analysis?
Key companies in the market include Cargill , Adani Wilmar , Jindal Saw , Canary Foods , Agroindustrias del Sur, Saurer , KRBL Ltd , Vigoro , Thai Binh Rice , Agroindustrial Rueda .
3. What are the main segments of the Rice Trade Analysis?
The market segments include Production Analysis, Consumption Analysis, Import Market Analysis (Value & Volume), Export Market Analysis (Value & Volume), Price Trend Analysis.
4. Can you provide details about the market size?
The market size is estimated to be USD 306.38 Million as of 2022.
5. What are some drivers contributing to market growth?
N/A
6. What are the notable trends driving market growth?
Favorable Trade Policies.
7. Are there any restraints impacting market growth?
N/A
8. Can you provide examples of recent developments in the market?
September 2022: India banned the export of broken rice, and a 20% export duty was imposed on non-basmati rice. This is the first ban by India after the 2011 ban on non-basmati rice for three years.
9. What pricing options are available for accessing the report?
Pricing options include single-user, multi-user, and enterprise licenses priced at USD 4750, USD 5250, and USD 8750 respectively.
10. Is the market size provided in terms of value or volume?
The market size is provided in terms of value, measured in Million and volume, measured in Kiloton.
11. Are there any specific market keywords associated with the report?
Yes, the market keyword associated with the report is "Rice Trade Analysis," which aids in identifying and referencing the specific market segment covered.
12. How do I determine which pricing option suits my needs best?
The pricing options vary based on user requirements and access needs. Individual users may opt for single-user licenses, while businesses requiring broader access may choose multi-user or enterprise licenses for cost-effective access to the report.
13. Are there any additional resources or data provided in the Rice Trade Analysis report?
While the report offers comprehensive insights, it's advisable to review the specific contents or supplementary materials provided to ascertain if additional resources or data are available.
14. How can I stay updated on further developments or reports in the Rice Trade Analysis?
To stay informed about further developments, trends, and reports in the Rice Trade Analysis, consider subscribing to industry newsletters, following relevant companies and organizations, or regularly checking reputable industry news sources and publications.
Methodology
Step 1 - Identification of Relevant Samples Size from Population Database


Step 2 - Approaches for Defining Global Market Size (Value, Volume* & Price*)

Note*: In applicable scenarios
Step 3 - Data Sources
Primary Research
- Web Analytics
- Survey Reports
- Research Institute
- Latest Research Reports
- Opinion Leaders
Secondary Research
- Annual Reports
- White Paper
- Latest Press Release
- Industry Association
- Paid Database
- Investor Presentations

Step 4 - Data Triangulation
Involves using different sources of information in order to increase the validity of a study
These sources are likely to be stakeholders in a program - participants, other researchers, program staff, other community members, and so on.
Then we put all data in single framework & apply various statistical tools to find out the dynamic on the market.
During the analysis stage, feedback from the stakeholder groups would be compared to determine areas of agreement as well as areas of divergence