

Key Insights
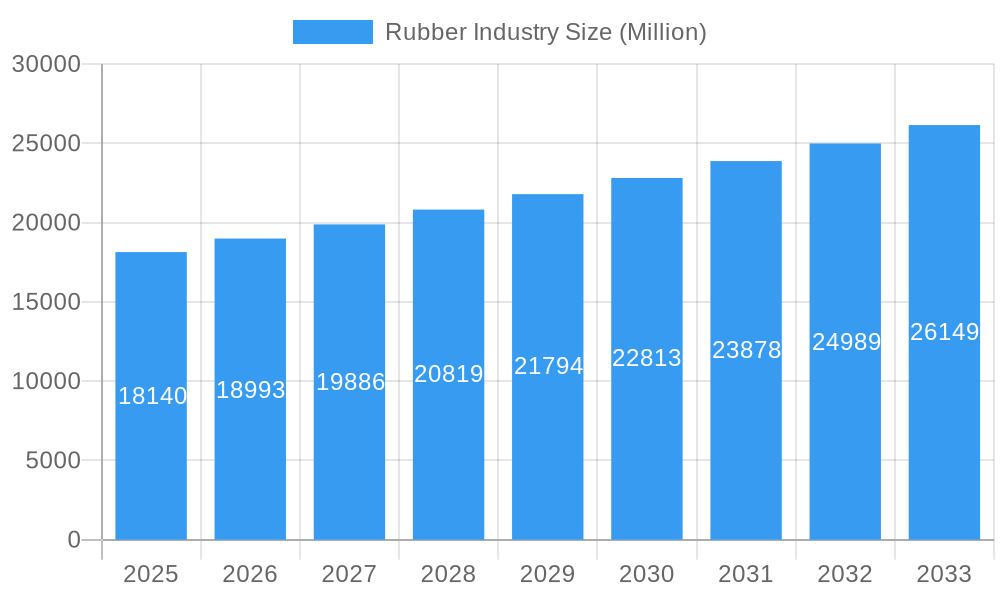
The global rubber industry, valued at $18.14 billion in 2025, is projected to experience robust growth, driven by a compound annual growth rate (CAGR) of 4.70% from 2025 to 2033. This expansion is fueled by several key factors. The automotive sector, a major consumer of rubber for tires and other components, is experiencing consistent growth, particularly in developing economies with expanding vehicle ownership. Furthermore, the increasing demand for rubber in industrial applications, such as conveyor belts and hoses, and the burgeoning medical device market requiring high-quality, specialized rubber products, contribute significantly to market expansion. The rise of sustainable and eco-friendly rubber production methods, alongside advancements in rubber compound technology leading to improved durability and performance, are further bolstering industry growth. However, fluctuating raw material prices and the potential impact of stricter environmental regulations pose challenges to consistent growth. The industry is witnessing a shift towards specialized rubber products catering to niche applications, offering opportunities for innovation and premium pricing. Geographic growth is anticipated to be uneven, with developing regions in Asia-Pacific, particularly China and India, driving a substantial portion of future demand due to their rapidly expanding manufacturing and automotive sectors. North America and Europe will continue to hold significant market shares, driven by established automotive and industrial sectors, although growth rates may be more moderate compared to emerging markets.
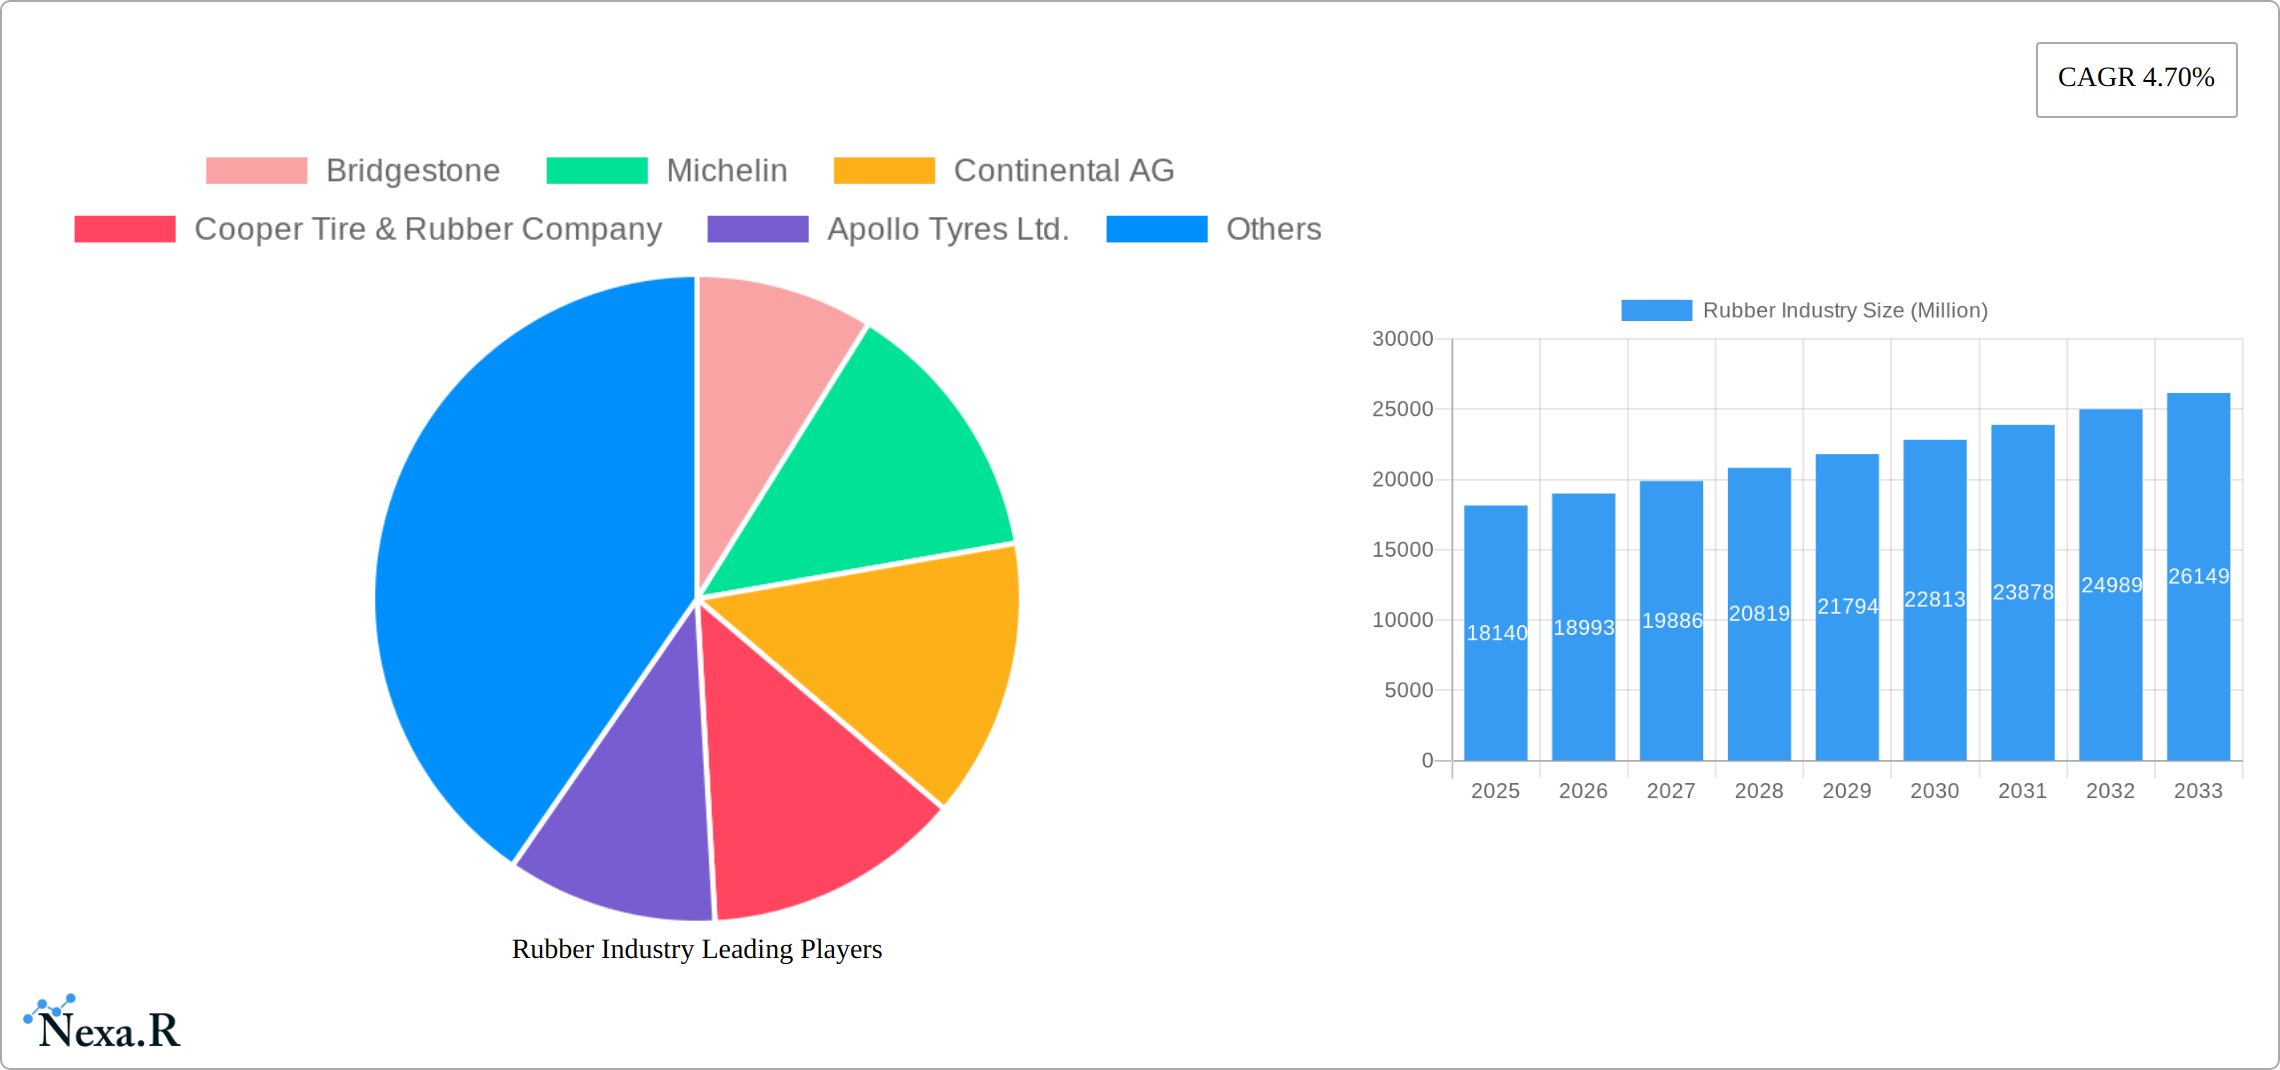
Rubber Industry Market Size (In Billion)
The segmentation of the rubber industry reveals further opportunities. While natural rubber maintains its significance, the demand for synthetic rubber is growing rapidly due to its versatility and cost-effectiveness in various applications. Speciality rubbers, designed for specific performance characteristics, are witnessing increased adoption across industries. The distribution channel continues to evolve, with a mix of direct sales, distributors, and retail channels catering to different market segments and customer needs. Key players like Bridgestone, Michelin, and Goodyear are strategically investing in research and development to maintain their market positions, while smaller companies are focusing on niche segments and specialized applications. The forecast period of 2025-2033 promises substantial growth for the industry, but requires a strategic response to market challenges and an agile adaptation to evolving consumer preferences and technological advancements.
Rubber Industry Company Market Share
Rubber Industry Market Report: 2019-2033
This comprehensive report provides a detailed analysis of the global rubber industry, encompassing market dynamics, growth trends, key players, and future outlook. The study period spans 2019-2033, with a base year of 2025 and a forecast period of 2025-2033. The report leverages extensive market research and data analysis to offer valuable insights for industry professionals, investors, and stakeholders. The report is segmented by product type (Natural Rubber, Synthetic Rubber, Speciality Rubber, Rubber Compounds), application (Automotive, Industrial, Medical, Consumer Goods), distribution channel (Direct Sales, Distributors, Retail), and end-user (Automotive Industry, Manufacturing, Healthcare, Construction, Consumer). Leading companies like Bridgestone, Michelin, Continental AG, and Goodyear are analyzed, providing a competitive landscape overview. The report's value is expressed in million units.
Rubber Industry Market Dynamics & Structure
The global rubber industry is a mature yet dynamic market characterized by moderate concentration, with key players holding significant market share. Bridgestone, Michelin, and Goodyear consistently rank among the top players, though their individual market shares fluctuate yearly. The industry is witnessing increased technological innovation driven by the demand for high-performance, sustainable, and specialized rubber products. Stringent environmental regulations and safety standards are shaping product development and manufacturing processes. Competitive product substitutes, such as plastics and alternative materials, pose a continuous challenge. However, the rubber industry's versatility and unique properties continue to drive demand across various applications.
- Market Concentration: Highly concentrated, with the top 10 players accounting for approximately xx% of global revenue in 2024.
- Technological Innovation: Focus on developing sustainable rubber sources, improving material properties (e.g., durability, strength), and enhancing manufacturing efficiency.
- Regulatory Framework: Stringent environmental regulations impacting raw material sourcing and manufacturing processes. Safety standards drive product quality and performance.
- Competitive Substitutes: Plastics and other materials pose competition, particularly in certain applications.
- M&A Trends: Consolidation through mergers and acquisitions is observed, particularly among smaller players seeking to gain scale and enhance technology portfolios. The number of M&A deals in the historical period (2019-2024) averaged xx per year.
Rubber Industry Growth Trends & Insights
The global rubber industry experienced a compound annual growth rate (CAGR) of xx% during the historical period (2019-2024), driven by robust demand from the automotive and industrial sectors. Market size is projected to reach xx million units by 2025 and xx million units by 2033. The increasing adoption of rubber in diverse applications such as medical devices, consumer goods, and construction materials fuels market expansion. Technological advancements like the development of high-performance rubber compounds are contributing to increased market penetration. Changing consumer preferences towards sustainable and eco-friendly products are also influencing industry trends. The automotive industry, particularly the tire segment, remains a significant driver of rubber demand, though the shift towards electric vehicles may introduce both opportunities and challenges.
Dominant Regions, Countries, or Segments in Rubber Industry
The Asia-Pacific region stands as the undisputed leader in the global rubber market. This dominance is fueled by a potent combination of rapid industrialization, sustained expansion in automotive manufacturing, and a consistently growing consumer spending power across its nations. China and India, in particular, are instrumental in propelling this regional surge. When examining product categories, synthetic rubber commands the largest market share, largely attributable to its inherent versatility and superior cost-effectiveness. Concurrently, there's a discernible acceleration in the demand for specialty rubber, driven by its critical role in high-performance and demanding applications.
- Key Drivers in Asia-Pacific: The region benefits from accelerated industrialization, a robust increase in automotive production, extensive infrastructure development projects, and supportive government policies that actively encourage and bolster the manufacturing sector.
- Dominance Factors: Lower overall manufacturing costs, readily available and accessible raw materials, and a vast and expanding consumer base are significant contributors to the region's leading position.
- Growth Potential: Significant and promising growth avenues are opening up in the emerging economies within the Asia-Pacific. This is characterized by an escalating demand for a wide array of rubber products across diverse industrial and consumer sectors. The continued expansion of the automotive sector remains a primary and influential driver. Furthermore, the increasing global emphasis on sustainable and environmentally friendly products presents a substantial opportunity for companies that are proactively adopting and implementing eco-conscious production practices.
Rubber Industry Product Landscape
The rubber industry showcases an extensive and varied product portfolio, encompassing everything from traditional natural and synthetic rubbers to highly specialized compounds meticulously engineered for very specific applications. Recent advancements and innovations are heavily focused on augmenting material properties, such as enhancing durability, increasing tensile strength, and improving flexibility. The integration of cutting-edge technologies, including nanotechnology and the development of bio-based materials, is instrumental in the creation of high-performance rubbers that also boast improved sustainability profiles. The unique selling propositions (USPs) of these advanced rubber products often highlight superior performance characteristics, a reduced environmental footprint, and greater cost-effectiveness when juxtaposed with conventional material alternatives.
Key Drivers, Barriers & Challenges in Rubber Industry
Key Drivers: The industry is propelled by escalating demand from critical sectors like the automotive industry, various industrial applications, and the rapidly expanding healthcare sector. Technological breakthroughs in the precise formulation of rubber compounds, coupled with supportive government initiatives for infrastructure development, further fuel this growth.
Challenges & Restraints: The industry faces significant headwinds from volatile raw material prices, which can unpredictably impact production costs. Stringent environmental regulations, while essential, often lead to increased manufacturing expenses. Intense competition from readily available substitute materials poses a constant challenge, and supply chain disruptions, both domestic and international, can severely impact production schedules and timely delivery. The cumulative effect of these challenges has historically led to upward price adjustments for rubber products and a noticeable reduction in profit margins for many manufacturers.
Emerging Opportunities in Rubber Industry
The horizon for the rubber industry is bright with emerging opportunities, particularly in the research, development, and widespread application of bio-based rubbers, the adoption of truly sustainable manufacturing practices, and the creation of specialized rubber compounds tailored for high-growth sectors such as renewable energy and sophisticated advanced medical devices. Furthermore, the largely untapped markets present within developing economies offer substantial and promising avenues for considerable growth and expansion.
Growth Accelerators in the Rubber Industry
Technological breakthroughs in material science, strategic partnerships to secure raw material supply, and aggressive market expansion strategies into high-growth regions are accelerating the industry's long-term growth. Companies that successfully integrate sustainable practices and develop innovative products are best positioned to succeed.
Key Players Shaping the Rubber Industry Market
Notable Milestones in Rubber Industry Sector
- 2020: Increased focus on sustainable rubber sourcing and manufacturing practices.
- 2021: Several key players announced investments in R&D for advanced rubber compounds.
- 2022: A significant merger between two mid-sized rubber companies reshaped the competitive landscape.
- 2023: Launch of several new high-performance tire products incorporating innovative materials.
- 2024: Government initiatives promoting the development of sustainable rubber industries in several key regions.
In-Depth Rubber Industry Market Outlook
The global rubber industry is firmly on a trajectory for sustained and robust growth. This positive outlook is underpinned by continuous technological advancements, the broadening spectrum of applications for rubber products, and the persistent, increasing demand from key end-user sectors. Strategic collaborations, significant investments directed towards sustainable operational practices, and an unwavering commitment to innovation will be paramount for unlocking and realizing the full potential of the future market. Companies that are agile enough to adapt to the constantly evolving market dynamics and adept at leveraging emergent technologies will undoubtedly be best positioned for enduring long-term success and leadership within the industry.
Rubber Industry Segmentation
- 1. Production Analysis
- 2. Consumption Analysis
- 3. Import Market Analysis (Value & Volume)
- 4. Export Market Analysis (Value & Volume)
- 5. Price Trend Analysis
Rubber Industry Segmentation By Geography
-
1. North America
- 1.1. United States
- 1.2. Mexico
-
2. Europe
- 2.1. Germany
- 2.2. France
- 2.3. Italy
- 2.4. Turkey
-
3. Asia Pacific
- 3.1. China
- 3.2. Malaysia
- 3.3. Thailand
- 3.4. Japan
- 3.5. India
- 3.6. Indonesia
-
4. South America
- 4.1. Brazil
- 4.2. Chile
-
5. Africa
- 5.1. South Africa
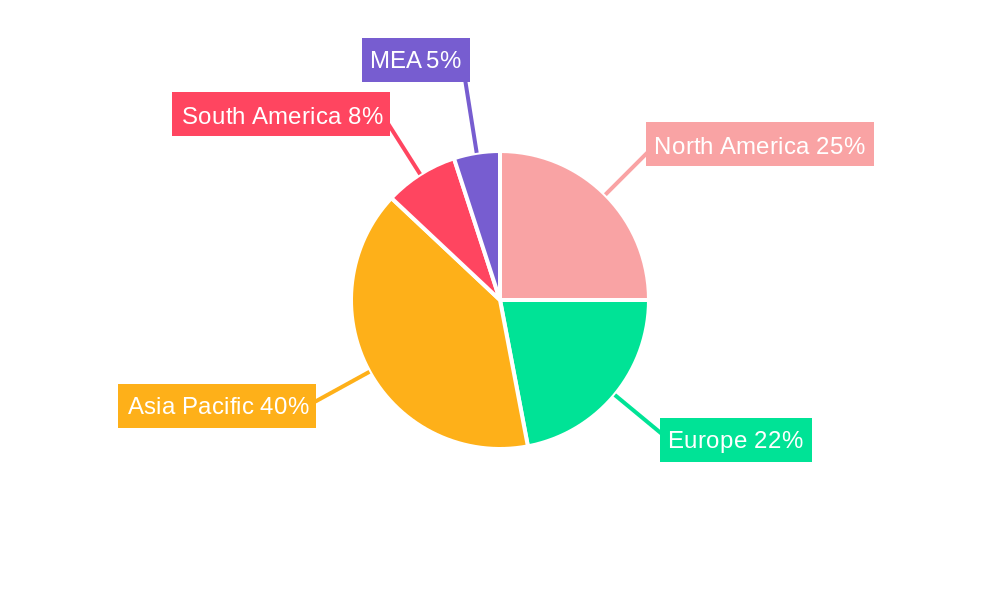
Rubber Industry Regional Market Share
Geographic Coverage of Rubber Industry
Rubber Industry REPORT HIGHLIGHTS
| Aspects | Details |
|---|---|
| Study Period | 2020-2034 |
| Base Year | 2025 |
| Estimated Year | 2026 |
| Forecast Period | 2026-2034 |
| Historical Period | 2020-2025 |
| Growth Rate | CAGR of 4.70% from 2020-2034 |
| Segmentation |
|
Table of Contents
- 1. Introduction
- 1.1. Research Scope
- 1.2. Market Segmentation
- 1.3. Research Methodology
- 1.4. Definitions and Assumptions
- 2. Executive Summary
- 2.1. Introduction
- 3. Market Dynamics
- 3.1. Introduction
- 3.2. Market Drivers
- 3.2.1. Increasing Berry Consumption for Health Benefits; Increasing Adoption of High-Technology Farm Practices; Growing Usage of Berries in the Food and Beverage Industries
- 3.3. Market Restrains
- 3.3.1. High Production Cost Involved in Berry Production; Increasing Disease and Pest Infestations
- 3.4. Market Trends
- 3.4.1. Increasing demand from Various Industries
- 4. Market Factor Analysis
- 4.1. Porters Five Forces
- 4.2. Supply/Value Chain
- 4.3. PESTEL analysis
- 4.4. Market Entropy
- 4.5. Patent/Trademark Analysis
- 5. Global Rubber Industry Analysis, Insights and Forecast, 2020-2032
- 5.1. Market Analysis, Insights and Forecast - by Production Analysis
- 5.2. Market Analysis, Insights and Forecast - by Consumption Analysis
- 5.3. Market Analysis, Insights and Forecast - by Import Market Analysis (Value & Volume)
- 5.4. Market Analysis, Insights and Forecast - by Export Market Analysis (Value & Volume)
- 5.5. Market Analysis, Insights and Forecast - by Price Trend Analysis
- 5.6. Market Analysis, Insights and Forecast - by Region
- 5.6.1. North America
- 5.6.2. Europe
- 5.6.3. Asia Pacific
- 5.6.4. South America
- 5.6.5. Africa
- 5.1. Market Analysis, Insights and Forecast - by Production Analysis
- 6. North America Rubber Industry Analysis, Insights and Forecast, 2020-2032
- 6.1. Market Analysis, Insights and Forecast - by Production Analysis
- 6.2. Market Analysis, Insights and Forecast - by Consumption Analysis
- 6.3. Market Analysis, Insights and Forecast - by Import Market Analysis (Value & Volume)
- 6.4. Market Analysis, Insights and Forecast - by Export Market Analysis (Value & Volume)
- 6.5. Market Analysis, Insights and Forecast - by Price Trend Analysis
- 6.1. Market Analysis, Insights and Forecast - by Production Analysis
- 7. Europe Rubber Industry Analysis, Insights and Forecast, 2020-2032
- 7.1. Market Analysis, Insights and Forecast - by Production Analysis
- 7.2. Market Analysis, Insights and Forecast - by Consumption Analysis
- 7.3. Market Analysis, Insights and Forecast - by Import Market Analysis (Value & Volume)
- 7.4. Market Analysis, Insights and Forecast - by Export Market Analysis (Value & Volume)
- 7.5. Market Analysis, Insights and Forecast - by Price Trend Analysis
- 7.1. Market Analysis, Insights and Forecast - by Production Analysis
- 8. Asia Pacific Rubber Industry Analysis, Insights and Forecast, 2020-2032
- 8.1. Market Analysis, Insights and Forecast - by Production Analysis
- 8.2. Market Analysis, Insights and Forecast - by Consumption Analysis
- 8.3. Market Analysis, Insights and Forecast - by Import Market Analysis (Value & Volume)
- 8.4. Market Analysis, Insights and Forecast - by Export Market Analysis (Value & Volume)
- 8.5. Market Analysis, Insights and Forecast - by Price Trend Analysis
- 8.1. Market Analysis, Insights and Forecast - by Production Analysis
- 9. South America Rubber Industry Analysis, Insights and Forecast, 2020-2032
- 9.1. Market Analysis, Insights and Forecast - by Production Analysis
- 9.2. Market Analysis, Insights and Forecast - by Consumption Analysis
- 9.3. Market Analysis, Insights and Forecast - by Import Market Analysis (Value & Volume)
- 9.4. Market Analysis, Insights and Forecast - by Export Market Analysis (Value & Volume)
- 9.5. Market Analysis, Insights and Forecast - by Price Trend Analysis
- 9.1. Market Analysis, Insights and Forecast - by Production Analysis
- 10. Africa Rubber Industry Analysis, Insights and Forecast, 2020-2032
- 10.1. Market Analysis, Insights and Forecast - by Production Analysis
- 10.2. Market Analysis, Insights and Forecast - by Consumption Analysis
- 10.3. Market Analysis, Insights and Forecast - by Import Market Analysis (Value & Volume)
- 10.4. Market Analysis, Insights and Forecast - by Export Market Analysis (Value & Volume)
- 10.5. Market Analysis, Insights and Forecast - by Price Trend Analysis
- 10.1. Market Analysis, Insights and Forecast - by Production Analysis
- 11. Competitive Analysis
- 11.1. Global Market Share Analysis 2025
- 11.2. Company Profiles
- 11.2.1 Bridgestone
- 11.2.1.1. Overview
- 11.2.1.2. Products
- 11.2.1.3. SWOT Analysis
- 11.2.1.4. Recent Developments
- 11.2.1.5. Financials (Based on Availability)
- 11.2.2 Michelin
- 11.2.2.1. Overview
- 11.2.2.2. Products
- 11.2.2.3. SWOT Analysis
- 11.2.2.4. Recent Developments
- 11.2.2.5. Financials (Based on Availability)
- 11.2.3 Continental AG
- 11.2.3.1. Overview
- 11.2.3.2. Products
- 11.2.3.3. SWOT Analysis
- 11.2.3.4. Recent Developments
- 11.2.3.5. Financials (Based on Availability)
- 11.2.4 Cooper Tire & Rubber Company
- 11.2.4.1. Overview
- 11.2.4.2. Products
- 11.2.4.3. SWOT Analysis
- 11.2.4.4. Recent Developments
- 11.2.4.5. Financials (Based on Availability)
- 11.2.5 Apollo Tyres Ltd.
- 11.2.5.1. Overview
- 11.2.5.2. Products
- 11.2.5.3. SWOT Analysis
- 11.2.5.4. Recent Developments
- 11.2.5.5. Financials (Based on Availability)
- 11.2.6 Kumho Tire Co. Inc.
- 11.2.6.1. Overview
- 11.2.6.2. Products
- 11.2.6.3. SWOT Analysis
- 11.2.6.4. Recent Developments
- 11.2.6.5. Financials (Based on Availability)
- 11.2.7 The Goodyear Tire & Rubber Company
- 11.2.7.1. Overview
- 11.2.7.2. Products
- 11.2.7.3. SWOT Analysis
- 11.2.7.4. Recent Developments
- 11.2.7.5. Financials (Based on Availability)
- 11.2.8 Pirelli & C. S.p.A.
- 11.2.8.1. Overview
- 11.2.8.2. Products
- 11.2.8.3. SWOT Analysis
- 11.2.8.4. Recent Developments
- 11.2.8.5. Financials (Based on Availability)
- 11.2.9 Sumitomo Rubber Industries Ltd.
- 11.2.9.1. Overview
- 11.2.9.2. Products
- 11.2.9.3. SWOT Analysis
- 11.2.9.4. Recent Developments
- 11.2.9.5. Financials (Based on Availability)
- 11.2.10 Hankook Tire & Technology
- 11.2.10.1. Overview
- 11.2.10.2. Products
- 11.2.10.3. SWOT Analysis
- 11.2.10.4. Recent Developments
- 11.2.10.5. Financials (Based on Availability)
- 11.2.1 Bridgestone
List of Figures
- Figure 1: Global Rubber Industry Revenue Breakdown (Million, %) by Region 2025 & 2033
- Figure 2: North America Rubber Industry Revenue (Million), by Production Analysis 2025 & 2033
- Figure 3: North America Rubber Industry Revenue Share (%), by Production Analysis 2025 & 2033
- Figure 4: North America Rubber Industry Revenue (Million), by Consumption Analysis 2025 & 2033
- Figure 5: North America Rubber Industry Revenue Share (%), by Consumption Analysis 2025 & 2033
- Figure 6: North America Rubber Industry Revenue (Million), by Import Market Analysis (Value & Volume) 2025 & 2033
- Figure 7: North America Rubber Industry Revenue Share (%), by Import Market Analysis (Value & Volume) 2025 & 2033
- Figure 8: North America Rubber Industry Revenue (Million), by Export Market Analysis (Value & Volume) 2025 & 2033
- Figure 9: North America Rubber Industry Revenue Share (%), by Export Market Analysis (Value & Volume) 2025 & 2033
- Figure 10: North America Rubber Industry Revenue (Million), by Price Trend Analysis 2025 & 2033
- Figure 11: North America Rubber Industry Revenue Share (%), by Price Trend Analysis 2025 & 2033
- Figure 12: North America Rubber Industry Revenue (Million), by Country 2025 & 2033
- Figure 13: North America Rubber Industry Revenue Share (%), by Country 2025 & 2033
- Figure 14: Europe Rubber Industry Revenue (Million), by Production Analysis 2025 & 2033
- Figure 15: Europe Rubber Industry Revenue Share (%), by Production Analysis 2025 & 2033
- Figure 16: Europe Rubber Industry Revenue (Million), by Consumption Analysis 2025 & 2033
- Figure 17: Europe Rubber Industry Revenue Share (%), by Consumption Analysis 2025 & 2033
- Figure 18: Europe Rubber Industry Revenue (Million), by Import Market Analysis (Value & Volume) 2025 & 2033
- Figure 19: Europe Rubber Industry Revenue Share (%), by Import Market Analysis (Value & Volume) 2025 & 2033
- Figure 20: Europe Rubber Industry Revenue (Million), by Export Market Analysis (Value & Volume) 2025 & 2033
- Figure 21: Europe Rubber Industry Revenue Share (%), by Export Market Analysis (Value & Volume) 2025 & 2033
- Figure 22: Europe Rubber Industry Revenue (Million), by Price Trend Analysis 2025 & 2033
- Figure 23: Europe Rubber Industry Revenue Share (%), by Price Trend Analysis 2025 & 2033
- Figure 24: Europe Rubber Industry Revenue (Million), by Country 2025 & 2033
- Figure 25: Europe Rubber Industry Revenue Share (%), by Country 2025 & 2033
- Figure 26: Asia Pacific Rubber Industry Revenue (Million), by Production Analysis 2025 & 2033
- Figure 27: Asia Pacific Rubber Industry Revenue Share (%), by Production Analysis 2025 & 2033
- Figure 28: Asia Pacific Rubber Industry Revenue (Million), by Consumption Analysis 2025 & 2033
- Figure 29: Asia Pacific Rubber Industry Revenue Share (%), by Consumption Analysis 2025 & 2033
- Figure 30: Asia Pacific Rubber Industry Revenue (Million), by Import Market Analysis (Value & Volume) 2025 & 2033
- Figure 31: Asia Pacific Rubber Industry Revenue Share (%), by Import Market Analysis (Value & Volume) 2025 & 2033
- Figure 32: Asia Pacific Rubber Industry Revenue (Million), by Export Market Analysis (Value & Volume) 2025 & 2033
- Figure 33: Asia Pacific Rubber Industry Revenue Share (%), by Export Market Analysis (Value & Volume) 2025 & 2033
- Figure 34: Asia Pacific Rubber Industry Revenue (Million), by Price Trend Analysis 2025 & 2033
- Figure 35: Asia Pacific Rubber Industry Revenue Share (%), by Price Trend Analysis 2025 & 2033
- Figure 36: Asia Pacific Rubber Industry Revenue (Million), by Country 2025 & 2033
- Figure 37: Asia Pacific Rubber Industry Revenue Share (%), by Country 2025 & 2033
- Figure 38: South America Rubber Industry Revenue (Million), by Production Analysis 2025 & 2033
- Figure 39: South America Rubber Industry Revenue Share (%), by Production Analysis 2025 & 2033
- Figure 40: South America Rubber Industry Revenue (Million), by Consumption Analysis 2025 & 2033
- Figure 41: South America Rubber Industry Revenue Share (%), by Consumption Analysis 2025 & 2033
- Figure 42: South America Rubber Industry Revenue (Million), by Import Market Analysis (Value & Volume) 2025 & 2033
- Figure 43: South America Rubber Industry Revenue Share (%), by Import Market Analysis (Value & Volume) 2025 & 2033
- Figure 44: South America Rubber Industry Revenue (Million), by Export Market Analysis (Value & Volume) 2025 & 2033
- Figure 45: South America Rubber Industry Revenue Share (%), by Export Market Analysis (Value & Volume) 2025 & 2033
- Figure 46: South America Rubber Industry Revenue (Million), by Price Trend Analysis 2025 & 2033
- Figure 47: South America Rubber Industry Revenue Share (%), by Price Trend Analysis 2025 & 2033
- Figure 48: South America Rubber Industry Revenue (Million), by Country 2025 & 2033
- Figure 49: South America Rubber Industry Revenue Share (%), by Country 2025 & 2033
- Figure 50: Africa Rubber Industry Revenue (Million), by Production Analysis 2025 & 2033
- Figure 51: Africa Rubber Industry Revenue Share (%), by Production Analysis 2025 & 2033
- Figure 52: Africa Rubber Industry Revenue (Million), by Consumption Analysis 2025 & 2033
- Figure 53: Africa Rubber Industry Revenue Share (%), by Consumption Analysis 2025 & 2033
- Figure 54: Africa Rubber Industry Revenue (Million), by Import Market Analysis (Value & Volume) 2025 & 2033
- Figure 55: Africa Rubber Industry Revenue Share (%), by Import Market Analysis (Value & Volume) 2025 & 2033
- Figure 56: Africa Rubber Industry Revenue (Million), by Export Market Analysis (Value & Volume) 2025 & 2033
- Figure 57: Africa Rubber Industry Revenue Share (%), by Export Market Analysis (Value & Volume) 2025 & 2033
- Figure 58: Africa Rubber Industry Revenue (Million), by Price Trend Analysis 2025 & 2033
- Figure 59: Africa Rubber Industry Revenue Share (%), by Price Trend Analysis 2025 & 2033
- Figure 60: Africa Rubber Industry Revenue (Million), by Country 2025 & 2033
- Figure 61: Africa Rubber Industry Revenue Share (%), by Country 2025 & 2033
List of Tables
- Table 1: Global Rubber Industry Revenue Million Forecast, by Production Analysis 2020 & 2033
- Table 2: Global Rubber Industry Revenue Million Forecast, by Consumption Analysis 2020 & 2033
- Table 3: Global Rubber Industry Revenue Million Forecast, by Import Market Analysis (Value & Volume) 2020 & 2033
- Table 4: Global Rubber Industry Revenue Million Forecast, by Export Market Analysis (Value & Volume) 2020 & 2033
- Table 5: Global Rubber Industry Revenue Million Forecast, by Price Trend Analysis 2020 & 2033
- Table 6: Global Rubber Industry Revenue Million Forecast, by Region 2020 & 2033
- Table 7: Global Rubber Industry Revenue Million Forecast, by Production Analysis 2020 & 2033
- Table 8: Global Rubber Industry Revenue Million Forecast, by Consumption Analysis 2020 & 2033
- Table 9: Global Rubber Industry Revenue Million Forecast, by Import Market Analysis (Value & Volume) 2020 & 2033
- Table 10: Global Rubber Industry Revenue Million Forecast, by Export Market Analysis (Value & Volume) 2020 & 2033
- Table 11: Global Rubber Industry Revenue Million Forecast, by Price Trend Analysis 2020 & 2033
- Table 12: Global Rubber Industry Revenue Million Forecast, by Country 2020 & 2033
- Table 13: United States Rubber Industry Revenue (Million) Forecast, by Application 2020 & 2033
- Table 14: Mexico Rubber Industry Revenue (Million) Forecast, by Application 2020 & 2033
- Table 15: Global Rubber Industry Revenue Million Forecast, by Production Analysis 2020 & 2033
- Table 16: Global Rubber Industry Revenue Million Forecast, by Consumption Analysis 2020 & 2033
- Table 17: Global Rubber Industry Revenue Million Forecast, by Import Market Analysis (Value & Volume) 2020 & 2033
- Table 18: Global Rubber Industry Revenue Million Forecast, by Export Market Analysis (Value & Volume) 2020 & 2033
- Table 19: Global Rubber Industry Revenue Million Forecast, by Price Trend Analysis 2020 & 2033
- Table 20: Global Rubber Industry Revenue Million Forecast, by Country 2020 & 2033
- Table 21: Germany Rubber Industry Revenue (Million) Forecast, by Application 2020 & 2033
- Table 22: France Rubber Industry Revenue (Million) Forecast, by Application 2020 & 2033
- Table 23: Italy Rubber Industry Revenue (Million) Forecast, by Application 2020 & 2033
- Table 24: Turkey Rubber Industry Revenue (Million) Forecast, by Application 2020 & 2033
- Table 25: Global Rubber Industry Revenue Million Forecast, by Production Analysis 2020 & 2033
- Table 26: Global Rubber Industry Revenue Million Forecast, by Consumption Analysis 2020 & 2033
- Table 27: Global Rubber Industry Revenue Million Forecast, by Import Market Analysis (Value & Volume) 2020 & 2033
- Table 28: Global Rubber Industry Revenue Million Forecast, by Export Market Analysis (Value & Volume) 2020 & 2033
- Table 29: Global Rubber Industry Revenue Million Forecast, by Price Trend Analysis 2020 & 2033
- Table 30: Global Rubber Industry Revenue Million Forecast, by Country 2020 & 2033
- Table 31: China Rubber Industry Revenue (Million) Forecast, by Application 2020 & 2033
- Table 32: Malaysia Rubber Industry Revenue (Million) Forecast, by Application 2020 & 2033
- Table 33: Thailand Rubber Industry Revenue (Million) Forecast, by Application 2020 & 2033
- Table 34: Japan Rubber Industry Revenue (Million) Forecast, by Application 2020 & 2033
- Table 35: India Rubber Industry Revenue (Million) Forecast, by Application 2020 & 2033
- Table 36: Indonesia Rubber Industry Revenue (Million) Forecast, by Application 2020 & 2033
- Table 37: Global Rubber Industry Revenue Million Forecast, by Production Analysis 2020 & 2033
- Table 38: Global Rubber Industry Revenue Million Forecast, by Consumption Analysis 2020 & 2033
- Table 39: Global Rubber Industry Revenue Million Forecast, by Import Market Analysis (Value & Volume) 2020 & 2033
- Table 40: Global Rubber Industry Revenue Million Forecast, by Export Market Analysis (Value & Volume) 2020 & 2033
- Table 41: Global Rubber Industry Revenue Million Forecast, by Price Trend Analysis 2020 & 2033
- Table 42: Global Rubber Industry Revenue Million Forecast, by Country 2020 & 2033
- Table 43: Brazil Rubber Industry Revenue (Million) Forecast, by Application 2020 & 2033
- Table 44: Chile Rubber Industry Revenue (Million) Forecast, by Application 2020 & 2033
- Table 45: Global Rubber Industry Revenue Million Forecast, by Production Analysis 2020 & 2033
- Table 46: Global Rubber Industry Revenue Million Forecast, by Consumption Analysis 2020 & 2033
- Table 47: Global Rubber Industry Revenue Million Forecast, by Import Market Analysis (Value & Volume) 2020 & 2033
- Table 48: Global Rubber Industry Revenue Million Forecast, by Export Market Analysis (Value & Volume) 2020 & 2033
- Table 49: Global Rubber Industry Revenue Million Forecast, by Price Trend Analysis 2020 & 2033
- Table 50: Global Rubber Industry Revenue Million Forecast, by Country 2020 & 2033
- Table 51: South Africa Rubber Industry Revenue (Million) Forecast, by Application 2020 & 2033
Frequently Asked Questions
1. What is the projected Compound Annual Growth Rate (CAGR) of the Rubber Industry?
The projected CAGR is approximately 4.70%.
2. Which companies are prominent players in the Rubber Industry?
Key companies in the market include Bridgestone , Michelin , Continental AG , Cooper Tire & Rubber Company , Apollo Tyres Ltd. , Kumho Tire Co., Inc., The Goodyear Tire & Rubber Company , Pirelli & C. S.p.A. , Sumitomo Rubber Industries, Ltd. , Hankook Tire & Technology.
3. What are the main segments of the Rubber Industry?
The market segments include Production Analysis, Consumption Analysis, Import Market Analysis (Value & Volume), Export Market Analysis (Value & Volume), Price Trend Analysis.
4. Can you provide details about the market size?
The market size is estimated to be USD 18.14 Million as of 2022.
5. What are some drivers contributing to market growth?
Increasing Berry Consumption for Health Benefits; Increasing Adoption of High-Technology Farm Practices; Growing Usage of Berries in the Food and Beverage Industries.
6. What are the notable trends driving market growth?
Increasing demand from Various Industries.
7. Are there any restraints impacting market growth?
High Production Cost Involved in Berry Production; Increasing Disease and Pest Infestations.
8. Can you provide examples of recent developments in the market?
N/A
9. What pricing options are available for accessing the report?
Pricing options include single-user, multi-user, and enterprise licenses priced at USD 4750, USD 5250, and USD 8750 respectively.
10. Is the market size provided in terms of value or volume?
The market size is provided in terms of value, measured in Million.
11. Are there any specific market keywords associated with the report?
Yes, the market keyword associated with the report is "Rubber Industry," which aids in identifying and referencing the specific market segment covered.
12. How do I determine which pricing option suits my needs best?
The pricing options vary based on user requirements and access needs. Individual users may opt for single-user licenses, while businesses requiring broader access may choose multi-user or enterprise licenses for cost-effective access to the report.
13. Are there any additional resources or data provided in the Rubber Industry report?
While the report offers comprehensive insights, it's advisable to review the specific contents or supplementary materials provided to ascertain if additional resources or data are available.
14. How can I stay updated on further developments or reports in the Rubber Industry?
To stay informed about further developments, trends, and reports in the Rubber Industry, consider subscribing to industry newsletters, following relevant companies and organizations, or regularly checking reputable industry news sources and publications.
Methodology
Step 1 - Identification of Relevant Samples Size from Population Database


Step 2 - Approaches for Defining Global Market Size (Value, Volume* & Price*)

Note*: In applicable scenarios
Step 3 - Data Sources
Primary Research
- Web Analytics
- Survey Reports
- Research Institute
- Latest Research Reports
- Opinion Leaders
Secondary Research
- Annual Reports
- White Paper
- Latest Press Release
- Industry Association
- Paid Database
- Investor Presentations

Step 4 - Data Triangulation
Involves using different sources of information in order to increase the validity of a study
These sources are likely to be stakeholders in a program - participants, other researchers, program staff, other community members, and so on.
Then we put all data in single framework & apply various statistical tools to find out the dynamic on the market.
During the analysis stage, feedback from the stakeholder groups would be compared to determine areas of agreement as well as areas of divergence