

Key Insights
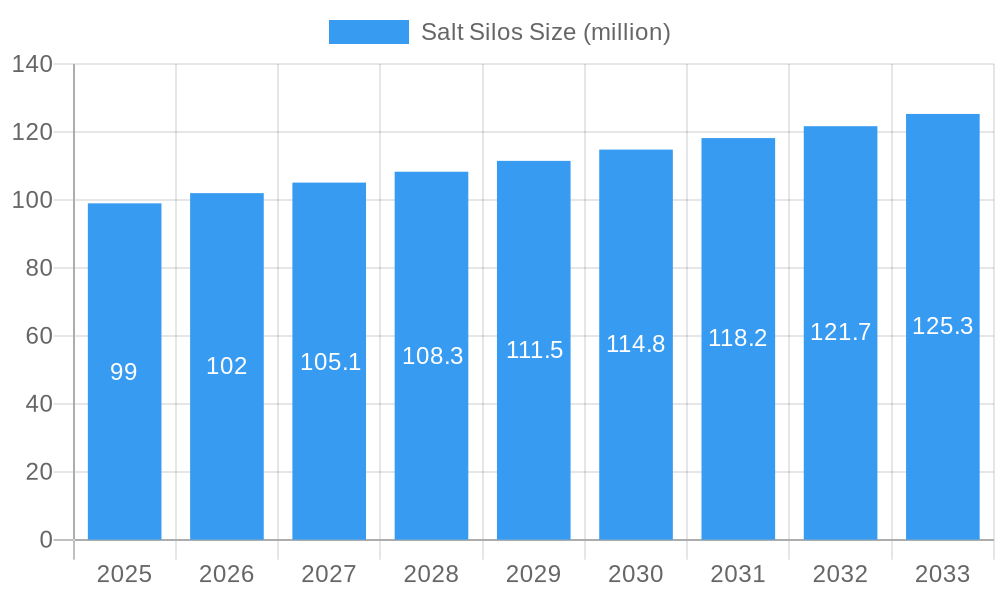
The global salt silo market, currently valued at approximately $99 million in 2025, is projected to experience steady growth, driven by increasing demand from the food processing, chemical, and water treatment industries. The Compound Annual Growth Rate (CAGR) of 2.7% from 2025 to 2033 indicates a consistent, albeit moderate, expansion. This growth is fueled by factors such as the rising global population, increasing industrialization leading to higher salt consumption, and the need for efficient and safe salt storage solutions. Furthermore, the ongoing trend towards automation and improved logistics in the handling of bulk materials contributes to the adoption of advanced salt silo technologies offering better efficiency and reduced operational costs. However, factors like fluctuating salt prices and stringent environmental regulations regarding material handling and waste disposal may pose challenges to market expansion.
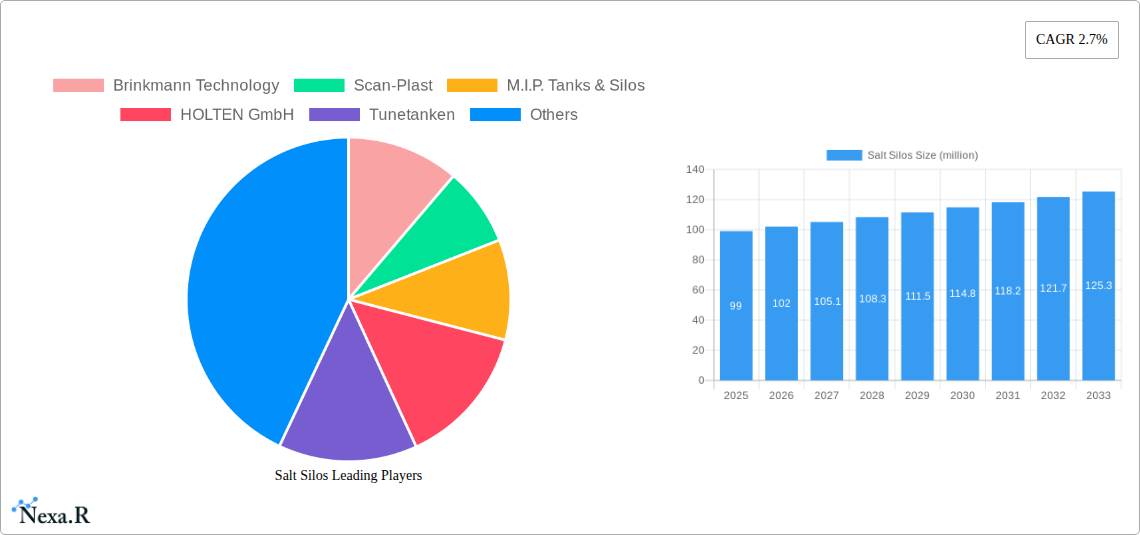
Salt Silos Market Size (In Million)
The competitive landscape features several key players including Brinkmann Technology, Scan-Plast, M.I.P. Tanks & Silos, HOLTEN GmbH, Tunetanken, Polem BV, and Blumer Lehmann. These companies are actively engaged in developing innovative silo designs and improving their manufacturing processes to cater to the evolving demands of various industries. Market segmentation likely includes variations based on silo capacity, material construction (e.g., steel, concrete), and automation features. Regional variations in market share are expected, with developed economies potentially exhibiting higher adoption rates due to advanced infrastructure and stringent safety standards. Future growth will depend on technological advancements, regulatory changes, and the overall health of the industries relying on efficient salt storage and handling. The market is expected to see continuous innovation in areas like improved material durability, enhanced safety features, and integration with automated material handling systems.
Salt Silos Company Market Share
Salt Silos Market Report: A Comprehensive Analysis (2019-2033)
This comprehensive report provides an in-depth analysis of the global salt silos market, offering invaluable insights for industry professionals, investors, and strategic decision-makers. Covering the period from 2019 to 2033, with a focus on 2025, this report meticulously examines market dynamics, growth trends, regional dominance, product landscapes, and key players shaping the industry's future. The parent market is the industrial storage solutions market, while the child market is specifically salt storage solutions.
Salt Silos Market Dynamics & Structure
This section analyzes the competitive landscape of the salt silos market, encompassing market concentration, technological innovation, regulatory influences, and market trends. The global salt silo market size in 2025 is estimated at $xx million.
- Market Concentration: The market exhibits a moderately concentrated structure, with key players such as Brinkmann Technology, Scan-Plast, M.I.P. Tanks & Silos, HOLTEN GmbH, Tunetanken, Polem BV, and Blumer Lehmann holding significant market share. The combined market share of the top five players in 2025 is estimated at xx%.
- Technological Innovation: Innovation focuses on improved material handling, automation, and enhanced durability, leading to increased efficiency and reduced operational costs. However, high initial investment costs present a barrier to entry for smaller players.
- Regulatory Framework: Stringent safety and environmental regulations concerning salt storage and handling significantly influence silo design and operations. Compliance costs represent a significant operational expense for market participants.
- Competitive Substitutes: Alternative salt storage methods exist, including bulk storage and bagged salt, but silos remain preferred due to their efficiency and protection against environmental factors.
- End-User Demographics: The primary end-users include chemical processing industries, food processing facilities, water treatment plants, and road de-icing companies. The growth of these industries directly impacts the demand for salt silos.
- M&A Trends: The market has witnessed a moderate level of M&A activity in recent years, with xx major deals recorded between 2019 and 2024, primarily focused on expanding geographical reach and product portfolios.
Salt Silos Growth Trends & Insights
This section details the historical and projected growth of the salt silos market, identifying key factors driving expansion and potential disruptions. The market experienced a CAGR of xx% during the historical period (2019-2024), driven by increasing demand from diverse end-use sectors and infrastructure developments. The estimated market size in 2025 is $xx million, projected to reach $xx million by 2033, with a forecast CAGR of xx% during 2025-2033. Technological advancements such as automated filling and emptying systems and improved corrosion resistance are key drivers influencing growth. Changing consumer behavior, particularly a focus on sustainable practices and improved safety, also impacts market trends.
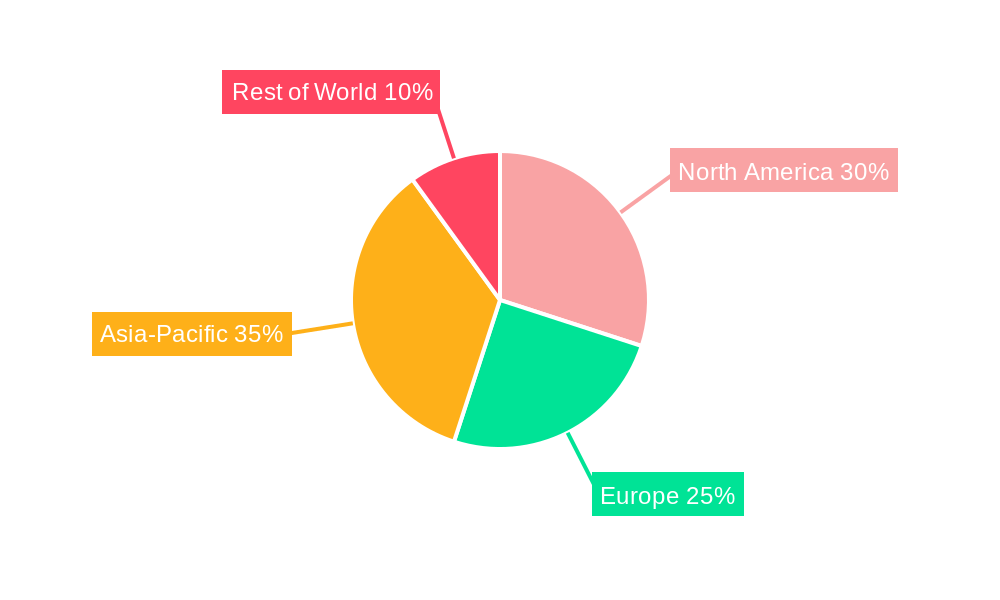
Dominant Regions, Countries, or Segments in Salt Silos
North America currently holds the largest market share, driven by significant infrastructure investment and robust end-user industries. However, Asia-Pacific is expected to witness the fastest growth due to rapid industrialization and increasing demand for salt in various applications.
- Key Drivers in North America: Strong chemical and food processing industries, robust infrastructure, and established regulatory frameworks contribute to market dominance.
- Key Drivers in Asia-Pacific: Rapid industrialization, growing urbanization, and rising demand from diverse sectors fuel market expansion. Government initiatives supporting infrastructure development also play a crucial role.
- Europe: Mature market with steady growth, driven by upgrades and replacements of older silo infrastructure. Stringent environmental regulations impact market dynamics.
Salt Silos Product Landscape
Salt silos are manufactured from various materials like steel, concrete, and polymers, each offering unique properties regarding strength, durability, and cost-effectiveness. Recent innovations include the incorporation of smart sensors for real-time monitoring of salt levels and condition, enhancing efficiency and safety. The focus is on developing corrosion-resistant materials and improved material handling systems to increase lifespan and minimize maintenance requirements.
Key Drivers, Barriers & Challenges in Salt Silos
Key Drivers: Increased demand from the chemical, food processing, and de-icing industries; infrastructure development; government investments; technological advancements in material handling and automation.
Key Challenges: High initial investment costs; stringent safety and environmental regulations; fluctuating raw material prices; competition from alternative storage solutions; supply chain disruptions. Supply chain issues, particularly steel price volatility, impacted production in 2022, leading to an estimated xx% increase in production costs.
Emerging Opportunities in Salt Silos
Emerging opportunities include the development of specialized silos for niche applications, the integration of IoT technologies for remote monitoring and predictive maintenance, and expansion into developing markets with growing demand for efficient salt storage solutions. Further research into sustainable materials and environmentally friendly manufacturing processes presents a significant opportunity for market expansion.
Growth Accelerators in the Salt Silos Industry
Long-term growth will be propelled by technological advancements leading to greater efficiency and cost-effectiveness, strategic partnerships among manufacturers and end-users to optimize supply chains, and expansion into new geographical markets with emerging industries. Government regulations promoting sustainable infrastructure and safe storage practices further accelerate growth.
Key Players Shaping the Salt Silos Market
- Brinkmann Technology
- Scan-Plast
- M.I.P. Tanks & Silos
- HOLTEN GmbH
- Tunetanken
- Polem BV
- Blumer Lehmann
Notable Milestones in Salt Silos Sector
- 2021: Introduction of a new corrosion-resistant steel alloy by Brinkmann Technology significantly enhances silo lifespan.
- 2022: M.I.P. Tanks & Silos launches a smart silo monitoring system incorporating IoT technology.
- 2023: A major merger between two smaller silo manufacturers leads to increased market consolidation.
In-Depth Salt Silos Market Outlook
The salt silos market is poised for robust growth driven by sustained demand from key industries, technological advancements, and strategic investments in infrastructure. Companies focusing on innovation, sustainable practices, and strategic partnerships will be best positioned to capitalize on the expanding market opportunities. The market is expected to experience continued growth, with significant opportunities for expansion in emerging economies and the adoption of advanced technologies.
Salt Silos Segmentation
-
1. Application
- 1.1. Food and Beverage
- 1.2. Agriculture
- 1.3. Others
-
2. Types
- 2.1. FRP
- 2.2. Steel
Salt Silos Segmentation By Geography
-
1. North America
- 1.1. United States
- 1.2. Canada
- 1.3. Mexico
-
2. South America
- 2.1. Brazil
- 2.2. Argentina
- 2.3. Rest of South America
-
3. Europe
- 3.1. United Kingdom
- 3.2. Germany
- 3.3. France
- 3.4. Italy
- 3.5. Spain
- 3.6. Russia
- 3.7. Benelux
- 3.8. Nordics
- 3.9. Rest of Europe
-
4. Middle East & Africa
- 4.1. Turkey
- 4.2. Israel
- 4.3. GCC
- 4.4. North Africa
- 4.5. South Africa
- 4.6. Rest of Middle East & Africa
-
5. Asia Pacific
- 5.1. China
- 5.2. India
- 5.3. Japan
- 5.4. South Korea
- 5.5. ASEAN
- 5.6. Oceania
- 5.7. Rest of Asia Pacific
Salt Silos Regional Market Share
Geographic Coverage of Salt Silos
Salt Silos REPORT HIGHLIGHTS
| Aspects | Details |
|---|---|
| Study Period | 2020-2034 |
| Base Year | 2025 |
| Estimated Year | 2026 |
| Forecast Period | 2026-2034 |
| Historical Period | 2020-2025 |
| Growth Rate | CAGR of 2.7% from 2020-2034 |
| Segmentation |
|
Table of Contents
- 1. Introduction
- 1.1. Research Scope
- 1.2. Market Segmentation
- 1.3. Research Methodology
- 1.4. Definitions and Assumptions
- 2. Executive Summary
- 2.1. Introduction
- 3. Market Dynamics
- 3.1. Introduction
- 3.2. Market Drivers
- 3.3. Market Restrains
- 3.4. Market Trends
- 4. Market Factor Analysis
- 4.1. Porters Five Forces
- 4.2. Supply/Value Chain
- 4.3. PESTEL analysis
- 4.4. Market Entropy
- 4.5. Patent/Trademark Analysis
- 5. Global Salt Silos Analysis, Insights and Forecast, 2020-2032
- 5.1. Market Analysis, Insights and Forecast - by Application
- 5.1.1. Food and Beverage
- 5.1.2. Agriculture
- 5.1.3. Others
- 5.2. Market Analysis, Insights and Forecast - by Types
- 5.2.1. FRP
- 5.2.2. Steel
- 5.3. Market Analysis, Insights and Forecast - by Region
- 5.3.1. North America
- 5.3.2. South America
- 5.3.3. Europe
- 5.3.4. Middle East & Africa
- 5.3.5. Asia Pacific
- 5.1. Market Analysis, Insights and Forecast - by Application
- 6. North America Salt Silos Analysis, Insights and Forecast, 2020-2032
- 6.1. Market Analysis, Insights and Forecast - by Application
- 6.1.1. Food and Beverage
- 6.1.2. Agriculture
- 6.1.3. Others
- 6.2. Market Analysis, Insights and Forecast - by Types
- 6.2.1. FRP
- 6.2.2. Steel
- 6.1. Market Analysis, Insights and Forecast - by Application
- 7. South America Salt Silos Analysis, Insights and Forecast, 2020-2032
- 7.1. Market Analysis, Insights and Forecast - by Application
- 7.1.1. Food and Beverage
- 7.1.2. Agriculture
- 7.1.3. Others
- 7.2. Market Analysis, Insights and Forecast - by Types
- 7.2.1. FRP
- 7.2.2. Steel
- 7.1. Market Analysis, Insights and Forecast - by Application
- 8. Europe Salt Silos Analysis, Insights and Forecast, 2020-2032
- 8.1. Market Analysis, Insights and Forecast - by Application
- 8.1.1. Food and Beverage
- 8.1.2. Agriculture
- 8.1.3. Others
- 8.2. Market Analysis, Insights and Forecast - by Types
- 8.2.1. FRP
- 8.2.2. Steel
- 8.1. Market Analysis, Insights and Forecast - by Application
- 9. Middle East & Africa Salt Silos Analysis, Insights and Forecast, 2020-2032
- 9.1. Market Analysis, Insights and Forecast - by Application
- 9.1.1. Food and Beverage
- 9.1.2. Agriculture
- 9.1.3. Others
- 9.2. Market Analysis, Insights and Forecast - by Types
- 9.2.1. FRP
- 9.2.2. Steel
- 9.1. Market Analysis, Insights and Forecast - by Application
- 10. Asia Pacific Salt Silos Analysis, Insights and Forecast, 2020-2032
- 10.1. Market Analysis, Insights and Forecast - by Application
- 10.1.1. Food and Beverage
- 10.1.2. Agriculture
- 10.1.3. Others
- 10.2. Market Analysis, Insights and Forecast - by Types
- 10.2.1. FRP
- 10.2.2. Steel
- 10.1. Market Analysis, Insights and Forecast - by Application
- 11. Competitive Analysis
- 11.1. Global Market Share Analysis 2025
- 11.2. Company Profiles
- 11.2.1 Brinkmann Technology
- 11.2.1.1. Overview
- 11.2.1.2. Products
- 11.2.1.3. SWOT Analysis
- 11.2.1.4. Recent Developments
- 11.2.1.5. Financials (Based on Availability)
- 11.2.2 Scan-Plast
- 11.2.2.1. Overview
- 11.2.2.2. Products
- 11.2.2.3. SWOT Analysis
- 11.2.2.4. Recent Developments
- 11.2.2.5. Financials (Based on Availability)
- 11.2.3 M.I.P. Tanks & Silos
- 11.2.3.1. Overview
- 11.2.3.2. Products
- 11.2.3.3. SWOT Analysis
- 11.2.3.4. Recent Developments
- 11.2.3.5. Financials (Based on Availability)
- 11.2.4 HOLTEN GmbH
- 11.2.4.1. Overview
- 11.2.4.2. Products
- 11.2.4.3. SWOT Analysis
- 11.2.4.4. Recent Developments
- 11.2.4.5. Financials (Based on Availability)
- 11.2.5 Tunetanken
- 11.2.5.1. Overview
- 11.2.5.2. Products
- 11.2.5.3. SWOT Analysis
- 11.2.5.4. Recent Developments
- 11.2.5.5. Financials (Based on Availability)
- 11.2.6 Polem BV
- 11.2.6.1. Overview
- 11.2.6.2. Products
- 11.2.6.3. SWOT Analysis
- 11.2.6.4. Recent Developments
- 11.2.6.5. Financials (Based on Availability)
- 11.2.7 Blumer Lehmann
- 11.2.7.1. Overview
- 11.2.7.2. Products
- 11.2.7.3. SWOT Analysis
- 11.2.7.4. Recent Developments
- 11.2.7.5. Financials (Based on Availability)
- 11.2.1 Brinkmann Technology
List of Figures
- Figure 1: Global Salt Silos Revenue Breakdown (million, %) by Region 2025 & 2033
- Figure 2: Global Salt Silos Volume Breakdown (K, %) by Region 2025 & 2033
- Figure 3: North America Salt Silos Revenue (million), by Application 2025 & 2033
- Figure 4: North America Salt Silos Volume (K), by Application 2025 & 2033
- Figure 5: North America Salt Silos Revenue Share (%), by Application 2025 & 2033
- Figure 6: North America Salt Silos Volume Share (%), by Application 2025 & 2033
- Figure 7: North America Salt Silos Revenue (million), by Types 2025 & 2033
- Figure 8: North America Salt Silos Volume (K), by Types 2025 & 2033
- Figure 9: North America Salt Silos Revenue Share (%), by Types 2025 & 2033
- Figure 10: North America Salt Silos Volume Share (%), by Types 2025 & 2033
- Figure 11: North America Salt Silos Revenue (million), by Country 2025 & 2033
- Figure 12: North America Salt Silos Volume (K), by Country 2025 & 2033
- Figure 13: North America Salt Silos Revenue Share (%), by Country 2025 & 2033
- Figure 14: North America Salt Silos Volume Share (%), by Country 2025 & 2033
- Figure 15: South America Salt Silos Revenue (million), by Application 2025 & 2033
- Figure 16: South America Salt Silos Volume (K), by Application 2025 & 2033
- Figure 17: South America Salt Silos Revenue Share (%), by Application 2025 & 2033
- Figure 18: South America Salt Silos Volume Share (%), by Application 2025 & 2033
- Figure 19: South America Salt Silos Revenue (million), by Types 2025 & 2033
- Figure 20: South America Salt Silos Volume (K), by Types 2025 & 2033
- Figure 21: South America Salt Silos Revenue Share (%), by Types 2025 & 2033
- Figure 22: South America Salt Silos Volume Share (%), by Types 2025 & 2033
- Figure 23: South America Salt Silos Revenue (million), by Country 2025 & 2033
- Figure 24: South America Salt Silos Volume (K), by Country 2025 & 2033
- Figure 25: South America Salt Silos Revenue Share (%), by Country 2025 & 2033
- Figure 26: South America Salt Silos Volume Share (%), by Country 2025 & 2033
- Figure 27: Europe Salt Silos Revenue (million), by Application 2025 & 2033
- Figure 28: Europe Salt Silos Volume (K), by Application 2025 & 2033
- Figure 29: Europe Salt Silos Revenue Share (%), by Application 2025 & 2033
- Figure 30: Europe Salt Silos Volume Share (%), by Application 2025 & 2033
- Figure 31: Europe Salt Silos Revenue (million), by Types 2025 & 2033
- Figure 32: Europe Salt Silos Volume (K), by Types 2025 & 2033
- Figure 33: Europe Salt Silos Revenue Share (%), by Types 2025 & 2033
- Figure 34: Europe Salt Silos Volume Share (%), by Types 2025 & 2033
- Figure 35: Europe Salt Silos Revenue (million), by Country 2025 & 2033
- Figure 36: Europe Salt Silos Volume (K), by Country 2025 & 2033
- Figure 37: Europe Salt Silos Revenue Share (%), by Country 2025 & 2033
- Figure 38: Europe Salt Silos Volume Share (%), by Country 2025 & 2033
- Figure 39: Middle East & Africa Salt Silos Revenue (million), by Application 2025 & 2033
- Figure 40: Middle East & Africa Salt Silos Volume (K), by Application 2025 & 2033
- Figure 41: Middle East & Africa Salt Silos Revenue Share (%), by Application 2025 & 2033
- Figure 42: Middle East & Africa Salt Silos Volume Share (%), by Application 2025 & 2033
- Figure 43: Middle East & Africa Salt Silos Revenue (million), by Types 2025 & 2033
- Figure 44: Middle East & Africa Salt Silos Volume (K), by Types 2025 & 2033
- Figure 45: Middle East & Africa Salt Silos Revenue Share (%), by Types 2025 & 2033
- Figure 46: Middle East & Africa Salt Silos Volume Share (%), by Types 2025 & 2033
- Figure 47: Middle East & Africa Salt Silos Revenue (million), by Country 2025 & 2033
- Figure 48: Middle East & Africa Salt Silos Volume (K), by Country 2025 & 2033
- Figure 49: Middle East & Africa Salt Silos Revenue Share (%), by Country 2025 & 2033
- Figure 50: Middle East & Africa Salt Silos Volume Share (%), by Country 2025 & 2033
- Figure 51: Asia Pacific Salt Silos Revenue (million), by Application 2025 & 2033
- Figure 52: Asia Pacific Salt Silos Volume (K), by Application 2025 & 2033
- Figure 53: Asia Pacific Salt Silos Revenue Share (%), by Application 2025 & 2033
- Figure 54: Asia Pacific Salt Silos Volume Share (%), by Application 2025 & 2033
- Figure 55: Asia Pacific Salt Silos Revenue (million), by Types 2025 & 2033
- Figure 56: Asia Pacific Salt Silos Volume (K), by Types 2025 & 2033
- Figure 57: Asia Pacific Salt Silos Revenue Share (%), by Types 2025 & 2033
- Figure 58: Asia Pacific Salt Silos Volume Share (%), by Types 2025 & 2033
- Figure 59: Asia Pacific Salt Silos Revenue (million), by Country 2025 & 2033
- Figure 60: Asia Pacific Salt Silos Volume (K), by Country 2025 & 2033
- Figure 61: Asia Pacific Salt Silos Revenue Share (%), by Country 2025 & 2033
- Figure 62: Asia Pacific Salt Silos Volume Share (%), by Country 2025 & 2033
List of Tables
- Table 1: Global Salt Silos Revenue million Forecast, by Application 2020 & 2033
- Table 2: Global Salt Silos Volume K Forecast, by Application 2020 & 2033
- Table 3: Global Salt Silos Revenue million Forecast, by Types 2020 & 2033
- Table 4: Global Salt Silos Volume K Forecast, by Types 2020 & 2033
- Table 5: Global Salt Silos Revenue million Forecast, by Region 2020 & 2033
- Table 6: Global Salt Silos Volume K Forecast, by Region 2020 & 2033
- Table 7: Global Salt Silos Revenue million Forecast, by Application 2020 & 2033
- Table 8: Global Salt Silos Volume K Forecast, by Application 2020 & 2033
- Table 9: Global Salt Silos Revenue million Forecast, by Types 2020 & 2033
- Table 10: Global Salt Silos Volume K Forecast, by Types 2020 & 2033
- Table 11: Global Salt Silos Revenue million Forecast, by Country 2020 & 2033
- Table 12: Global Salt Silos Volume K Forecast, by Country 2020 & 2033
- Table 13: United States Salt Silos Revenue (million) Forecast, by Application 2020 & 2033
- Table 14: United States Salt Silos Volume (K) Forecast, by Application 2020 & 2033
- Table 15: Canada Salt Silos Revenue (million) Forecast, by Application 2020 & 2033
- Table 16: Canada Salt Silos Volume (K) Forecast, by Application 2020 & 2033
- Table 17: Mexico Salt Silos Revenue (million) Forecast, by Application 2020 & 2033
- Table 18: Mexico Salt Silos Volume (K) Forecast, by Application 2020 & 2033
- Table 19: Global Salt Silos Revenue million Forecast, by Application 2020 & 2033
- Table 20: Global Salt Silos Volume K Forecast, by Application 2020 & 2033
- Table 21: Global Salt Silos Revenue million Forecast, by Types 2020 & 2033
- Table 22: Global Salt Silos Volume K Forecast, by Types 2020 & 2033
- Table 23: Global Salt Silos Revenue million Forecast, by Country 2020 & 2033
- Table 24: Global Salt Silos Volume K Forecast, by Country 2020 & 2033
- Table 25: Brazil Salt Silos Revenue (million) Forecast, by Application 2020 & 2033
- Table 26: Brazil Salt Silos Volume (K) Forecast, by Application 2020 & 2033
- Table 27: Argentina Salt Silos Revenue (million) Forecast, by Application 2020 & 2033
- Table 28: Argentina Salt Silos Volume (K) Forecast, by Application 2020 & 2033
- Table 29: Rest of South America Salt Silos Revenue (million) Forecast, by Application 2020 & 2033
- Table 30: Rest of South America Salt Silos Volume (K) Forecast, by Application 2020 & 2033
- Table 31: Global Salt Silos Revenue million Forecast, by Application 2020 & 2033
- Table 32: Global Salt Silos Volume K Forecast, by Application 2020 & 2033
- Table 33: Global Salt Silos Revenue million Forecast, by Types 2020 & 2033
- Table 34: Global Salt Silos Volume K Forecast, by Types 2020 & 2033
- Table 35: Global Salt Silos Revenue million Forecast, by Country 2020 & 2033
- Table 36: Global Salt Silos Volume K Forecast, by Country 2020 & 2033
- Table 37: United Kingdom Salt Silos Revenue (million) Forecast, by Application 2020 & 2033
- Table 38: United Kingdom Salt Silos Volume (K) Forecast, by Application 2020 & 2033
- Table 39: Germany Salt Silos Revenue (million) Forecast, by Application 2020 & 2033
- Table 40: Germany Salt Silos Volume (K) Forecast, by Application 2020 & 2033
- Table 41: France Salt Silos Revenue (million) Forecast, by Application 2020 & 2033
- Table 42: France Salt Silos Volume (K) Forecast, by Application 2020 & 2033
- Table 43: Italy Salt Silos Revenue (million) Forecast, by Application 2020 & 2033
- Table 44: Italy Salt Silos Volume (K) Forecast, by Application 2020 & 2033
- Table 45: Spain Salt Silos Revenue (million) Forecast, by Application 2020 & 2033
- Table 46: Spain Salt Silos Volume (K) Forecast, by Application 2020 & 2033
- Table 47: Russia Salt Silos Revenue (million) Forecast, by Application 2020 & 2033
- Table 48: Russia Salt Silos Volume (K) Forecast, by Application 2020 & 2033
- Table 49: Benelux Salt Silos Revenue (million) Forecast, by Application 2020 & 2033
- Table 50: Benelux Salt Silos Volume (K) Forecast, by Application 2020 & 2033
- Table 51: Nordics Salt Silos Revenue (million) Forecast, by Application 2020 & 2033
- Table 52: Nordics Salt Silos Volume (K) Forecast, by Application 2020 & 2033
- Table 53: Rest of Europe Salt Silos Revenue (million) Forecast, by Application 2020 & 2033
- Table 54: Rest of Europe Salt Silos Volume (K) Forecast, by Application 2020 & 2033
- Table 55: Global Salt Silos Revenue million Forecast, by Application 2020 & 2033
- Table 56: Global Salt Silos Volume K Forecast, by Application 2020 & 2033
- Table 57: Global Salt Silos Revenue million Forecast, by Types 2020 & 2033
- Table 58: Global Salt Silos Volume K Forecast, by Types 2020 & 2033
- Table 59: Global Salt Silos Revenue million Forecast, by Country 2020 & 2033
- Table 60: Global Salt Silos Volume K Forecast, by Country 2020 & 2033
- Table 61: Turkey Salt Silos Revenue (million) Forecast, by Application 2020 & 2033
- Table 62: Turkey Salt Silos Volume (K) Forecast, by Application 2020 & 2033
- Table 63: Israel Salt Silos Revenue (million) Forecast, by Application 2020 & 2033
- Table 64: Israel Salt Silos Volume (K) Forecast, by Application 2020 & 2033
- Table 65: GCC Salt Silos Revenue (million) Forecast, by Application 2020 & 2033
- Table 66: GCC Salt Silos Volume (K) Forecast, by Application 2020 & 2033
- Table 67: North Africa Salt Silos Revenue (million) Forecast, by Application 2020 & 2033
- Table 68: North Africa Salt Silos Volume (K) Forecast, by Application 2020 & 2033
- Table 69: South Africa Salt Silos Revenue (million) Forecast, by Application 2020 & 2033
- Table 70: South Africa Salt Silos Volume (K) Forecast, by Application 2020 & 2033
- Table 71: Rest of Middle East & Africa Salt Silos Revenue (million) Forecast, by Application 2020 & 2033
- Table 72: Rest of Middle East & Africa Salt Silos Volume (K) Forecast, by Application 2020 & 2033
- Table 73: Global Salt Silos Revenue million Forecast, by Application 2020 & 2033
- Table 74: Global Salt Silos Volume K Forecast, by Application 2020 & 2033
- Table 75: Global Salt Silos Revenue million Forecast, by Types 2020 & 2033
- Table 76: Global Salt Silos Volume K Forecast, by Types 2020 & 2033
- Table 77: Global Salt Silos Revenue million Forecast, by Country 2020 & 2033
- Table 78: Global Salt Silos Volume K Forecast, by Country 2020 & 2033
- Table 79: China Salt Silos Revenue (million) Forecast, by Application 2020 & 2033
- Table 80: China Salt Silos Volume (K) Forecast, by Application 2020 & 2033
- Table 81: India Salt Silos Revenue (million) Forecast, by Application 2020 & 2033
- Table 82: India Salt Silos Volume (K) Forecast, by Application 2020 & 2033
- Table 83: Japan Salt Silos Revenue (million) Forecast, by Application 2020 & 2033
- Table 84: Japan Salt Silos Volume (K) Forecast, by Application 2020 & 2033
- Table 85: South Korea Salt Silos Revenue (million) Forecast, by Application 2020 & 2033
- Table 86: South Korea Salt Silos Volume (K) Forecast, by Application 2020 & 2033
- Table 87: ASEAN Salt Silos Revenue (million) Forecast, by Application 2020 & 2033
- Table 88: ASEAN Salt Silos Volume (K) Forecast, by Application 2020 & 2033
- Table 89: Oceania Salt Silos Revenue (million) Forecast, by Application 2020 & 2033
- Table 90: Oceania Salt Silos Volume (K) Forecast, by Application 2020 & 2033
- Table 91: Rest of Asia Pacific Salt Silos Revenue (million) Forecast, by Application 2020 & 2033
- Table 92: Rest of Asia Pacific Salt Silos Volume (K) Forecast, by Application 2020 & 2033
Frequently Asked Questions
1. What is the projected Compound Annual Growth Rate (CAGR) of the Salt Silos?
The projected CAGR is approximately 2.7%.
2. Which companies are prominent players in the Salt Silos?
Key companies in the market include Brinkmann Technology, Scan-Plast, M.I.P. Tanks & Silos, HOLTEN GmbH, Tunetanken, Polem BV, Blumer Lehmann.
3. What are the main segments of the Salt Silos?
The market segments include Application, Types.
4. Can you provide details about the market size?
The market size is estimated to be USD 99 million as of 2022.
5. What are some drivers contributing to market growth?
N/A
6. What are the notable trends driving market growth?
N/A
7. Are there any restraints impacting market growth?
N/A
8. Can you provide examples of recent developments in the market?
N/A
9. What pricing options are available for accessing the report?
Pricing options include single-user, multi-user, and enterprise licenses priced at USD 4350.00, USD 6525.00, and USD 8700.00 respectively.
10. Is the market size provided in terms of value or volume?
The market size is provided in terms of value, measured in million and volume, measured in K.
11. Are there any specific market keywords associated with the report?
Yes, the market keyword associated with the report is "Salt Silos," which aids in identifying and referencing the specific market segment covered.
12. How do I determine which pricing option suits my needs best?
The pricing options vary based on user requirements and access needs. Individual users may opt for single-user licenses, while businesses requiring broader access may choose multi-user or enterprise licenses for cost-effective access to the report.
13. Are there any additional resources or data provided in the Salt Silos report?
While the report offers comprehensive insights, it's advisable to review the specific contents or supplementary materials provided to ascertain if additional resources or data are available.
14. How can I stay updated on further developments or reports in the Salt Silos?
To stay informed about further developments, trends, and reports in the Salt Silos, consider subscribing to industry newsletters, following relevant companies and organizations, or regularly checking reputable industry news sources and publications.
Methodology
Step 1 - Identification of Relevant Samples Size from Population Database


Step 2 - Approaches for Defining Global Market Size (Value, Volume* & Price*)

Note*: In applicable scenarios
Step 3 - Data Sources
Primary Research
- Web Analytics
- Survey Reports
- Research Institute
- Latest Research Reports
- Opinion Leaders
Secondary Research
- Annual Reports
- White Paper
- Latest Press Release
- Industry Association
- Paid Database
- Investor Presentations

Step 4 - Data Triangulation
Involves using different sources of information in order to increase the validity of a study
These sources are likely to be stakeholders in a program - participants, other researchers, program staff, other community members, and so on.
Then we put all data in single framework & apply various statistical tools to find out the dynamic on the market.
During the analysis stage, feedback from the stakeholder groups would be compared to determine areas of agreement as well as areas of divergence