

Key Insights
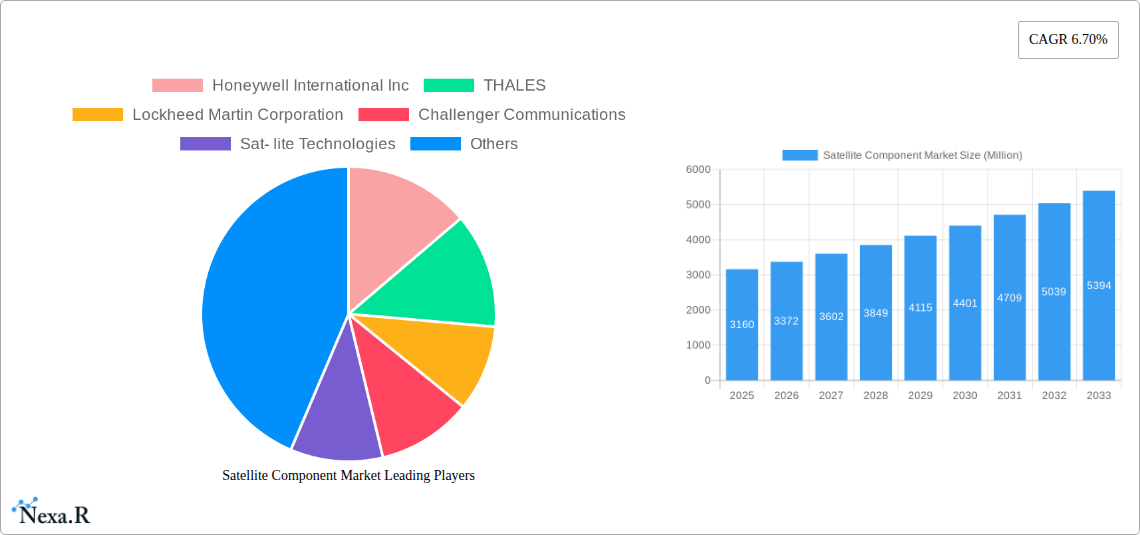
The global satellite component market, valued at $3.16 billion in 2025, is projected to experience robust growth, driven by increasing demand for satellite-based communication and navigation services, the expansion of the New Space movement with numerous private companies launching satellites, and the growing adoption of advanced technologies like miniaturization and improved power efficiency in satellite components. Key components such as antennas, power systems, and propulsion systems are experiencing significant growth, fueled by the increasing complexity and capabilities of modern satellites. The market is segmented by component type, with antennas, power systems, and propulsion systems representing the largest market share due to their critical role in satellite functionality. Government investments in space exploration and defense applications further contribute to market expansion. Competitive pressures among established players like Honeywell International Inc., Thales, and Lockheed Martin Corporation, alongside the emergence of innovative smaller companies, fosters technological advancements and price competitiveness.
However, challenges such as the high cost of satellite development and launch, stringent regulatory requirements, and potential supply chain disruptions pose limitations to market growth. Despite these restraints, the long-term outlook for the satellite component market remains positive, with the increasing adoption of satellite internet services, particularly in underserved regions, and the development of Low Earth Orbit (LEO) megaconstellations driving significant future demand. The Asia-Pacific region is expected to demonstrate the highest growth rate due to increased government spending on space infrastructure and rising demand for communication and navigation solutions. Technological advancements, including the development of more efficient and reliable components, will continue to shape market dynamics in the forecast period (2025-2033).
Satellite Component Market: A Comprehensive Report (2019-2033)
This in-depth report provides a comprehensive analysis of the Satellite Component Market, encompassing market dynamics, growth trends, regional dominance, product landscape, challenges, opportunities, and key players. The study period spans from 2019 to 2033, with 2025 serving as the base and estimated year. The forecast period covers 2025-2033, and the historical period encompasses 2019-2024. This report is essential for industry professionals, investors, and stakeholders seeking a detailed understanding of this rapidly evolving market. The market is segmented by component type: Antennas, Power Systems, Propulsion Systems, Transponders, and Other Components.
Satellite Component Market Market Dynamics & Structure
The satellite component market is characterized by a moderately concentrated structure, with key players like Honeywell International Inc, Thales, Lockheed Martin Corporation, and Northrop Grumman Corporation holding significant market share (estimated at xx% collectively in 2025). Technological innovation, particularly in miniaturization, increased efficiency, and advanced materials, is a primary growth driver. Stringent regulatory frameworks governing satellite launches and operations influence market dynamics, while the emergence of cost-effective alternatives, such as terrestrial communication systems, poses a competitive threat. The market is influenced by the growing demand from various end-users, including telecommunications, government & defense, and scientific research. M&A activities are relatively frequent, reflecting the strategic importance of acquiring specialized technologies and expanding market reach. In the period 2019-2024, an estimated xx M&A deals were recorded, with an average deal size of xx million units.
- Market Concentration: Moderately concentrated, with top players holding xx% market share in 2025.
- Technological Innovation: Miniaturization, enhanced efficiency, and advanced materials are key drivers.
- Regulatory Framework: Stringent regulations impact market access and operations.
- Competitive Substitutes: Terrestrial communication systems present competitive pressure.
- End-User Demographics: Growing demand from telecommunications, government, and scientific research sectors.
- M&A Trends: xx M&A deals recorded between 2019-2024, indicating significant consolidation.
- Innovation Barriers: High R&D costs and long lead times for new component development.
Satellite Component Market Growth Trends & Insights
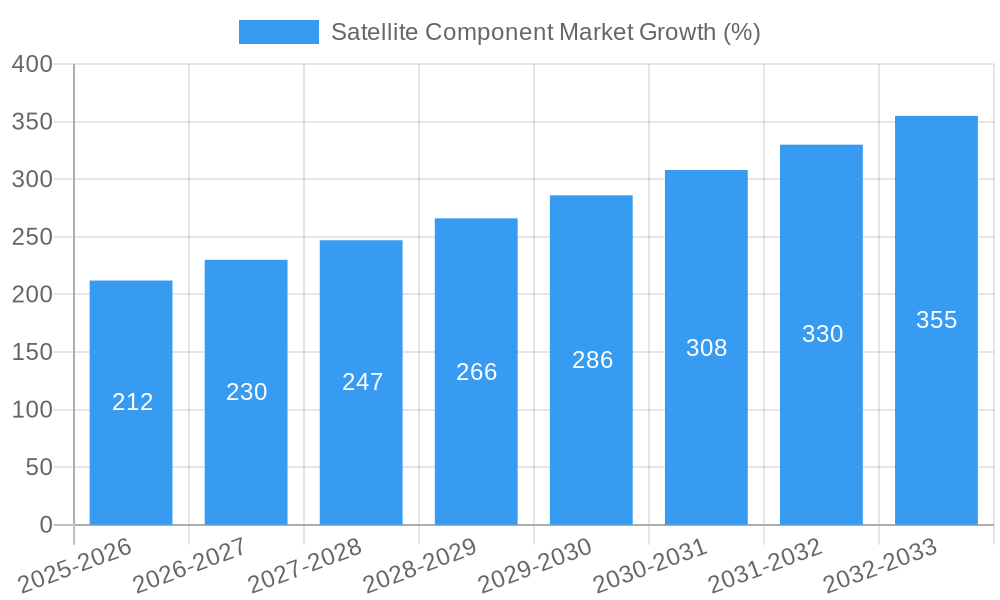
The global satellite component market experienced significant growth during the historical period (2019-2024), expanding from xx million units in 2019 to xx million units in 2024, representing a CAGR of xx%. This growth is driven by increasing demand for high-bandwidth communication, navigation, and earth observation applications, coupled with advancements in satellite technology. The market is projected to continue its expansion throughout the forecast period (2025-2033), reaching xx million units by 2033, fueled by the rising adoption of smallsat constellations, the expansion of IoT applications requiring satellite connectivity, and government initiatives promoting space exploration. Market penetration remains relatively low in emerging economies, presenting significant untapped potential. Technological disruptions, such as the development of software-defined radios and advanced antenna technologies, are poised to reshape the market landscape, driving further growth and innovation. Consumer behavior shifts towards increased reliance on satellite-based services further solidify this trend.
- Market Size (2019): xx million units
- Market Size (2024): xx million units
- Projected Market Size (2033): xx million units
- CAGR (2019-2024): xx%
- CAGR (2025-2033): xx%
- Market Penetration: xx% in developed regions, xx% in developing regions (2025).
Dominant Regions, Countries, or Segments in Satellite Component Market
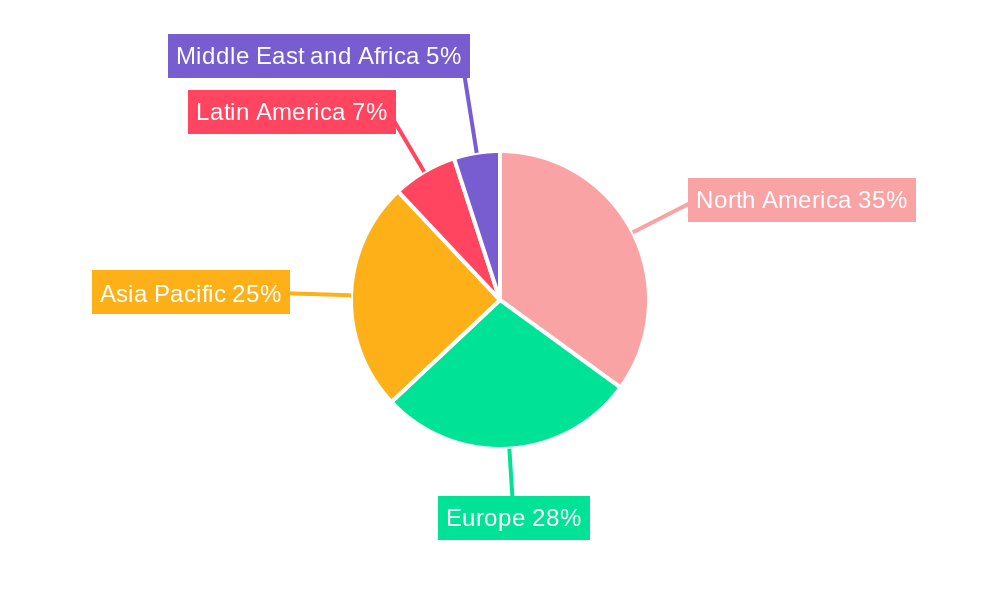
North America currently holds the largest market share in the satellite component market, driven by strong government investment in space programs, a well-established aerospace industry, and the presence of major component manufacturers. Within the segment breakdown, the Antennas segment dominates, accounting for approximately xx% of the overall market in 2025 due to high demand for advanced communication and earth observation technologies. Europe follows closely, exhibiting strong growth potential in the Propulsion Systems segment due to advancements in electric propulsion technology and increased focus on small satellite launches. Asia-Pacific shows promising growth, particularly in the Transponders segment, driven by increasing demand for satellite-based communication and broadcasting services.
- North America: Dominates the market due to strong government investment and established aerospace industry. Key drivers include robust R&D spending and strong demand for high-performance components.
- Europe: Significant growth potential, especially in the Propulsion Systems segment due to advancements in electric propulsion.
- Asia-Pacific: High growth potential, driven primarily by the demand for communication and broadcasting services in the Transponders segment.
- Antennas Segment: Largest segment in 2025, driven by demand for advanced communication technologies.
- Propulsion Systems Segment: Strong growth potential, fueled by electric propulsion advancements.
- Transponders Segment: Significant growth in the Asia-Pacific region, driven by the rise of satellite communication and broadcasting.
Satellite Component Market Product Landscape
The satellite component market exhibits a wide range of products, from traditional RF components to advanced, miniaturized, and highly efficient systems. Innovations include the development of lightweight and compact antennas, more powerful and energy-efficient power systems, improved propulsion systems enabling precise orbit control, and high-throughput transponders enabling increased data transmission capacity. These advancements improve satellite performance, reduce launch costs, and expand the range of applications. Unique selling propositions for various components focus on factors such as reliability, weight, power efficiency, and data throughput. The industry is constantly pushing the boundaries of technology to meet the growing demands for higher performance and cost-effectiveness.
Key Drivers, Barriers & Challenges in Satellite Component Market
Key Drivers:
- Increasing demand for satellite-based communication services.
- Growing adoption of small satellites and constellations.
- Advancements in component technologies (miniaturization, efficiency improvements).
- Government investments in space exploration and defense programs.
Key Challenges:
- High R&D costs and long lead times for new component development.
- Supply chain disruptions and component shortages (estimated impact on 2025 market growth: xx%).
- Stringent regulatory compliance requirements.
- Intense competition from established players.
Emerging Opportunities in Satellite Component Market
- Development of advanced materials for lighter and more robust components.
- Expansion into new markets, such as the Internet of Things (IoT).
- Growing demand for high-throughput satellite communication for applications like broadband access and remote sensing.
- Increased adoption of electric propulsion technologies for cost-effective satellite operation.
Growth Accelerators in the Satellite Component Market Industry
Technological breakthroughs in areas like software-defined radios, advanced antenna technologies, and energy-efficient power systems are key growth accelerators. Strategic partnerships between component manufacturers and satellite operators are enabling faster innovation and wider adoption of new technologies. Expansion into new and emerging markets, fueled by the growing demand for satellite-based services in various sectors, further accelerates market growth.
Key Players Shaping the Satellite Component Market Market
- Honeywell International Inc
- THALES
- Lockheed Martin Corporation
- Challenger Communications
- Sat-lite Technologies
- Accion System
- JONSA TECHNOLOGIES CO LTD
- BAE Systems plc
- IHI Corporation
- Northrop Grumman Corporation
- Viking Satcom
Notable Milestones in Satellite Component Market Sector
- 2022 Q4: Honeywell International Inc. launched a new generation of high-efficiency power systems for small satellites.
- 2023 Q1: Thales and Lockheed Martin announced a strategic partnership to develop advanced antenna technologies.
- 2024 Q3: Successful launch of a new satellite constellation utilizing miniaturized components developed by several companies. (Specific company details unavailable).
In-Depth Satellite Component Market Market Outlook
The satellite component market is poised for sustained growth, driven by continued technological advancements, increasing demand for satellite-based services, and expansion into new markets. Strategic partnerships and investments in R&D will play a crucial role in shaping the future market landscape. The potential for significant growth in emerging economies and the development of innovative applications represent compelling opportunities for market players. The focus on miniaturization, efficiency, and cost-effectiveness will remain key factors in determining market success over the next decade.
Satellite Component Market Segmentation
- 1. Production Analysis
- 2. Consumption Analysis
- 3. Import Market Analysis (Value & Volume)
- 4. Export Market Analysis (Value & Volume)
- 5. Price Trend Analysis
Satellite Component Market Segmentation By Geography
-
1. North America
- 1.1. United States
- 1.2. Canada
- 1.3. Mexico
-
2. South America
- 2.1. Brazil
- 2.2. Argentina
- 2.3. Rest of South America
-
3. Europe
- 3.1. United Kingdom
- 3.2. Germany
- 3.3. France
- 3.4. Italy
- 3.5. Spain
- 3.6. Russia
- 3.7. Benelux
- 3.8. Nordics
- 3.9. Rest of Europe
-
4. Middle East & Africa
- 4.1. Turkey
- 4.2. Israel
- 4.3. GCC
- 4.4. North Africa
- 4.5. South Africa
- 4.6. Rest of Middle East & Africa
-
5. Asia Pacific
- 5.1. China
- 5.2. India
- 5.3. Japan
- 5.4. South Korea
- 5.5. ASEAN
- 5.6. Oceania
- 5.7. Rest of Asia Pacific
Satellite Component Market REPORT HIGHLIGHTS
| Aspects | Details |
|---|---|
| Study Period | 2019-2033 |
| Base Year | 2024 |
| Estimated Year | 2025 |
| Forecast Period | 2025-2033 |
| Historical Period | 2019-2024 |
| Growth Rate | CAGR of 6.70% from 2019-2033 |
| Segmentation |
|
Table of Contents
- 1. Introduction
- 1.1. Research Scope
- 1.2. Market Segmentation
- 1.3. Research Methodology
- 1.4. Definitions and Assumptions
- 2. Executive Summary
- 2.1. Introduction
- 3. Market Dynamics
- 3.1. Introduction
- 3.2. Market Drivers
- 3.2.1. Increase in Internet of Things (IoT) and Autonomous Systems; Rise in Demand for Military and Defense Satellite Communication Solutions
- 3.3. Market Restrains
- 3.3.1. Cybersecurity Threats to Satellite Communication; Interference in Transmission of Data
- 3.4. Market Trends
- 3.4.1. The Antenna Segment is Expected to Show Remarkable Growth During the Forecast Period
- 4. Market Factor Analysis
- 4.1. Porters Five Forces
- 4.2. Supply/Value Chain
- 4.3. PESTEL analysis
- 4.4. Market Entropy
- 4.5. Patent/Trademark Analysis
- 5. Global Satellite Component Market Analysis, Insights and Forecast, 2019-2031
- 5.1. Market Analysis, Insights and Forecast - by Production Analysis
- 5.2. Market Analysis, Insights and Forecast - by Consumption Analysis
- 5.3. Market Analysis, Insights and Forecast - by Import Market Analysis (Value & Volume)
- 5.4. Market Analysis, Insights and Forecast - by Export Market Analysis (Value & Volume)
- 5.5. Market Analysis, Insights and Forecast - by Price Trend Analysis
- 5.6. Market Analysis, Insights and Forecast - by Region
- 5.6.1. North America
- 5.6.2. South America
- 5.6.3. Europe
- 5.6.4. Middle East & Africa
- 5.6.5. Asia Pacific
- 5.1. Market Analysis, Insights and Forecast - by Production Analysis
- 6. North America Satellite Component Market Analysis, Insights and Forecast, 2019-2031
- 6.1. Market Analysis, Insights and Forecast - by Production Analysis
- 6.2. Market Analysis, Insights and Forecast - by Consumption Analysis
- 6.3. Market Analysis, Insights and Forecast - by Import Market Analysis (Value & Volume)
- 6.4. Market Analysis, Insights and Forecast - by Export Market Analysis (Value & Volume)
- 6.5. Market Analysis, Insights and Forecast - by Price Trend Analysis
- 6.1. Market Analysis, Insights and Forecast - by Production Analysis
- 7. South America Satellite Component Market Analysis, Insights and Forecast, 2019-2031
- 7.1. Market Analysis, Insights and Forecast - by Production Analysis
- 7.2. Market Analysis, Insights and Forecast - by Consumption Analysis
- 7.3. Market Analysis, Insights and Forecast - by Import Market Analysis (Value & Volume)
- 7.4. Market Analysis, Insights and Forecast - by Export Market Analysis (Value & Volume)
- 7.5. Market Analysis, Insights and Forecast - by Price Trend Analysis
- 7.1. Market Analysis, Insights and Forecast - by Production Analysis
- 8. Europe Satellite Component Market Analysis, Insights and Forecast, 2019-2031
- 8.1. Market Analysis, Insights and Forecast - by Production Analysis
- 8.2. Market Analysis, Insights and Forecast - by Consumption Analysis
- 8.3. Market Analysis, Insights and Forecast - by Import Market Analysis (Value & Volume)
- 8.4. Market Analysis, Insights and Forecast - by Export Market Analysis (Value & Volume)
- 8.5. Market Analysis, Insights and Forecast - by Price Trend Analysis
- 8.1. Market Analysis, Insights and Forecast - by Production Analysis
- 9. Middle East & Africa Satellite Component Market Analysis, Insights and Forecast, 2019-2031
- 9.1. Market Analysis, Insights and Forecast - by Production Analysis
- 9.2. Market Analysis, Insights and Forecast - by Consumption Analysis
- 9.3. Market Analysis, Insights and Forecast - by Import Market Analysis (Value & Volume)
- 9.4. Market Analysis, Insights and Forecast - by Export Market Analysis (Value & Volume)
- 9.5. Market Analysis, Insights and Forecast - by Price Trend Analysis
- 9.1. Market Analysis, Insights and Forecast - by Production Analysis
- 10. Asia Pacific Satellite Component Market Analysis, Insights and Forecast, 2019-2031
- 10.1. Market Analysis, Insights and Forecast - by Production Analysis
- 10.2. Market Analysis, Insights and Forecast - by Consumption Analysis
- 10.3. Market Analysis, Insights and Forecast - by Import Market Analysis (Value & Volume)
- 10.4. Market Analysis, Insights and Forecast - by Export Market Analysis (Value & Volume)
- 10.5. Market Analysis, Insights and Forecast - by Price Trend Analysis
- 10.1. Market Analysis, Insights and Forecast - by Production Analysis
- 11. North America Satellite Component Market Analysis, Insights and Forecast, 2019-2031
- 11.1. Market Analysis, Insights and Forecast - By Country/Sub-region
- 11.1.1.
- 12. Europe Satellite Component Market Analysis, Insights and Forecast, 2019-2031
- 12.1. Market Analysis, Insights and Forecast - By Country/Sub-region
- 12.1.1.
- 13. Asia Pacific Satellite Component Market Analysis, Insights and Forecast, 2019-2031
- 13.1. Market Analysis, Insights and Forecast - By Country/Sub-region
- 13.1.1.
- 14. Latin America Satellite Component Market Analysis, Insights and Forecast, 2019-2031
- 14.1. Market Analysis, Insights and Forecast - By Country/Sub-region
- 14.1.1.
- 15. Middle East and Africa Satellite Component Market Analysis, Insights and Forecast, 2019-2031
- 15.1. Market Analysis, Insights and Forecast - By Country/Sub-region
- 15.1.1.
- 16. Competitive Analysis
- 16.1. Global Market Share Analysis 2024
- 16.2. Company Profiles
- 16.2.1 Honeywell International Inc
- 16.2.1.1. Overview
- 16.2.1.2. Products
- 16.2.1.3. SWOT Analysis
- 16.2.1.4. Recent Developments
- 16.2.1.5. Financials (Based on Availability)
- 16.2.2 THALES
- 16.2.2.1. Overview
- 16.2.2.2. Products
- 16.2.2.3. SWOT Analysis
- 16.2.2.4. Recent Developments
- 16.2.2.5. Financials (Based on Availability)
- 16.2.3 Lockheed Martin Corporation
- 16.2.3.1. Overview
- 16.2.3.2. Products
- 16.2.3.3. SWOT Analysis
- 16.2.3.4. Recent Developments
- 16.2.3.5. Financials (Based on Availability)
- 16.2.4 Challenger Communications
- 16.2.4.1. Overview
- 16.2.4.2. Products
- 16.2.4.3. SWOT Analysis
- 16.2.4.4. Recent Developments
- 16.2.4.5. Financials (Based on Availability)
- 16.2.5 Sat- lite Technologies
- 16.2.5.1. Overview
- 16.2.5.2. Products
- 16.2.5.3. SWOT Analysis
- 16.2.5.4. Recent Developments
- 16.2.5.5. Financials (Based on Availability)
- 16.2.6 Accion System
- 16.2.6.1. Overview
- 16.2.6.2. Products
- 16.2.6.3. SWOT Analysis
- 16.2.6.4. Recent Developments
- 16.2.6.5. Financials (Based on Availability)
- 16.2.7 JONSA TECHNOLOGIES CO LTD
- 16.2.7.1. Overview
- 16.2.7.2. Products
- 16.2.7.3. SWOT Analysis
- 16.2.7.4. Recent Developments
- 16.2.7.5. Financials (Based on Availability)
- 16.2.8 BAE Systems plc
- 16.2.8.1. Overview
- 16.2.8.2. Products
- 16.2.8.3. SWOT Analysis
- 16.2.8.4. Recent Developments
- 16.2.8.5. Financials (Based on Availability)
- 16.2.9 IHI Corporation
- 16.2.9.1. Overview
- 16.2.9.2. Products
- 16.2.9.3. SWOT Analysis
- 16.2.9.4. Recent Developments
- 16.2.9.5. Financials (Based on Availability)
- 16.2.10 Northrop Grumman Corporation
- 16.2.10.1. Overview
- 16.2.10.2. Products
- 16.2.10.3. SWOT Analysis
- 16.2.10.4. Recent Developments
- 16.2.10.5. Financials (Based on Availability)
- 16.2.11 Viking Satcom
- 16.2.11.1. Overview
- 16.2.11.2. Products
- 16.2.11.3. SWOT Analysis
- 16.2.11.4. Recent Developments
- 16.2.11.5. Financials (Based on Availability)
- 16.2.1 Honeywell International Inc
List of Figures
- Figure 1: Global Satellite Component Market Revenue Breakdown (Million, %) by Region 2024 & 2032
- Figure 2: North America Satellite Component Market Revenue (Million), by Country 2024 & 2032
- Figure 3: North America Satellite Component Market Revenue Share (%), by Country 2024 & 2032
- Figure 4: Europe Satellite Component Market Revenue (Million), by Country 2024 & 2032
- Figure 5: Europe Satellite Component Market Revenue Share (%), by Country 2024 & 2032
- Figure 6: Asia Pacific Satellite Component Market Revenue (Million), by Country 2024 & 2032
- Figure 7: Asia Pacific Satellite Component Market Revenue Share (%), by Country 2024 & 2032
- Figure 8: Latin America Satellite Component Market Revenue (Million), by Country 2024 & 2032
- Figure 9: Latin America Satellite Component Market Revenue Share (%), by Country 2024 & 2032
- Figure 10: Middle East and Africa Satellite Component Market Revenue (Million), by Country 2024 & 2032
- Figure 11: Middle East and Africa Satellite Component Market Revenue Share (%), by Country 2024 & 2032
- Figure 12: North America Satellite Component Market Revenue (Million), by Production Analysis 2024 & 2032
- Figure 13: North America Satellite Component Market Revenue Share (%), by Production Analysis 2024 & 2032
- Figure 14: North America Satellite Component Market Revenue (Million), by Consumption Analysis 2024 & 2032
- Figure 15: North America Satellite Component Market Revenue Share (%), by Consumption Analysis 2024 & 2032
- Figure 16: North America Satellite Component Market Revenue (Million), by Import Market Analysis (Value & Volume) 2024 & 2032
- Figure 17: North America Satellite Component Market Revenue Share (%), by Import Market Analysis (Value & Volume) 2024 & 2032
- Figure 18: North America Satellite Component Market Revenue (Million), by Export Market Analysis (Value & Volume) 2024 & 2032
- Figure 19: North America Satellite Component Market Revenue Share (%), by Export Market Analysis (Value & Volume) 2024 & 2032
- Figure 20: North America Satellite Component Market Revenue (Million), by Price Trend Analysis 2024 & 2032
- Figure 21: North America Satellite Component Market Revenue Share (%), by Price Trend Analysis 2024 & 2032
- Figure 22: North America Satellite Component Market Revenue (Million), by Country 2024 & 2032
- Figure 23: North America Satellite Component Market Revenue Share (%), by Country 2024 & 2032
- Figure 24: South America Satellite Component Market Revenue (Million), by Production Analysis 2024 & 2032
- Figure 25: South America Satellite Component Market Revenue Share (%), by Production Analysis 2024 & 2032
- Figure 26: South America Satellite Component Market Revenue (Million), by Consumption Analysis 2024 & 2032
- Figure 27: South America Satellite Component Market Revenue Share (%), by Consumption Analysis 2024 & 2032
- Figure 28: South America Satellite Component Market Revenue (Million), by Import Market Analysis (Value & Volume) 2024 & 2032
- Figure 29: South America Satellite Component Market Revenue Share (%), by Import Market Analysis (Value & Volume) 2024 & 2032
- Figure 30: South America Satellite Component Market Revenue (Million), by Export Market Analysis (Value & Volume) 2024 & 2032
- Figure 31: South America Satellite Component Market Revenue Share (%), by Export Market Analysis (Value & Volume) 2024 & 2032
- Figure 32: South America Satellite Component Market Revenue (Million), by Price Trend Analysis 2024 & 2032
- Figure 33: South America Satellite Component Market Revenue Share (%), by Price Trend Analysis 2024 & 2032
- Figure 34: South America Satellite Component Market Revenue (Million), by Country 2024 & 2032
- Figure 35: South America Satellite Component Market Revenue Share (%), by Country 2024 & 2032
- Figure 36: Europe Satellite Component Market Revenue (Million), by Production Analysis 2024 & 2032
- Figure 37: Europe Satellite Component Market Revenue Share (%), by Production Analysis 2024 & 2032
- Figure 38: Europe Satellite Component Market Revenue (Million), by Consumption Analysis 2024 & 2032
- Figure 39: Europe Satellite Component Market Revenue Share (%), by Consumption Analysis 2024 & 2032
- Figure 40: Europe Satellite Component Market Revenue (Million), by Import Market Analysis (Value & Volume) 2024 & 2032
- Figure 41: Europe Satellite Component Market Revenue Share (%), by Import Market Analysis (Value & Volume) 2024 & 2032
- Figure 42: Europe Satellite Component Market Revenue (Million), by Export Market Analysis (Value & Volume) 2024 & 2032
- Figure 43: Europe Satellite Component Market Revenue Share (%), by Export Market Analysis (Value & Volume) 2024 & 2032
- Figure 44: Europe Satellite Component Market Revenue (Million), by Price Trend Analysis 2024 & 2032
- Figure 45: Europe Satellite Component Market Revenue Share (%), by Price Trend Analysis 2024 & 2032
- Figure 46: Europe Satellite Component Market Revenue (Million), by Country 2024 & 2032
- Figure 47: Europe Satellite Component Market Revenue Share (%), by Country 2024 & 2032
- Figure 48: Middle East & Africa Satellite Component Market Revenue (Million), by Production Analysis 2024 & 2032
- Figure 49: Middle East & Africa Satellite Component Market Revenue Share (%), by Production Analysis 2024 & 2032
- Figure 50: Middle East & Africa Satellite Component Market Revenue (Million), by Consumption Analysis 2024 & 2032
- Figure 51: Middle East & Africa Satellite Component Market Revenue Share (%), by Consumption Analysis 2024 & 2032
- Figure 52: Middle East & Africa Satellite Component Market Revenue (Million), by Import Market Analysis (Value & Volume) 2024 & 2032
- Figure 53: Middle East & Africa Satellite Component Market Revenue Share (%), by Import Market Analysis (Value & Volume) 2024 & 2032
- Figure 54: Middle East & Africa Satellite Component Market Revenue (Million), by Export Market Analysis (Value & Volume) 2024 & 2032
- Figure 55: Middle East & Africa Satellite Component Market Revenue Share (%), by Export Market Analysis (Value & Volume) 2024 & 2032
- Figure 56: Middle East & Africa Satellite Component Market Revenue (Million), by Price Trend Analysis 2024 & 2032
- Figure 57: Middle East & Africa Satellite Component Market Revenue Share (%), by Price Trend Analysis 2024 & 2032
- Figure 58: Middle East & Africa Satellite Component Market Revenue (Million), by Country 2024 & 2032
- Figure 59: Middle East & Africa Satellite Component Market Revenue Share (%), by Country 2024 & 2032
- Figure 60: Asia Pacific Satellite Component Market Revenue (Million), by Production Analysis 2024 & 2032
- Figure 61: Asia Pacific Satellite Component Market Revenue Share (%), by Production Analysis 2024 & 2032
- Figure 62: Asia Pacific Satellite Component Market Revenue (Million), by Consumption Analysis 2024 & 2032
- Figure 63: Asia Pacific Satellite Component Market Revenue Share (%), by Consumption Analysis 2024 & 2032
- Figure 64: Asia Pacific Satellite Component Market Revenue (Million), by Import Market Analysis (Value & Volume) 2024 & 2032
- Figure 65: Asia Pacific Satellite Component Market Revenue Share (%), by Import Market Analysis (Value & Volume) 2024 & 2032
- Figure 66: Asia Pacific Satellite Component Market Revenue (Million), by Export Market Analysis (Value & Volume) 2024 & 2032
- Figure 67: Asia Pacific Satellite Component Market Revenue Share (%), by Export Market Analysis (Value & Volume) 2024 & 2032
- Figure 68: Asia Pacific Satellite Component Market Revenue (Million), by Price Trend Analysis 2024 & 2032
- Figure 69: Asia Pacific Satellite Component Market Revenue Share (%), by Price Trend Analysis 2024 & 2032
- Figure 70: Asia Pacific Satellite Component Market Revenue (Million), by Country 2024 & 2032
- Figure 71: Asia Pacific Satellite Component Market Revenue Share (%), by Country 2024 & 2032
List of Tables
- Table 1: Global Satellite Component Market Revenue Million Forecast, by Region 2019 & 2032
- Table 2: Global Satellite Component Market Revenue Million Forecast, by Production Analysis 2019 & 2032
- Table 3: Global Satellite Component Market Revenue Million Forecast, by Consumption Analysis 2019 & 2032
- Table 4: Global Satellite Component Market Revenue Million Forecast, by Import Market Analysis (Value & Volume) 2019 & 2032
- Table 5: Global Satellite Component Market Revenue Million Forecast, by Export Market Analysis (Value & Volume) 2019 & 2032
- Table 6: Global Satellite Component Market Revenue Million Forecast, by Price Trend Analysis 2019 & 2032
- Table 7: Global Satellite Component Market Revenue Million Forecast, by Region 2019 & 2032
- Table 8: Global Satellite Component Market Revenue Million Forecast, by Country 2019 & 2032
- Table 9: Satellite Component Market Revenue (Million) Forecast, by Application 2019 & 2032
- Table 10: Global Satellite Component Market Revenue Million Forecast, by Country 2019 & 2032
- Table 11: Satellite Component Market Revenue (Million) Forecast, by Application 2019 & 2032
- Table 12: Global Satellite Component Market Revenue Million Forecast, by Country 2019 & 2032
- Table 13: Satellite Component Market Revenue (Million) Forecast, by Application 2019 & 2032
- Table 14: Global Satellite Component Market Revenue Million Forecast, by Country 2019 & 2032
- Table 15: Satellite Component Market Revenue (Million) Forecast, by Application 2019 & 2032
- Table 16: Global Satellite Component Market Revenue Million Forecast, by Country 2019 & 2032
- Table 17: Satellite Component Market Revenue (Million) Forecast, by Application 2019 & 2032
- Table 18: Global Satellite Component Market Revenue Million Forecast, by Production Analysis 2019 & 2032
- Table 19: Global Satellite Component Market Revenue Million Forecast, by Consumption Analysis 2019 & 2032
- Table 20: Global Satellite Component Market Revenue Million Forecast, by Import Market Analysis (Value & Volume) 2019 & 2032
- Table 21: Global Satellite Component Market Revenue Million Forecast, by Export Market Analysis (Value & Volume) 2019 & 2032
- Table 22: Global Satellite Component Market Revenue Million Forecast, by Price Trend Analysis 2019 & 2032
- Table 23: Global Satellite Component Market Revenue Million Forecast, by Country 2019 & 2032
- Table 24: United States Satellite Component Market Revenue (Million) Forecast, by Application 2019 & 2032
- Table 25: Canada Satellite Component Market Revenue (Million) Forecast, by Application 2019 & 2032
- Table 26: Mexico Satellite Component Market Revenue (Million) Forecast, by Application 2019 & 2032
- Table 27: Global Satellite Component Market Revenue Million Forecast, by Production Analysis 2019 & 2032
- Table 28: Global Satellite Component Market Revenue Million Forecast, by Consumption Analysis 2019 & 2032
- Table 29: Global Satellite Component Market Revenue Million Forecast, by Import Market Analysis (Value & Volume) 2019 & 2032
- Table 30: Global Satellite Component Market Revenue Million Forecast, by Export Market Analysis (Value & Volume) 2019 & 2032
- Table 31: Global Satellite Component Market Revenue Million Forecast, by Price Trend Analysis 2019 & 2032
- Table 32: Global Satellite Component Market Revenue Million Forecast, by Country 2019 & 2032
- Table 33: Brazil Satellite Component Market Revenue (Million) Forecast, by Application 2019 & 2032
- Table 34: Argentina Satellite Component Market Revenue (Million) Forecast, by Application 2019 & 2032
- Table 35: Rest of South America Satellite Component Market Revenue (Million) Forecast, by Application 2019 & 2032
- Table 36: Global Satellite Component Market Revenue Million Forecast, by Production Analysis 2019 & 2032
- Table 37: Global Satellite Component Market Revenue Million Forecast, by Consumption Analysis 2019 & 2032
- Table 38: Global Satellite Component Market Revenue Million Forecast, by Import Market Analysis (Value & Volume) 2019 & 2032
- Table 39: Global Satellite Component Market Revenue Million Forecast, by Export Market Analysis (Value & Volume) 2019 & 2032
- Table 40: Global Satellite Component Market Revenue Million Forecast, by Price Trend Analysis 2019 & 2032
- Table 41: Global Satellite Component Market Revenue Million Forecast, by Country 2019 & 2032
- Table 42: United Kingdom Satellite Component Market Revenue (Million) Forecast, by Application 2019 & 2032
- Table 43: Germany Satellite Component Market Revenue (Million) Forecast, by Application 2019 & 2032
- Table 44: France Satellite Component Market Revenue (Million) Forecast, by Application 2019 & 2032
- Table 45: Italy Satellite Component Market Revenue (Million) Forecast, by Application 2019 & 2032
- Table 46: Spain Satellite Component Market Revenue (Million) Forecast, by Application 2019 & 2032
- Table 47: Russia Satellite Component Market Revenue (Million) Forecast, by Application 2019 & 2032
- Table 48: Benelux Satellite Component Market Revenue (Million) Forecast, by Application 2019 & 2032
- Table 49: Nordics Satellite Component Market Revenue (Million) Forecast, by Application 2019 & 2032
- Table 50: Rest of Europe Satellite Component Market Revenue (Million) Forecast, by Application 2019 & 2032
- Table 51: Global Satellite Component Market Revenue Million Forecast, by Production Analysis 2019 & 2032
- Table 52: Global Satellite Component Market Revenue Million Forecast, by Consumption Analysis 2019 & 2032
- Table 53: Global Satellite Component Market Revenue Million Forecast, by Import Market Analysis (Value & Volume) 2019 & 2032
- Table 54: Global Satellite Component Market Revenue Million Forecast, by Export Market Analysis (Value & Volume) 2019 & 2032
- Table 55: Global Satellite Component Market Revenue Million Forecast, by Price Trend Analysis 2019 & 2032
- Table 56: Global Satellite Component Market Revenue Million Forecast, by Country 2019 & 2032
- Table 57: Turkey Satellite Component Market Revenue (Million) Forecast, by Application 2019 & 2032
- Table 58: Israel Satellite Component Market Revenue (Million) Forecast, by Application 2019 & 2032
- Table 59: GCC Satellite Component Market Revenue (Million) Forecast, by Application 2019 & 2032
- Table 60: North Africa Satellite Component Market Revenue (Million) Forecast, by Application 2019 & 2032
- Table 61: South Africa Satellite Component Market Revenue (Million) Forecast, by Application 2019 & 2032
- Table 62: Rest of Middle East & Africa Satellite Component Market Revenue (Million) Forecast, by Application 2019 & 2032
- Table 63: Global Satellite Component Market Revenue Million Forecast, by Production Analysis 2019 & 2032
- Table 64: Global Satellite Component Market Revenue Million Forecast, by Consumption Analysis 2019 & 2032
- Table 65: Global Satellite Component Market Revenue Million Forecast, by Import Market Analysis (Value & Volume) 2019 & 2032
- Table 66: Global Satellite Component Market Revenue Million Forecast, by Export Market Analysis (Value & Volume) 2019 & 2032
- Table 67: Global Satellite Component Market Revenue Million Forecast, by Price Trend Analysis 2019 & 2032
- Table 68: Global Satellite Component Market Revenue Million Forecast, by Country 2019 & 2032
- Table 69: China Satellite Component Market Revenue (Million) Forecast, by Application 2019 & 2032
- Table 70: India Satellite Component Market Revenue (Million) Forecast, by Application 2019 & 2032
- Table 71: Japan Satellite Component Market Revenue (Million) Forecast, by Application 2019 & 2032
- Table 72: South Korea Satellite Component Market Revenue (Million) Forecast, by Application 2019 & 2032
- Table 73: ASEAN Satellite Component Market Revenue (Million) Forecast, by Application 2019 & 2032
- Table 74: Oceania Satellite Component Market Revenue (Million) Forecast, by Application 2019 & 2032
- Table 75: Rest of Asia Pacific Satellite Component Market Revenue (Million) Forecast, by Application 2019 & 2032
Frequently Asked Questions
1. What is the projected Compound Annual Growth Rate (CAGR) of the Satellite Component Market?
The projected CAGR is approximately 6.70%.
2. Which companies are prominent players in the Satellite Component Market?
Key companies in the market include Honeywell International Inc, THALES, Lockheed Martin Corporation, Challenger Communications, Sat- lite Technologies, Accion System, JONSA TECHNOLOGIES CO LTD, BAE Systems plc, IHI Corporation, Northrop Grumman Corporation, Viking Satcom.
3. What are the main segments of the Satellite Component Market?
The market segments include Production Analysis, Consumption Analysis, Import Market Analysis (Value & Volume), Export Market Analysis (Value & Volume), Price Trend Analysis.
4. Can you provide details about the market size?
The market size is estimated to be USD 3.16 Million as of 2022.
5. What are some drivers contributing to market growth?
Increase in Internet of Things (IoT) and Autonomous Systems; Rise in Demand for Military and Defense Satellite Communication Solutions.
6. What are the notable trends driving market growth?
The Antenna Segment is Expected to Show Remarkable Growth During the Forecast Period.
7. Are there any restraints impacting market growth?
Cybersecurity Threats to Satellite Communication; Interference in Transmission of Data.
8. Can you provide examples of recent developments in the market?
N/A
9. What pricing options are available for accessing the report?
Pricing options include single-user, multi-user, and enterprise licenses priced at USD 4750, USD 5250, and USD 8750 respectively.
10. Is the market size provided in terms of value or volume?
The market size is provided in terms of value, measured in Million.
11. Are there any specific market keywords associated with the report?
Yes, the market keyword associated with the report is "Satellite Component Market," which aids in identifying and referencing the specific market segment covered.
12. How do I determine which pricing option suits my needs best?
The pricing options vary based on user requirements and access needs. Individual users may opt for single-user licenses, while businesses requiring broader access may choose multi-user or enterprise licenses for cost-effective access to the report.
13. Are there any additional resources or data provided in the Satellite Component Market report?
While the report offers comprehensive insights, it's advisable to review the specific contents or supplementary materials provided to ascertain if additional resources or data are available.
14. How can I stay updated on further developments or reports in the Satellite Component Market?
To stay informed about further developments, trends, and reports in the Satellite Component Market, consider subscribing to industry newsletters, following relevant companies and organizations, or regularly checking reputable industry news sources and publications.
Methodology
Step 1 - Identification of Relevant Samples Size from Population Database


Step 2 - Approaches for Defining Global Market Size (Value, Volume* & Price*)

Note*: In applicable scenarios
Step 3 - Data Sources
Primary Research
- Web Analytics
- Survey Reports
- Research Institute
- Latest Research Reports
- Opinion Leaders
Secondary Research
- Annual Reports
- White Paper
- Latest Press Release
- Industry Association
- Paid Database
- Investor Presentations

Step 4 - Data Triangulation
Involves using different sources of information in order to increase the validity of a study
These sources are likely to be stakeholders in a program - participants, other researchers, program staff, other community members, and so on.
Then we put all data in single framework & apply various statistical tools to find out the dynamic on the market.
During the analysis stage, feedback from the stakeholder groups would be compared to determine areas of agreement as well as areas of divergence
