

Key Insights
The global seismic data acquisition systems market, valued at $10.5 billion in its base year 2025, is poised for significant expansion. This growth is primarily driven by escalating exploration and production (E&P) activities within the oil and gas sector, particularly in regions with substantial untapped hydrocarbon reserves. The market is projected to witness a Compound Annual Growth Rate (CAGR) of 15.58%, indicating a robust upward trend. Key growth catalysts include advancements in sensor technology, enabling higher resolution data acquisition and improved operational efficiency. Furthermore, the integration of innovative solutions such as autonomous recording systems and artificial intelligence (AI) for sophisticated data processing are accelerating market development. While challenges like volatile oil prices and stringent environmental regulations may present headwinds, the long-term outlook for seismic data acquisition remains exceptionally positive, underpinned by the persistent demand for precise subsurface imaging crucial to the energy industry. The competitive arena features established industry leaders alongside agile emerging companies offering specialized solutions, with strategic alliances and technological collaborations expected to intensify as firms focus on enhancing data quality and optimizing operational expenditures.
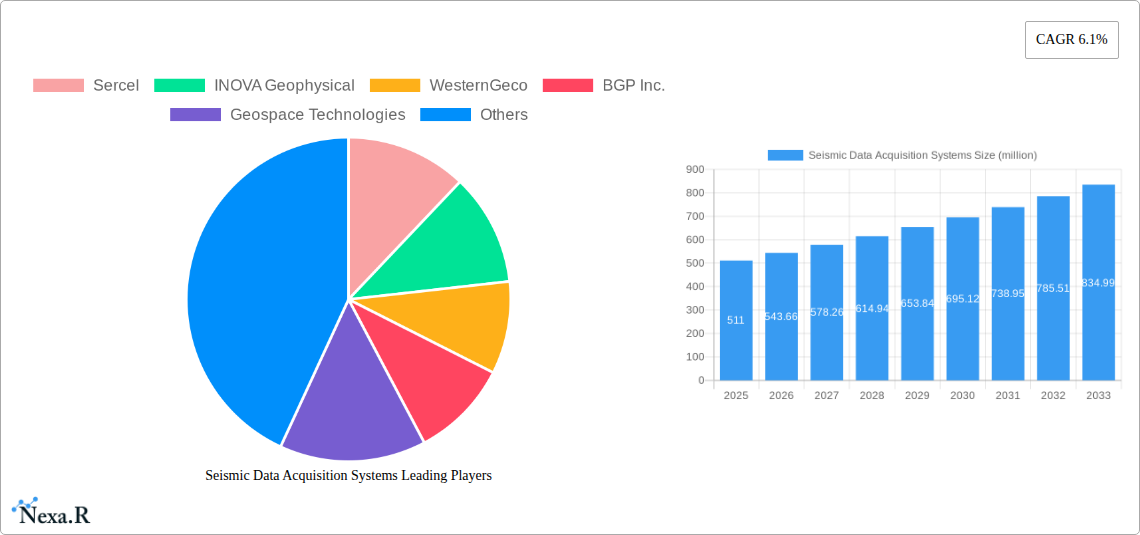
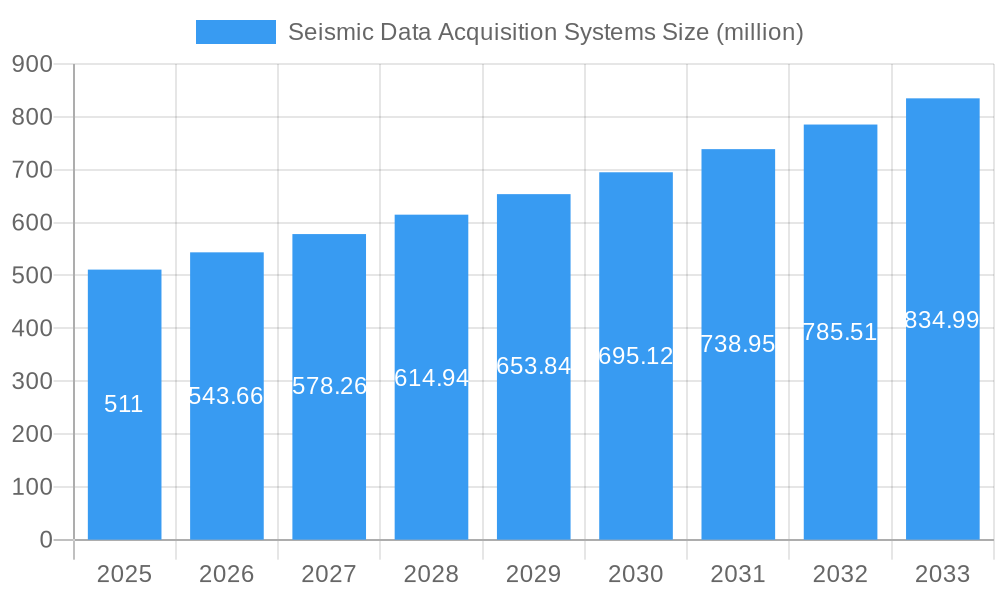
Seismic Data Acquisition Systems Market Size (In Billion)
Market segmentation is anticipated to span various system types, including land-based, marine, and ocean-bottom seismic systems. Data acquisition methodologies, such as 2D, 3D, and 4D seismic surveys, along with diverse service offerings encompassing equipment leasing, advanced data processing, and comprehensive integrated solutions, are expected to define the market's structure. Significant regional disparities in growth are probable, with areas characterized by intensive exploration efforts likely demonstrating accelerated expansion. North America and the Middle East, for instance, are identified as pivotal regional markets due to their considerable oil and gas reserves and ongoing exploration initiatives. The market's future trajectory will be shaped by global energy demand dynamics, continuous technological innovation, and evolving regulatory landscapes impacting E&P operations. A sustained emphasis on superior data quality, cost reduction strategies, and strict adherence to environmental mandates will be instrumental in defining the market's evolution.
Seismic Data Acquisition Systems Company Market Share
Seismic Data Acquisition Systems Market Report: 2019-2033
This comprehensive report provides a detailed analysis of the Seismic Data Acquisition Systems market, encompassing market dynamics, growth trends, regional analysis, competitive landscape, and future outlook. The study period covers 2019-2033, with 2025 as the base and estimated year. This report is essential for industry professionals, investors, and strategic decision-makers seeking a thorough understanding of this dynamic market. The parent market is the Oil and Gas Exploration and Production industry, while the child market focuses specifically on seismic survey equipment and services.
Seismic Data Acquisition Systems Market Dynamics & Structure
The global Seismic Data Acquisition Systems market, valued at xx million in 2024, is characterized by moderate concentration with key players holding significant market share. Technological innovation, driven by the need for higher resolution and efficiency, is a key market driver. Stringent regulatory frameworks concerning environmental impact and safety standards influence operational practices. Competition from alternative geophysical methods like electromagnetic surveys exists, though seismic remains dominant. End-user demographics primarily comprise oil and gas exploration companies, with increasing involvement from geothermal and geological survey organizations. M&A activity in the sector has been relatively stable in recent years, with xx deals recorded between 2019-2024, resulting in an average market share consolidation of approximately xx% annually.
- Market Concentration: Moderately concentrated, with top 5 players holding approximately xx% market share in 2024.
- Technological Innovation: Focus on improving sensor technology (e.g., MEMS, fiber optics), data processing algorithms, and autonomous systems.
- Regulatory Framework: Compliance with environmental regulations and safety standards is paramount, impacting operational costs.
- Competitive Substitutes: Electromagnetic methods and other geophysical techniques offer limited competition.
- End-User Demographics: Predominantly oil and gas exploration companies, with growing demand from geothermal and geological survey firms.
- M&A Trends: xx M&A deals between 2019-2024, with an average annual market share consolidation of xx%. Innovation barriers include high R&D costs and complex integration of new technologies.
Seismic Data Acquisition Systems Growth Trends & Insights
The Seismic Data Acquisition Systems market exhibited a CAGR of xx% during 2019-2024, reaching a value of xx million in 2024. This growth is attributed to increasing oil and gas exploration activities globally, coupled with technological advancements leading to improved data acquisition efficiency and accuracy. Market penetration in emerging economies remains relatively low, presenting significant opportunities for growth. Consumer behavior is increasingly favoring integrated solutions offering streamlined workflows and reduced operational complexity. The forecast period (2025-2033) projects continued growth, driven by the increasing adoption of advanced technologies and expansion into new geographical markets. A projected CAGR of xx% is anticipated, leading to a market size of xx million by 2033. Technological disruptions, such as the rise of autonomous survey systems and AI-driven data processing, will further accelerate growth. Adoption rates are expected to increase significantly driven by the improved efficiency and reduction in operating costs.
Dominant Regions, Countries, or Segments in Seismic Data Acquisition Systems
The North American region holds the largest market share, driven by robust oil and gas exploration activities and a well-established technological infrastructure. The Middle East and Asia-Pacific regions are also witnessing significant growth due to substantial investments in exploration and production projects. Specific countries driving growth include the United States (due to shale gas exploration), Saudi Arabia (significant oil reserves), and China (growing energy demand).
- Key Drivers:
- North America: High exploration activity, advanced technology infrastructure, and government support for energy exploration.
- Middle East: Large oil reserves, significant investments in exploration and production.
- Asia-Pacific: Growing energy demand, increasing investments in exploration and production.
- Dominance Factors: Strong regulatory frameworks, skilled workforce, readily available funding, and established industry networks contribute to regional dominance. Growth potential is high in developing countries with significant untapped hydrocarbon resources.
Seismic Data Acquisition Systems Product Landscape
The market offers a diverse range of systems, including land, marine, and ocean-bottom cable (OBC) acquisition systems. Recent innovations focus on enhancing data quality through improved sensor technology, noise reduction algorithms, and real-time data processing. Unique selling propositions include improved accuracy, higher resolution, reduced operational time, and enhanced data visualization capabilities. Technological advancements like autonomous survey vessels and advanced data analytics are shaping the future of the product landscape.
Key Drivers, Barriers & Challenges in Seismic Data Acquisition Systems
Key Drivers: The primary drivers include increasing demand for oil and gas exploration, technological advancements, and government initiatives promoting energy independence. Specific examples include the growth of shale gas production and increased investment in offshore exploration.
Key Challenges: Supply chain disruptions, particularly in sourcing specialized components, impact production and delivery timelines. Stringent regulatory requirements and environmental concerns pose significant challenges. Intense competition among established players and new entrants can affect pricing and profitability. Quantifiable impacts include potential delays in project completion, increased operational costs, and reduced profit margins.
Emerging Opportunities in Seismic Data Acquisition Systems
Emerging opportunities exist in untapped markets, such as geothermal exploration and carbon capture and storage projects. Innovative applications, such as using seismic data for mineral exploration and groundwater management, are gaining traction. Evolving consumer preferences towards integrated solutions and data-driven decision-making are opening new avenues for growth.
Growth Accelerators in the Seismic Data Acquisition Systems Industry
Technological breakthroughs in sensor technology, data processing, and automation are driving long-term growth. Strategic partnerships between equipment manufacturers and service providers are enhancing efficiency and market reach. Market expansion strategies focusing on emerging economies and new applications are creating significant opportunities for growth.
Key Players Shaping the Seismic Data Acquisition Systems Market
- Sercel
- INOVA Geophysical
- WesternGeco
- BGP Inc.
- Geospace Technologies
- Nanometrics
- Terrex Seismic
- Paragon Geophysical Services
- Geometrics
- Asian Oilfield Services Limited
Notable Milestones in Seismic Data Acquisition Systems Sector
- 2020-Q3: Sercel launched its next-generation autonomous nodal system.
- 2021-Q1: INOVA Geophysical announced a strategic partnership with a major oil company.
- 2022-Q4: WesternGeco introduced a new high-resolution marine acquisition system. (Further milestones require specific information to be added)
In-Depth Seismic Data Acquisition Systems Market Outlook
The Seismic Data Acquisition Systems market is poised for continued growth driven by technological innovation, increasing exploration activity, and expansion into new markets. Strategic opportunities include developing advanced data analytics solutions, focusing on sustainability and environmental compliance, and expanding into new geographical regions. The long-term outlook remains positive, with substantial growth potential in both established and emerging markets.
Seismic Data Acquisition Systems Segmentation
-
1. Application
- 1.1. Oil and Gas industry
- 1.2. Metal and Mining Industry
- 1.3. Others
-
2. Type
- 2.1. Wireless Connected Systems
- 2.2. Wire Connected Systems
Seismic Data Acquisition Systems Segmentation By Geography
-
1. North America
- 1.1. United States
- 1.2. Canada
- 1.3. Mexico
-
2. South America
- 2.1. Brazil
- 2.2. Argentina
- 2.3. Rest of South America
-
3. Europe
- 3.1. United Kingdom
- 3.2. Germany
- 3.3. France
- 3.4. Italy
- 3.5. Spain
- 3.6. Russia
- 3.7. Benelux
- 3.8. Nordics
- 3.9. Rest of Europe
-
4. Middle East & Africa
- 4.1. Turkey
- 4.2. Israel
- 4.3. GCC
- 4.4. North Africa
- 4.5. South Africa
- 4.6. Rest of Middle East & Africa
-
5. Asia Pacific
- 5.1. China
- 5.2. India
- 5.3. Japan
- 5.4. South Korea
- 5.5. ASEAN
- 5.6. Oceania
- 5.7. Rest of Asia Pacific
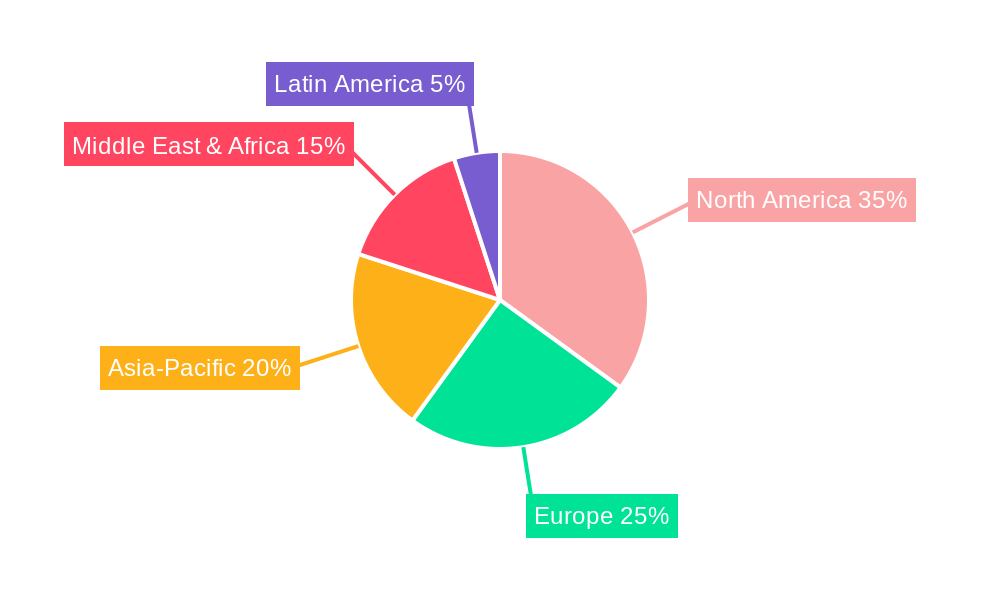
Seismic Data Acquisition Systems Regional Market Share
Geographic Coverage of Seismic Data Acquisition Systems
Seismic Data Acquisition Systems REPORT HIGHLIGHTS
| Aspects | Details |
|---|---|
| Study Period | 2020-2034 |
| Base Year | 2025 |
| Estimated Year | 2026 |
| Forecast Period | 2026-2034 |
| Historical Period | 2020-2025 |
| Growth Rate | CAGR of 15.58% from 2020-2034 |
| Segmentation |
|
Table of Contents
- 1. Introduction
- 1.1. Research Scope
- 1.2. Market Segmentation
- 1.3. Research Objective
- 1.4. Definitions and Assumptions
- 2. Executive Summary
- 2.1. Market Snapshot
- 3. Market Dynamics
- 3.1. Market Drivers
- 3.2. Market Restrains
- 3.3. Market Trends
- 3.4. Market Opportunities
- 4. Market Factor Analysis
- 4.1. Porters Five Forces
- 4.1.1. Bargaining Power of Suppliers
- 4.1.2. Bargaining Power of Buyers
- 4.1.3. Threat of New Entrants
- 4.1.4. Threat of Substitutes
- 4.1.5. Competitive Rivalry
- 4.2. PESTEL analysis
- 4.3. BCG Analysis
- 4.3.1. Stars (High Growth, High Market Share)
- 4.3.2. Cash Cows (Low Growth, High Market Share)
- 4.3.3. Question Mark (High Growth, Low Market Share)
- 4.3.4. Dogs (Low Growth, Low Market Share)
- 4.4. Ansoff Matrix Analysis
- 4.5. Supply Chain Analysis
- 4.6. Regulatory Landscape
- 4.7. Current Market Potential and Opportunity Assessment (TAM–SAM–SOM Framework)
- 4.8. NRP Analyst Note
- 4.1. Porters Five Forces
- 5. Market Analysis, Insights and Forecast 2021-2033
- 5.1. Market Analysis, Insights and Forecast - by Application
- 5.1.1. Oil and Gas industry
- 5.1.2. Metal and Mining Industry
- 5.1.3. Others
- 5.2. Market Analysis, Insights and Forecast - by Type
- 5.2.1. Wireless Connected Systems
- 5.2.2. Wire Connected Systems
- 5.3. Market Analysis, Insights and Forecast - by Region
- 5.3.1. North America
- 5.3.2. South America
- 5.3.3. Europe
- 5.3.4. Middle East & Africa
- 5.3.5. Asia Pacific
- 5.1. Market Analysis, Insights and Forecast - by Application
- 6. Global Seismic Data Acquisition Systems Analysis, Insights and Forecast, 2021-2033
- 6.1. Market Analysis, Insights and Forecast - by Application
- 6.1.1. Oil and Gas industry
- 6.1.2. Metal and Mining Industry
- 6.1.3. Others
- 6.2. Market Analysis, Insights and Forecast - by Type
- 6.2.1. Wireless Connected Systems
- 6.2.2. Wire Connected Systems
- 6.1. Market Analysis, Insights and Forecast - by Application
- 7. North America Seismic Data Acquisition Systems Analysis, Insights and Forecast, 2020-2032
- 7.1. Market Analysis, Insights and Forecast - by Application
- 7.1.1. Oil and Gas industry
- 7.1.2. Metal and Mining Industry
- 7.1.3. Others
- 7.2. Market Analysis, Insights and Forecast - by Type
- 7.2.1. Wireless Connected Systems
- 7.2.2. Wire Connected Systems
- 7.1. Market Analysis, Insights and Forecast - by Application
- 8. South America Seismic Data Acquisition Systems Analysis, Insights and Forecast, 2020-2032
- 8.1. Market Analysis, Insights and Forecast - by Application
- 8.1.1. Oil and Gas industry
- 8.1.2. Metal and Mining Industry
- 8.1.3. Others
- 8.2. Market Analysis, Insights and Forecast - by Type
- 8.2.1. Wireless Connected Systems
- 8.2.2. Wire Connected Systems
- 8.1. Market Analysis, Insights and Forecast - by Application
- 9. Europe Seismic Data Acquisition Systems Analysis, Insights and Forecast, 2020-2032
- 9.1. Market Analysis, Insights and Forecast - by Application
- 9.1.1. Oil and Gas industry
- 9.1.2. Metal and Mining Industry
- 9.1.3. Others
- 9.2. Market Analysis, Insights and Forecast - by Type
- 9.2.1. Wireless Connected Systems
- 9.2.2. Wire Connected Systems
- 9.1. Market Analysis, Insights and Forecast - by Application
- 10. Middle East & Africa Seismic Data Acquisition Systems Analysis, Insights and Forecast, 2020-2032
- 10.1. Market Analysis, Insights and Forecast - by Application
- 10.1.1. Oil and Gas industry
- 10.1.2. Metal and Mining Industry
- 10.1.3. Others
- 10.2. Market Analysis, Insights and Forecast - by Type
- 10.2.1. Wireless Connected Systems
- 10.2.2. Wire Connected Systems
- 10.1. Market Analysis, Insights and Forecast - by Application
- 11. Asia Pacific Seismic Data Acquisition Systems Analysis, Insights and Forecast, 2020-2032
- 11.1. Market Analysis, Insights and Forecast - by Application
- 11.1.1. Oil and Gas industry
- 11.1.2. Metal and Mining Industry
- 11.1.3. Others
- 11.2. Market Analysis, Insights and Forecast - by Type
- 11.2.1. Wireless Connected Systems
- 11.2.2. Wire Connected Systems
- 11.1. Market Analysis, Insights and Forecast - by Application
- 12. Competitive Analysis
- 12.1. Company Profiles
- 12.1.1 Sercel
- 12.1.1.1. Company Overview
- 12.1.1.2. Products
- 12.1.1.3. Company Financials
- 12.1.1.4. SWOT Analysis
- 12.1.2 INOVA Geophysical
- 12.1.2.1. Company Overview
- 12.1.2.2. Products
- 12.1.2.3. Company Financials
- 12.1.2.4. SWOT Analysis
- 12.1.3 WesternGeco
- 12.1.3.1. Company Overview
- 12.1.3.2. Products
- 12.1.3.3. Company Financials
- 12.1.3.4. SWOT Analysis
- 12.1.4 BGP Inc.
- 12.1.4.1. Company Overview
- 12.1.4.2. Products
- 12.1.4.3. Company Financials
- 12.1.4.4. SWOT Analysis
- 12.1.5 Geospace Technologies
- 12.1.5.1. Company Overview
- 12.1.5.2. Products
- 12.1.5.3. Company Financials
- 12.1.5.4. SWOT Analysis
- 12.1.6 Nanometrics
- 12.1.6.1. Company Overview
- 12.1.6.2. Products
- 12.1.6.3. Company Financials
- 12.1.6.4. SWOT Analysis
- 12.1.7 Terrex Seismic
- 12.1.7.1. Company Overview
- 12.1.7.2. Products
- 12.1.7.3. Company Financials
- 12.1.7.4. SWOT Analysis
- 12.1.8 Paragon Geophysical Services
- 12.1.8.1. Company Overview
- 12.1.8.2. Products
- 12.1.8.3. Company Financials
- 12.1.8.4. SWOT Analysis
- 12.1.9 Geometrics
- 12.1.9.1. Company Overview
- 12.1.9.2. Products
- 12.1.9.3. Company Financials
- 12.1.9.4. SWOT Analysis
- 12.1.10 Asian Oilfield Services Limited
- 12.1.10.1. Company Overview
- 12.1.10.2. Products
- 12.1.10.3. Company Financials
- 12.1.10.4. SWOT Analysis
- 12.1.1 Sercel
- 12.2. Market Entropy
- 12.2.1 Company's Key Areas Served
- 12.2.2 Recent Developments
- 12.3. Company Market Share Analysis 2025
- 12.3.1 Top 5 Companies Market Share Analysis
- 12.3.2 Top 3 Companies Market Share Analysis
- 12.4. List of Potential Customers
- 13. Research Methodology
List of Figures
- Figure 1: Global Seismic Data Acquisition Systems Revenue Breakdown (billion, %) by Region 2025 & 2033
- Figure 2: North America Seismic Data Acquisition Systems Revenue (billion), by Application 2025 & 2033
- Figure 3: North America Seismic Data Acquisition Systems Revenue Share (%), by Application 2025 & 2033
- Figure 4: North America Seismic Data Acquisition Systems Revenue (billion), by Type 2025 & 2033
- Figure 5: North America Seismic Data Acquisition Systems Revenue Share (%), by Type 2025 & 2033
- Figure 6: North America Seismic Data Acquisition Systems Revenue (billion), by Country 2025 & 2033
- Figure 7: North America Seismic Data Acquisition Systems Revenue Share (%), by Country 2025 & 2033
- Figure 8: South America Seismic Data Acquisition Systems Revenue (billion), by Application 2025 & 2033
- Figure 9: South America Seismic Data Acquisition Systems Revenue Share (%), by Application 2025 & 2033
- Figure 10: South America Seismic Data Acquisition Systems Revenue (billion), by Type 2025 & 2033
- Figure 11: South America Seismic Data Acquisition Systems Revenue Share (%), by Type 2025 & 2033
- Figure 12: South America Seismic Data Acquisition Systems Revenue (billion), by Country 2025 & 2033
- Figure 13: South America Seismic Data Acquisition Systems Revenue Share (%), by Country 2025 & 2033
- Figure 14: Europe Seismic Data Acquisition Systems Revenue (billion), by Application 2025 & 2033
- Figure 15: Europe Seismic Data Acquisition Systems Revenue Share (%), by Application 2025 & 2033
- Figure 16: Europe Seismic Data Acquisition Systems Revenue (billion), by Type 2025 & 2033
- Figure 17: Europe Seismic Data Acquisition Systems Revenue Share (%), by Type 2025 & 2033
- Figure 18: Europe Seismic Data Acquisition Systems Revenue (billion), by Country 2025 & 2033
- Figure 19: Europe Seismic Data Acquisition Systems Revenue Share (%), by Country 2025 & 2033
- Figure 20: Middle East & Africa Seismic Data Acquisition Systems Revenue (billion), by Application 2025 & 2033
- Figure 21: Middle East & Africa Seismic Data Acquisition Systems Revenue Share (%), by Application 2025 & 2033
- Figure 22: Middle East & Africa Seismic Data Acquisition Systems Revenue (billion), by Type 2025 & 2033
- Figure 23: Middle East & Africa Seismic Data Acquisition Systems Revenue Share (%), by Type 2025 & 2033
- Figure 24: Middle East & Africa Seismic Data Acquisition Systems Revenue (billion), by Country 2025 & 2033
- Figure 25: Middle East & Africa Seismic Data Acquisition Systems Revenue Share (%), by Country 2025 & 2033
- Figure 26: Asia Pacific Seismic Data Acquisition Systems Revenue (billion), by Application 2025 & 2033
- Figure 27: Asia Pacific Seismic Data Acquisition Systems Revenue Share (%), by Application 2025 & 2033
- Figure 28: Asia Pacific Seismic Data Acquisition Systems Revenue (billion), by Type 2025 & 2033
- Figure 29: Asia Pacific Seismic Data Acquisition Systems Revenue Share (%), by Type 2025 & 2033
- Figure 30: Asia Pacific Seismic Data Acquisition Systems Revenue (billion), by Country 2025 & 2033
- Figure 31: Asia Pacific Seismic Data Acquisition Systems Revenue Share (%), by Country 2025 & 2033
List of Tables
- Table 1: Global Seismic Data Acquisition Systems Revenue billion Forecast, by Application 2020 & 2033
- Table 2: Global Seismic Data Acquisition Systems Revenue billion Forecast, by Type 2020 & 2033
- Table 3: Global Seismic Data Acquisition Systems Revenue billion Forecast, by Region 2020 & 2033
- Table 4: Global Seismic Data Acquisition Systems Revenue billion Forecast, by Application 2020 & 2033
- Table 5: Global Seismic Data Acquisition Systems Revenue billion Forecast, by Type 2020 & 2033
- Table 6: Global Seismic Data Acquisition Systems Revenue billion Forecast, by Country 2020 & 2033
- Table 7: United States Seismic Data Acquisition Systems Revenue (billion) Forecast, by Application 2020 & 2033
- Table 8: Canada Seismic Data Acquisition Systems Revenue (billion) Forecast, by Application 2020 & 2033
- Table 9: Mexico Seismic Data Acquisition Systems Revenue (billion) Forecast, by Application 2020 & 2033
- Table 10: Global Seismic Data Acquisition Systems Revenue billion Forecast, by Application 2020 & 2033
- Table 11: Global Seismic Data Acquisition Systems Revenue billion Forecast, by Type 2020 & 2033
- Table 12: Global Seismic Data Acquisition Systems Revenue billion Forecast, by Country 2020 & 2033
- Table 13: Brazil Seismic Data Acquisition Systems Revenue (billion) Forecast, by Application 2020 & 2033
- Table 14: Argentina Seismic Data Acquisition Systems Revenue (billion) Forecast, by Application 2020 & 2033
- Table 15: Rest of South America Seismic Data Acquisition Systems Revenue (billion) Forecast, by Application 2020 & 2033
- Table 16: Global Seismic Data Acquisition Systems Revenue billion Forecast, by Application 2020 & 2033
- Table 17: Global Seismic Data Acquisition Systems Revenue billion Forecast, by Type 2020 & 2033
- Table 18: Global Seismic Data Acquisition Systems Revenue billion Forecast, by Country 2020 & 2033
- Table 19: United Kingdom Seismic Data Acquisition Systems Revenue (billion) Forecast, by Application 2020 & 2033
- Table 20: Germany Seismic Data Acquisition Systems Revenue (billion) Forecast, by Application 2020 & 2033
- Table 21: France Seismic Data Acquisition Systems Revenue (billion) Forecast, by Application 2020 & 2033
- Table 22: Italy Seismic Data Acquisition Systems Revenue (billion) Forecast, by Application 2020 & 2033
- Table 23: Spain Seismic Data Acquisition Systems Revenue (billion) Forecast, by Application 2020 & 2033
- Table 24: Russia Seismic Data Acquisition Systems Revenue (billion) Forecast, by Application 2020 & 2033
- Table 25: Benelux Seismic Data Acquisition Systems Revenue (billion) Forecast, by Application 2020 & 2033
- Table 26: Nordics Seismic Data Acquisition Systems Revenue (billion) Forecast, by Application 2020 & 2033
- Table 27: Rest of Europe Seismic Data Acquisition Systems Revenue (billion) Forecast, by Application 2020 & 2033
- Table 28: Global Seismic Data Acquisition Systems Revenue billion Forecast, by Application 2020 & 2033
- Table 29: Global Seismic Data Acquisition Systems Revenue billion Forecast, by Type 2020 & 2033
- Table 30: Global Seismic Data Acquisition Systems Revenue billion Forecast, by Country 2020 & 2033
- Table 31: Turkey Seismic Data Acquisition Systems Revenue (billion) Forecast, by Application 2020 & 2033
- Table 32: Israel Seismic Data Acquisition Systems Revenue (billion) Forecast, by Application 2020 & 2033
- Table 33: GCC Seismic Data Acquisition Systems Revenue (billion) Forecast, by Application 2020 & 2033
- Table 34: North Africa Seismic Data Acquisition Systems Revenue (billion) Forecast, by Application 2020 & 2033
- Table 35: South Africa Seismic Data Acquisition Systems Revenue (billion) Forecast, by Application 2020 & 2033
- Table 36: Rest of Middle East & Africa Seismic Data Acquisition Systems Revenue (billion) Forecast, by Application 2020 & 2033
- Table 37: Global Seismic Data Acquisition Systems Revenue billion Forecast, by Application 2020 & 2033
- Table 38: Global Seismic Data Acquisition Systems Revenue billion Forecast, by Type 2020 & 2033
- Table 39: Global Seismic Data Acquisition Systems Revenue billion Forecast, by Country 2020 & 2033
- Table 40: China Seismic Data Acquisition Systems Revenue (billion) Forecast, by Application 2020 & 2033
- Table 41: India Seismic Data Acquisition Systems Revenue (billion) Forecast, by Application 2020 & 2033
- Table 42: Japan Seismic Data Acquisition Systems Revenue (billion) Forecast, by Application 2020 & 2033
- Table 43: South Korea Seismic Data Acquisition Systems Revenue (billion) Forecast, by Application 2020 & 2033
- Table 44: ASEAN Seismic Data Acquisition Systems Revenue (billion) Forecast, by Application 2020 & 2033
- Table 45: Oceania Seismic Data Acquisition Systems Revenue (billion) Forecast, by Application 2020 & 2033
- Table 46: Rest of Asia Pacific Seismic Data Acquisition Systems Revenue (billion) Forecast, by Application 2020 & 2033
Frequently Asked Questions
1. What is the projected Compound Annual Growth Rate (CAGR) of the Seismic Data Acquisition Systems?
The projected CAGR is approximately 15.58%.
2. Which companies are prominent players in the Seismic Data Acquisition Systems?
Key companies in the market include Sercel, INOVA Geophysical, WesternGeco, BGP Inc., Geospace Technologies, Nanometrics, Terrex Seismic, Paragon Geophysical Services, Geometrics, Asian Oilfield Services Limited.
3. What are the main segments of the Seismic Data Acquisition Systems?
The market segments include Application, Type.
4. Can you provide details about the market size?
The market size is estimated to be USD 10.5 billion as of 2022.
5. What are some drivers contributing to market growth?
N/A
6. What are the notable trends driving market growth?
N/A
7. Are there any restraints impacting market growth?
N/A
8. Can you provide examples of recent developments in the market?
N/A
9. What pricing options are available for accessing the report?
Pricing options include single-user, multi-user, and enterprise licenses priced at USD 4250.00, USD 6375.00, and USD 8500.00 respectively.
10. Is the market size provided in terms of value or volume?
The market size is provided in terms of value, measured in billion.
11. Are there any specific market keywords associated with the report?
Yes, the market keyword associated with the report is "Seismic Data Acquisition Systems," which aids in identifying and referencing the specific market segment covered.
12. How do I determine which pricing option suits my needs best?
The pricing options vary based on user requirements and access needs. Individual users may opt for single-user licenses, while businesses requiring broader access may choose multi-user or enterprise licenses for cost-effective access to the report.
13. Are there any additional resources or data provided in the Seismic Data Acquisition Systems report?
While the report offers comprehensive insights, it's advisable to review the specific contents or supplementary materials provided to ascertain if additional resources or data are available.
14. How can I stay updated on further developments or reports in the Seismic Data Acquisition Systems?
To stay informed about further developments, trends, and reports in the Seismic Data Acquisition Systems, consider subscribing to industry newsletters, following relevant companies and organizations, or regularly checking reputable industry news sources and publications.
Methodology
Step 1 - Identification of Relevant Samples Size from Population Database


Step 2 - Approaches for Defining Global Market Size (Value, Volume* & Price*)

Note*: In applicable scenarios
Step 3 - Data Sources
Primary Research
- Web Analytics
- Survey Reports
- Research Institute
- Latest Research Reports
- Opinion Leaders
Secondary Research
- Annual Reports
- White Paper
- Latest Press Release
- Industry Association
- Paid Database
- Investor Presentations

Step 4 - Data Triangulation
Involves using different sources of information in order to increase the validity of a study
These sources are likely to be stakeholders in a program - participants, other researchers, program staff, other community members, and so on.
Then we put all data in single framework & apply various statistical tools to find out the dynamic on the market.
During the analysis stage, feedback from the stakeholder groups would be compared to determine areas of agreement as well as areas of divergence