

Key Insights
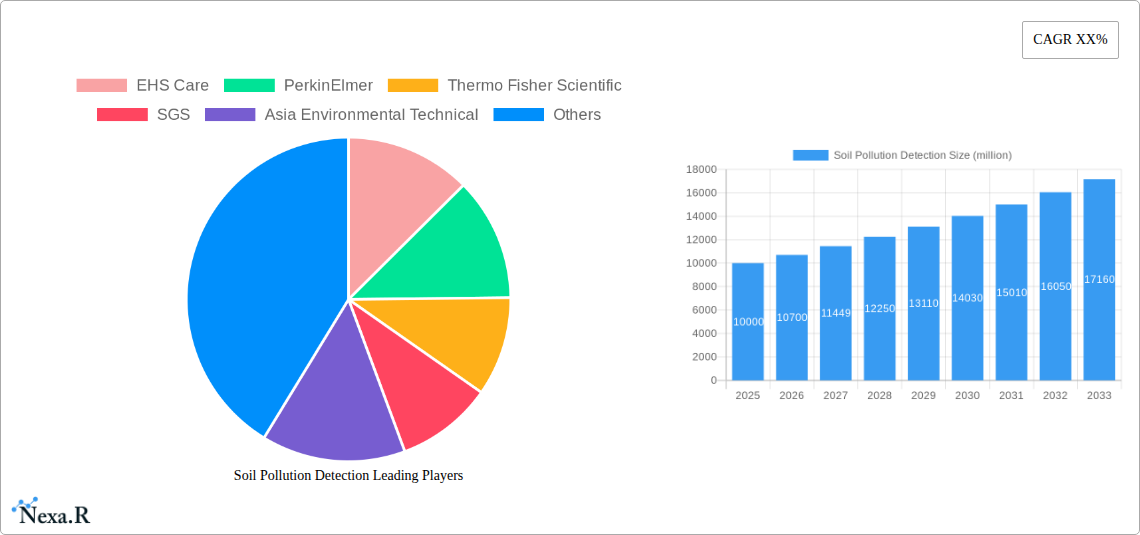
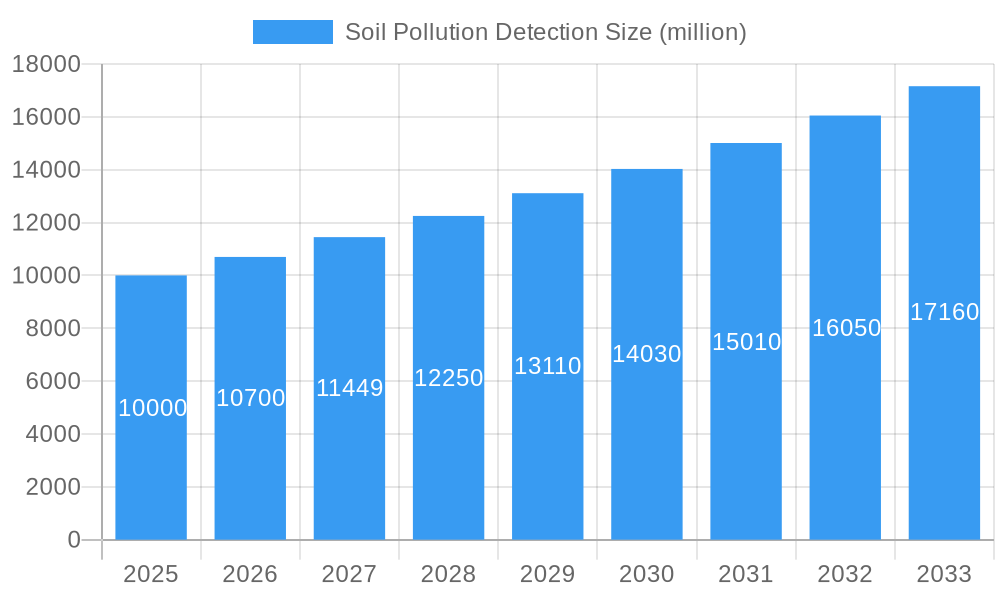
The global soil pollution detection market is poised for significant expansion, propelled by heightened environmental awareness, rigorous regulatory frameworks, and the widespread adoption of sophisticated detection technologies. The market, currently valued at $10 billion in 2025, is forecast to grow at a Compound Annual Growth Rate (CAGR) of 4.9% from 2025 to 2033, reaching an estimated $16 billion by 2033. Key drivers include the proliferation of industrial activities, the imperative for food security and sustainable agriculture, and the emergence of cost-effective soil testing solutions, including portable sensors and advanced spectroscopy. The increasing adoption of precision agriculture further fuels demand for accurate soil pollution data to optimize crop yields and minimize risks.
Soil Pollution Detection Market Size (In Billion)
Prominent market players like EHS Care, PerkinElmer, Thermo Fisher Scientific, SGS, Asia Environmental Technical, Cirs, AEM Laboratory, and RayKol are driving market evolution through innovation, strategic alliances, and global expansion.
Soil Pollution Detection Company Market Share
Market challenges encompass the substantial investment required for advanced testing equipment and methodologies, localized awareness gaps regarding soil pollution, and the demand for skilled professionals. Nevertheless, continuous technological advancements are progressively enhancing accessibility and affordability. Analysis of market segmentation highlights robust growth in segments utilizing advanced analytical techniques such as mass spectrometry and chromatography due to their superior accuracy and sensitivity. Geographically, North America and Europe demonstrate substantial market penetration, while emerging economies in Asia and other developing regions present considerable future growth prospects. The development of rapid, on-site testing kits and intuitive data analysis software further contributes to market growth.
Soil Pollution Detection Market Report: 2019-2033
This comprehensive report provides an in-depth analysis of the Soil Pollution Detection market, offering invaluable insights for industry professionals, investors, and researchers. The study period spans from 2019 to 2033, with a base year of 2025 and a forecast period of 2025-2033. The market is segmented by technology, application, and geography, providing a granular understanding of its dynamics. Key players such as EHS Care, PerkinElmer, Thermo Fisher Scientific, SGS, Asia Environmental Technical, Cirs, AEM Laboratory, and RayKol are profiled, highlighting their strategies and market positions. The report projects the global Soil Pollution Detection market to reach xx million by 2033.
Parent Market: Environmental Monitoring Market (xx million in 2025) Child Market: Soil Testing and Remediation Services (xx million in 2025)
Soil Pollution Detection Market Dynamics & Structure
The Soil Pollution Detection market is characterized by moderate concentration, with a few large players and numerous smaller, specialized firms. Technological innovation, particularly in sensor technology and data analytics, is a key driver, while stringent environmental regulations are increasingly shaping market dynamics. The market faces competition from traditional methods, but advanced technologies offer superior speed, accuracy, and cost-effectiveness. End-users include government agencies, environmental consultants, agricultural businesses, and industrial facilities. M&A activity has been moderate in recent years, with a total of xx deals recorded between 2019 and 2024.
- Market Concentration: Moderately concentrated, with a Herfindahl-Hirschman Index (HHI) of xx in 2025.
- Technological Innovation: Rapid advancements in spectroscopy, chromatography, and sensor technologies are driving market growth.
- Regulatory Frameworks: Stringent environmental regulations in developed and developing countries are fueling demand for accurate soil pollution detection.
- Competitive Substitutes: Traditional methods like laboratory-based testing compete with newer technologies, but advanced techniques offer superior benefits.
- End-User Demographics: Government agencies, environmental consultants, agriculture, and industry are key end-users.
- M&A Trends: xx M&A deals recorded between 2019-2024, indicating moderate consolidation.
Soil Pollution Detection Growth Trends & Insights
The Soil Pollution Detection market exhibited a CAGR of xx% during the historical period (2019-2024) and is projected to grow at a CAGR of xx% during the forecast period (2025-2033). This growth is driven by increasing awareness of soil contamination, stricter environmental regulations, and the rising adoption of advanced technologies. Market penetration is currently at xx%, expected to reach xx% by 2033, driven by technological advancements and increasing affordability. Consumer behavior shifts towards sustainable practices and responsible land management also contributes significantly.
Dominant Regions, Countries, or Segments in Soil Pollution Detection
North America currently dominates the Soil Pollution Detection market, holding a market share of xx% in 2025, followed by Europe and Asia Pacific. This dominance is attributed to robust regulatory frameworks, high environmental awareness, and a strong presence of key players. However, Asia Pacific is expected to witness the highest growth rate during the forecast period due to rapid industrialization, increasing urbanization, and rising government investments in environmental monitoring.
- North America: Stringent environmental regulations, high technological advancements, and established market presence.
- Europe: High environmental awareness, robust regulatory frameworks, and significant investments in environmental monitoring.
- Asia Pacific: Rapid industrialization, increasing urbanization, and rising government investments drive market growth.
- Rest of the World: Growing environmental concerns and government initiatives contribute to market expansion.
Soil Pollution Detection Product Landscape
The Soil Pollution Detection market offers a wide range of products including portable field analyzers, laboratory-based instruments, and software solutions for data analysis. These products utilize various technologies such as spectroscopy, chromatography, and immunoassay techniques. Key innovations focus on improving accuracy, speed, portability, and cost-effectiveness. Unique selling propositions include real-time analysis capabilities, user-friendly interfaces, and advanced data interpretation tools.
Key Drivers, Barriers & Challenges in Soil Pollution Detection
Key Drivers: Increasing environmental awareness, stringent government regulations, technological advancements (miniaturization, improved accuracy), and rising demand from agriculture and industrial sectors.
Challenges: High initial investment costs for advanced technologies, lack of skilled personnel in developing regions, limited awareness in some areas, and the complexity of soil matrix analysis which can lead to inaccurate results and thus, increased costs. These factors result in xx% of projects failing to meet desired accuracy levels.
Emerging Opportunities in Soil Pollution Detection
Emerging opportunities include the growing demand for on-site testing, the development of cost-effective solutions for developing countries, the integration of IoT and AI for real-time monitoring and predictive analysis, and the expansion into niche applications like precision agriculture and contaminated site remediation.
Growth Accelerators in the Soil Pollution Detection Industry
Technological breakthroughs in sensor technology, miniaturization, and AI-driven data analytics are key catalysts. Strategic partnerships between technology providers and environmental service companies are also driving market expansion. Government initiatives promoting sustainable land management and environmental monitoring further accelerate market growth.
Key Players Shaping the Soil Pollution Detection Market
- EHS Care
- PerkinElmer
- Thermo Fisher Scientific
- SGS
- Asia Environmental Technical
- Cirs
- AEM Laboratory
- RayKol
Notable Milestones in Soil Pollution Detection Sector
- 2020, Q4: PerkinElmer launches a new portable soil analyzer with improved accuracy.
- 2022, Q2: SGS acquires a smaller soil testing company, expanding its geographical reach.
- 2023, Q1: Thermo Fisher Scientific introduces a new software platform for soil data analysis.
- 2024, Q3: A new regulatory framework for soil contamination is implemented in the EU.
In-Depth Soil Pollution Detection Market Outlook
The Soil Pollution Detection market is poised for significant growth, driven by technological advancements, stringent regulations, and increasing environmental awareness. Strategic partnerships and investments in R&D will further propel market expansion. The market presents lucrative opportunities for technology providers, environmental service companies, and investors seeking long-term growth in a sector crucial for environmental sustainability.
Soil Pollution Detection Segmentation
-
1. Application
- 1.1. Environmental Protection Agencies
- 1.2. Agriculture
- 1.3. Industrial Enterprises
- 1.4. Other
-
2. Types
- 2.1. Service
- 2.2. Device
Soil Pollution Detection Segmentation By Geography
-
1. North America
- 1.1. United States
- 1.2. Canada
- 1.3. Mexico
-
2. South America
- 2.1. Brazil
- 2.2. Argentina
- 2.3. Rest of South America
-
3. Europe
- 3.1. United Kingdom
- 3.2. Germany
- 3.3. France
- 3.4. Italy
- 3.5. Spain
- 3.6. Russia
- 3.7. Benelux
- 3.8. Nordics
- 3.9. Rest of Europe
-
4. Middle East & Africa
- 4.1. Turkey
- 4.2. Israel
- 4.3. GCC
- 4.4. North Africa
- 4.5. South Africa
- 4.6. Rest of Middle East & Africa
-
5. Asia Pacific
- 5.1. China
- 5.2. India
- 5.3. Japan
- 5.4. South Korea
- 5.5. ASEAN
- 5.6. Oceania
- 5.7. Rest of Asia Pacific

Soil Pollution Detection Regional Market Share
Geographic Coverage of Soil Pollution Detection
Soil Pollution Detection REPORT HIGHLIGHTS
| Aspects | Details |
|---|---|
| Study Period | 2020-2034 |
| Base Year | 2025 |
| Estimated Year | 2026 |
| Forecast Period | 2026-2034 |
| Historical Period | 2020-2025 |
| Growth Rate | CAGR of 4.9% from 2020-2034 |
| Segmentation |
|
Table of Contents
- 1. Introduction
- 1.1. Research Scope
- 1.2. Market Segmentation
- 1.3. Research Objective
- 1.4. Definitions and Assumptions
- 2. Executive Summary
- 2.1. Market Snapshot
- 3. Market Dynamics
- 3.1. Market Drivers
- 3.2. Market Restrains
- 3.3. Market Trends
- 3.4. Market Opportunities
- 4. Market Factor Analysis
- 4.1. Porters Five Forces
- 4.1.1. Bargaining Power of Suppliers
- 4.1.2. Bargaining Power of Buyers
- 4.1.3. Threat of New Entrants
- 4.1.4. Threat of Substitutes
- 4.1.5. Competitive Rivalry
- 4.2. PESTEL analysis
- 4.3. BCG Analysis
- 4.3.1. Stars (High Growth, High Market Share)
- 4.3.2. Cash Cows (Low Growth, High Market Share)
- 4.3.3. Question Mark (High Growth, Low Market Share)
- 4.3.4. Dogs (Low Growth, Low Market Share)
- 4.4. Ansoff Matrix Analysis
- 4.5. Supply Chain Analysis
- 4.6. Regulatory Landscape
- 4.7. Current Market Potential and Opportunity Assessment (TAM–SAM–SOM Framework)
- 4.8. NRP Analyst Note
- 4.1. Porters Five Forces
- 5. Market Analysis, Insights and Forecast 2021-2033
- 5.1. Market Analysis, Insights and Forecast - by Application
- 5.1.1. Environmental Protection Agencies
- 5.1.2. Agriculture
- 5.1.3. Industrial Enterprises
- 5.1.4. Other
- 5.2. Market Analysis, Insights and Forecast - by Types
- 5.2.1. Service
- 5.2.2. Device
- 5.3. Market Analysis, Insights and Forecast - by Region
- 5.3.1. North America
- 5.3.2. South America
- 5.3.3. Europe
- 5.3.4. Middle East & Africa
- 5.3.5. Asia Pacific
- 5.1. Market Analysis, Insights and Forecast - by Application
- 6. Global Soil Pollution Detection Analysis, Insights and Forecast, 2021-2033
- 6.1. Market Analysis, Insights and Forecast - by Application
- 6.1.1. Environmental Protection Agencies
- 6.1.2. Agriculture
- 6.1.3. Industrial Enterprises
- 6.1.4. Other
- 6.2. Market Analysis, Insights and Forecast - by Types
- 6.2.1. Service
- 6.2.2. Device
- 6.1. Market Analysis, Insights and Forecast - by Application
- 7. North America Soil Pollution Detection Analysis, Insights and Forecast, 2020-2032
- 7.1. Market Analysis, Insights and Forecast - by Application
- 7.1.1. Environmental Protection Agencies
- 7.1.2. Agriculture
- 7.1.3. Industrial Enterprises
- 7.1.4. Other
- 7.2. Market Analysis, Insights and Forecast - by Types
- 7.2.1. Service
- 7.2.2. Device
- 7.1. Market Analysis, Insights and Forecast - by Application
- 8. South America Soil Pollution Detection Analysis, Insights and Forecast, 2020-2032
- 8.1. Market Analysis, Insights and Forecast - by Application
- 8.1.1. Environmental Protection Agencies
- 8.1.2. Agriculture
- 8.1.3. Industrial Enterprises
- 8.1.4. Other
- 8.2. Market Analysis, Insights and Forecast - by Types
- 8.2.1. Service
- 8.2.2. Device
- 8.1. Market Analysis, Insights and Forecast - by Application
- 9. Europe Soil Pollution Detection Analysis, Insights and Forecast, 2020-2032
- 9.1. Market Analysis, Insights and Forecast - by Application
- 9.1.1. Environmental Protection Agencies
- 9.1.2. Agriculture
- 9.1.3. Industrial Enterprises
- 9.1.4. Other
- 9.2. Market Analysis, Insights and Forecast - by Types
- 9.2.1. Service
- 9.2.2. Device
- 9.1. Market Analysis, Insights and Forecast - by Application
- 10. Middle East & Africa Soil Pollution Detection Analysis, Insights and Forecast, 2020-2032
- 10.1. Market Analysis, Insights and Forecast - by Application
- 10.1.1. Environmental Protection Agencies
- 10.1.2. Agriculture
- 10.1.3. Industrial Enterprises
- 10.1.4. Other
- 10.2. Market Analysis, Insights and Forecast - by Types
- 10.2.1. Service
- 10.2.2. Device
- 10.1. Market Analysis, Insights and Forecast - by Application
- 11. Asia Pacific Soil Pollution Detection Analysis, Insights and Forecast, 2020-2032
- 11.1. Market Analysis, Insights and Forecast - by Application
- 11.1.1. Environmental Protection Agencies
- 11.1.2. Agriculture
- 11.1.3. Industrial Enterprises
- 11.1.4. Other
- 11.2. Market Analysis, Insights and Forecast - by Types
- 11.2.1. Service
- 11.2.2. Device
- 11.1. Market Analysis, Insights and Forecast - by Application
- 12. Competitive Analysis
- 12.1. Company Profiles
- 12.1.1 EHS Care
- 12.1.1.1. Company Overview
- 12.1.1.2. Products
- 12.1.1.3. Company Financials
- 12.1.1.4. SWOT Analysis
- 12.1.2 PerkinElmer
- 12.1.2.1. Company Overview
- 12.1.2.2. Products
- 12.1.2.3. Company Financials
- 12.1.2.4. SWOT Analysis
- 12.1.3 Thermo Fisher Scientific
- 12.1.3.1. Company Overview
- 12.1.3.2. Products
- 12.1.3.3. Company Financials
- 12.1.3.4. SWOT Analysis
- 12.1.4 SGS
- 12.1.4.1. Company Overview
- 12.1.4.2. Products
- 12.1.4.3. Company Financials
- 12.1.4.4. SWOT Analysis
- 12.1.5 Asia Environmental Technical
- 12.1.5.1. Company Overview
- 12.1.5.2. Products
- 12.1.5.3. Company Financials
- 12.1.5.4. SWOT Analysis
- 12.1.6 Cirs
- 12.1.6.1. Company Overview
- 12.1.6.2. Products
- 12.1.6.3. Company Financials
- 12.1.6.4. SWOT Analysis
- 12.1.7 AEM Laboratory
- 12.1.7.1. Company Overview
- 12.1.7.2. Products
- 12.1.7.3. Company Financials
- 12.1.7.4. SWOT Analysis
- 12.1.8 RayKol
- 12.1.8.1. Company Overview
- 12.1.8.2. Products
- 12.1.8.3. Company Financials
- 12.1.8.4. SWOT Analysis
- 12.1.1 EHS Care
- 12.2. Market Entropy
- 12.2.1 Company's Key Areas Served
- 12.2.2 Recent Developments
- 12.3. Company Market Share Analysis 2025
- 12.3.1 Top 5 Companies Market Share Analysis
- 12.3.2 Top 3 Companies Market Share Analysis
- 12.4. List of Potential Customers
- 13. Research Methodology
List of Figures
- Figure 1: Global Soil Pollution Detection Revenue Breakdown (billion, %) by Region 2025 & 2033
- Figure 2: North America Soil Pollution Detection Revenue (billion), by Application 2025 & 2033
- Figure 3: North America Soil Pollution Detection Revenue Share (%), by Application 2025 & 2033
- Figure 4: North America Soil Pollution Detection Revenue (billion), by Types 2025 & 2033
- Figure 5: North America Soil Pollution Detection Revenue Share (%), by Types 2025 & 2033
- Figure 6: North America Soil Pollution Detection Revenue (billion), by Country 2025 & 2033
- Figure 7: North America Soil Pollution Detection Revenue Share (%), by Country 2025 & 2033
- Figure 8: South America Soil Pollution Detection Revenue (billion), by Application 2025 & 2033
- Figure 9: South America Soil Pollution Detection Revenue Share (%), by Application 2025 & 2033
- Figure 10: South America Soil Pollution Detection Revenue (billion), by Types 2025 & 2033
- Figure 11: South America Soil Pollution Detection Revenue Share (%), by Types 2025 & 2033
- Figure 12: South America Soil Pollution Detection Revenue (billion), by Country 2025 & 2033
- Figure 13: South America Soil Pollution Detection Revenue Share (%), by Country 2025 & 2033
- Figure 14: Europe Soil Pollution Detection Revenue (billion), by Application 2025 & 2033
- Figure 15: Europe Soil Pollution Detection Revenue Share (%), by Application 2025 & 2033
- Figure 16: Europe Soil Pollution Detection Revenue (billion), by Types 2025 & 2033
- Figure 17: Europe Soil Pollution Detection Revenue Share (%), by Types 2025 & 2033
- Figure 18: Europe Soil Pollution Detection Revenue (billion), by Country 2025 & 2033
- Figure 19: Europe Soil Pollution Detection Revenue Share (%), by Country 2025 & 2033
- Figure 20: Middle East & Africa Soil Pollution Detection Revenue (billion), by Application 2025 & 2033
- Figure 21: Middle East & Africa Soil Pollution Detection Revenue Share (%), by Application 2025 & 2033
- Figure 22: Middle East & Africa Soil Pollution Detection Revenue (billion), by Types 2025 & 2033
- Figure 23: Middle East & Africa Soil Pollution Detection Revenue Share (%), by Types 2025 & 2033
- Figure 24: Middle East & Africa Soil Pollution Detection Revenue (billion), by Country 2025 & 2033
- Figure 25: Middle East & Africa Soil Pollution Detection Revenue Share (%), by Country 2025 & 2033
- Figure 26: Asia Pacific Soil Pollution Detection Revenue (billion), by Application 2025 & 2033
- Figure 27: Asia Pacific Soil Pollution Detection Revenue Share (%), by Application 2025 & 2033
- Figure 28: Asia Pacific Soil Pollution Detection Revenue (billion), by Types 2025 & 2033
- Figure 29: Asia Pacific Soil Pollution Detection Revenue Share (%), by Types 2025 & 2033
- Figure 30: Asia Pacific Soil Pollution Detection Revenue (billion), by Country 2025 & 2033
- Figure 31: Asia Pacific Soil Pollution Detection Revenue Share (%), by Country 2025 & 2033
List of Tables
- Table 1: Global Soil Pollution Detection Revenue billion Forecast, by Application 2020 & 2033
- Table 2: Global Soil Pollution Detection Revenue billion Forecast, by Types 2020 & 2033
- Table 3: Global Soil Pollution Detection Revenue billion Forecast, by Region 2020 & 2033
- Table 4: Global Soil Pollution Detection Revenue billion Forecast, by Application 2020 & 2033
- Table 5: Global Soil Pollution Detection Revenue billion Forecast, by Types 2020 & 2033
- Table 6: Global Soil Pollution Detection Revenue billion Forecast, by Country 2020 & 2033
- Table 7: United States Soil Pollution Detection Revenue (billion) Forecast, by Application 2020 & 2033
- Table 8: Canada Soil Pollution Detection Revenue (billion) Forecast, by Application 2020 & 2033
- Table 9: Mexico Soil Pollution Detection Revenue (billion) Forecast, by Application 2020 & 2033
- Table 10: Global Soil Pollution Detection Revenue billion Forecast, by Application 2020 & 2033
- Table 11: Global Soil Pollution Detection Revenue billion Forecast, by Types 2020 & 2033
- Table 12: Global Soil Pollution Detection Revenue billion Forecast, by Country 2020 & 2033
- Table 13: Brazil Soil Pollution Detection Revenue (billion) Forecast, by Application 2020 & 2033
- Table 14: Argentina Soil Pollution Detection Revenue (billion) Forecast, by Application 2020 & 2033
- Table 15: Rest of South America Soil Pollution Detection Revenue (billion) Forecast, by Application 2020 & 2033
- Table 16: Global Soil Pollution Detection Revenue billion Forecast, by Application 2020 & 2033
- Table 17: Global Soil Pollution Detection Revenue billion Forecast, by Types 2020 & 2033
- Table 18: Global Soil Pollution Detection Revenue billion Forecast, by Country 2020 & 2033
- Table 19: United Kingdom Soil Pollution Detection Revenue (billion) Forecast, by Application 2020 & 2033
- Table 20: Germany Soil Pollution Detection Revenue (billion) Forecast, by Application 2020 & 2033
- Table 21: France Soil Pollution Detection Revenue (billion) Forecast, by Application 2020 & 2033
- Table 22: Italy Soil Pollution Detection Revenue (billion) Forecast, by Application 2020 & 2033
- Table 23: Spain Soil Pollution Detection Revenue (billion) Forecast, by Application 2020 & 2033
- Table 24: Russia Soil Pollution Detection Revenue (billion) Forecast, by Application 2020 & 2033
- Table 25: Benelux Soil Pollution Detection Revenue (billion) Forecast, by Application 2020 & 2033
- Table 26: Nordics Soil Pollution Detection Revenue (billion) Forecast, by Application 2020 & 2033
- Table 27: Rest of Europe Soil Pollution Detection Revenue (billion) Forecast, by Application 2020 & 2033
- Table 28: Global Soil Pollution Detection Revenue billion Forecast, by Application 2020 & 2033
- Table 29: Global Soil Pollution Detection Revenue billion Forecast, by Types 2020 & 2033
- Table 30: Global Soil Pollution Detection Revenue billion Forecast, by Country 2020 & 2033
- Table 31: Turkey Soil Pollution Detection Revenue (billion) Forecast, by Application 2020 & 2033
- Table 32: Israel Soil Pollution Detection Revenue (billion) Forecast, by Application 2020 & 2033
- Table 33: GCC Soil Pollution Detection Revenue (billion) Forecast, by Application 2020 & 2033
- Table 34: North Africa Soil Pollution Detection Revenue (billion) Forecast, by Application 2020 & 2033
- Table 35: South Africa Soil Pollution Detection Revenue (billion) Forecast, by Application 2020 & 2033
- Table 36: Rest of Middle East & Africa Soil Pollution Detection Revenue (billion) Forecast, by Application 2020 & 2033
- Table 37: Global Soil Pollution Detection Revenue billion Forecast, by Application 2020 & 2033
- Table 38: Global Soil Pollution Detection Revenue billion Forecast, by Types 2020 & 2033
- Table 39: Global Soil Pollution Detection Revenue billion Forecast, by Country 2020 & 2033
- Table 40: China Soil Pollution Detection Revenue (billion) Forecast, by Application 2020 & 2033
- Table 41: India Soil Pollution Detection Revenue (billion) Forecast, by Application 2020 & 2033
- Table 42: Japan Soil Pollution Detection Revenue (billion) Forecast, by Application 2020 & 2033
- Table 43: South Korea Soil Pollution Detection Revenue (billion) Forecast, by Application 2020 & 2033
- Table 44: ASEAN Soil Pollution Detection Revenue (billion) Forecast, by Application 2020 & 2033
- Table 45: Oceania Soil Pollution Detection Revenue (billion) Forecast, by Application 2020 & 2033
- Table 46: Rest of Asia Pacific Soil Pollution Detection Revenue (billion) Forecast, by Application 2020 & 2033
Frequently Asked Questions
1. What is the projected Compound Annual Growth Rate (CAGR) of the Soil Pollution Detection?
The projected CAGR is approximately 4.9%.
2. Which companies are prominent players in the Soil Pollution Detection?
Key companies in the market include EHS Care, PerkinElmer, Thermo Fisher Scientific, SGS, Asia Environmental Technical, Cirs, AEM Laboratory, RayKol.
3. What are the main segments of the Soil Pollution Detection?
The market segments include Application, Types.
4. Can you provide details about the market size?
The market size is estimated to be USD 4.3 billion as of 2022.
5. What are some drivers contributing to market growth?
N/A
6. What are the notable trends driving market growth?
N/A
7. Are there any restraints impacting market growth?
N/A
8. Can you provide examples of recent developments in the market?
N/A
9. What pricing options are available for accessing the report?
Pricing options include single-user, multi-user, and enterprise licenses priced at USD 3950.00, USD 5925.00, and USD 7900.00 respectively.
10. Is the market size provided in terms of value or volume?
The market size is provided in terms of value, measured in billion.
11. Are there any specific market keywords associated with the report?
Yes, the market keyword associated with the report is "Soil Pollution Detection," which aids in identifying and referencing the specific market segment covered.
12. How do I determine which pricing option suits my needs best?
The pricing options vary based on user requirements and access needs. Individual users may opt for single-user licenses, while businesses requiring broader access may choose multi-user or enterprise licenses for cost-effective access to the report.
13. Are there any additional resources or data provided in the Soil Pollution Detection report?
While the report offers comprehensive insights, it's advisable to review the specific contents or supplementary materials provided to ascertain if additional resources or data are available.
14. How can I stay updated on further developments or reports in the Soil Pollution Detection?
To stay informed about further developments, trends, and reports in the Soil Pollution Detection, consider subscribing to industry newsletters, following relevant companies and organizations, or regularly checking reputable industry news sources and publications.
Methodology
Step 1 - Identification of Relevant Samples Size from Population Database


Step 2 - Approaches for Defining Global Market Size (Value, Volume* & Price*)

Note*: In applicable scenarios
Step 3 - Data Sources
Primary Research
- Web Analytics
- Survey Reports
- Research Institute
- Latest Research Reports
- Opinion Leaders
Secondary Research
- Annual Reports
- White Paper
- Latest Press Release
- Industry Association
- Paid Database
- Investor Presentations

Step 4 - Data Triangulation
Involves using different sources of information in order to increase the validity of a study
These sources are likely to be stakeholders in a program - participants, other researchers, program staff, other community members, and so on.
Then we put all data in single framework & apply various statistical tools to find out the dynamic on the market.
During the analysis stage, feedback from the stakeholder groups would be compared to determine areas of agreement as well as areas of divergence