

Key Insights
The Southeast Asia cross-border e-commerce market is poised for significant expansion, driven by escalating internet and smartphone adoption, rising disposable incomes, and a youthful demographic embracing online retail. The market is projected to reach $201.92 billion by 2024, with a robust Compound Annual Growth Rate (CAGR) of 21.13%. Key growth catalysts include advancements in logistics infrastructure, the widespread adoption of mobile payment solutions, and an increasing array of international product offerings. Dominant product segments encompass fashion and apparel, consumer electronics, and home appliances, meeting the varied demands of consumers across the region. While connectivity and cross-border logistics present ongoing challenges, technological innovation and regulatory enhancements are actively addressing these hurdles. The B2C segment leads market activity, with B2B also demonstrating strong growth potential, particularly through e-procurement platforms. The competitive landscape features major players like Shopee, Lazada, and AliExpress, alongside emerging regional and local e-commerce entities. Key growth markets include Singapore, Thailand, Vietnam, Indonesia, Malaysia, and the Philippines, with broader potential across the entire Southeast Asian region. Strategic collaborations between international brands and local e-commerce platforms are instrumental for effective market entry and expansion.
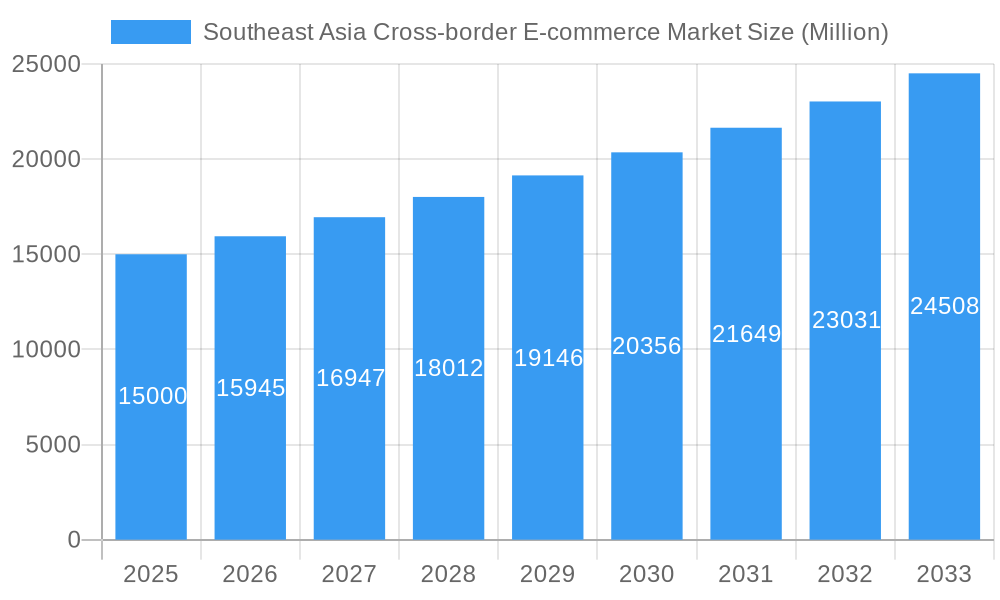
Southeast Asia Cross-border E-commerce Market Market Size (In Billion)
The projected market size underscores the substantial opportunities within Southeast Asia's digital commerce ecosystem. Continued growth will be fueled by the region's digitally adept population and expanding middle class. The interplay between global e-commerce giants and local market leaders is fostering a dynamic and competitive environment, driving innovation in logistics, payment systems, and customer experience. Success hinges on a nuanced understanding of individual market dynamics, consumer preferences, and regulatory frameworks within Southeast Asia. Sustained infrastructure development, enhanced digital literacy, and reinforced consumer confidence in secure transactions and reliable delivery services will be pivotal for future market expansion. The diverse product categories and the concurrent growth of both B2C and B2B segments offer extensive avenues for investment and strategic development in the cross-border e-commerce sector.
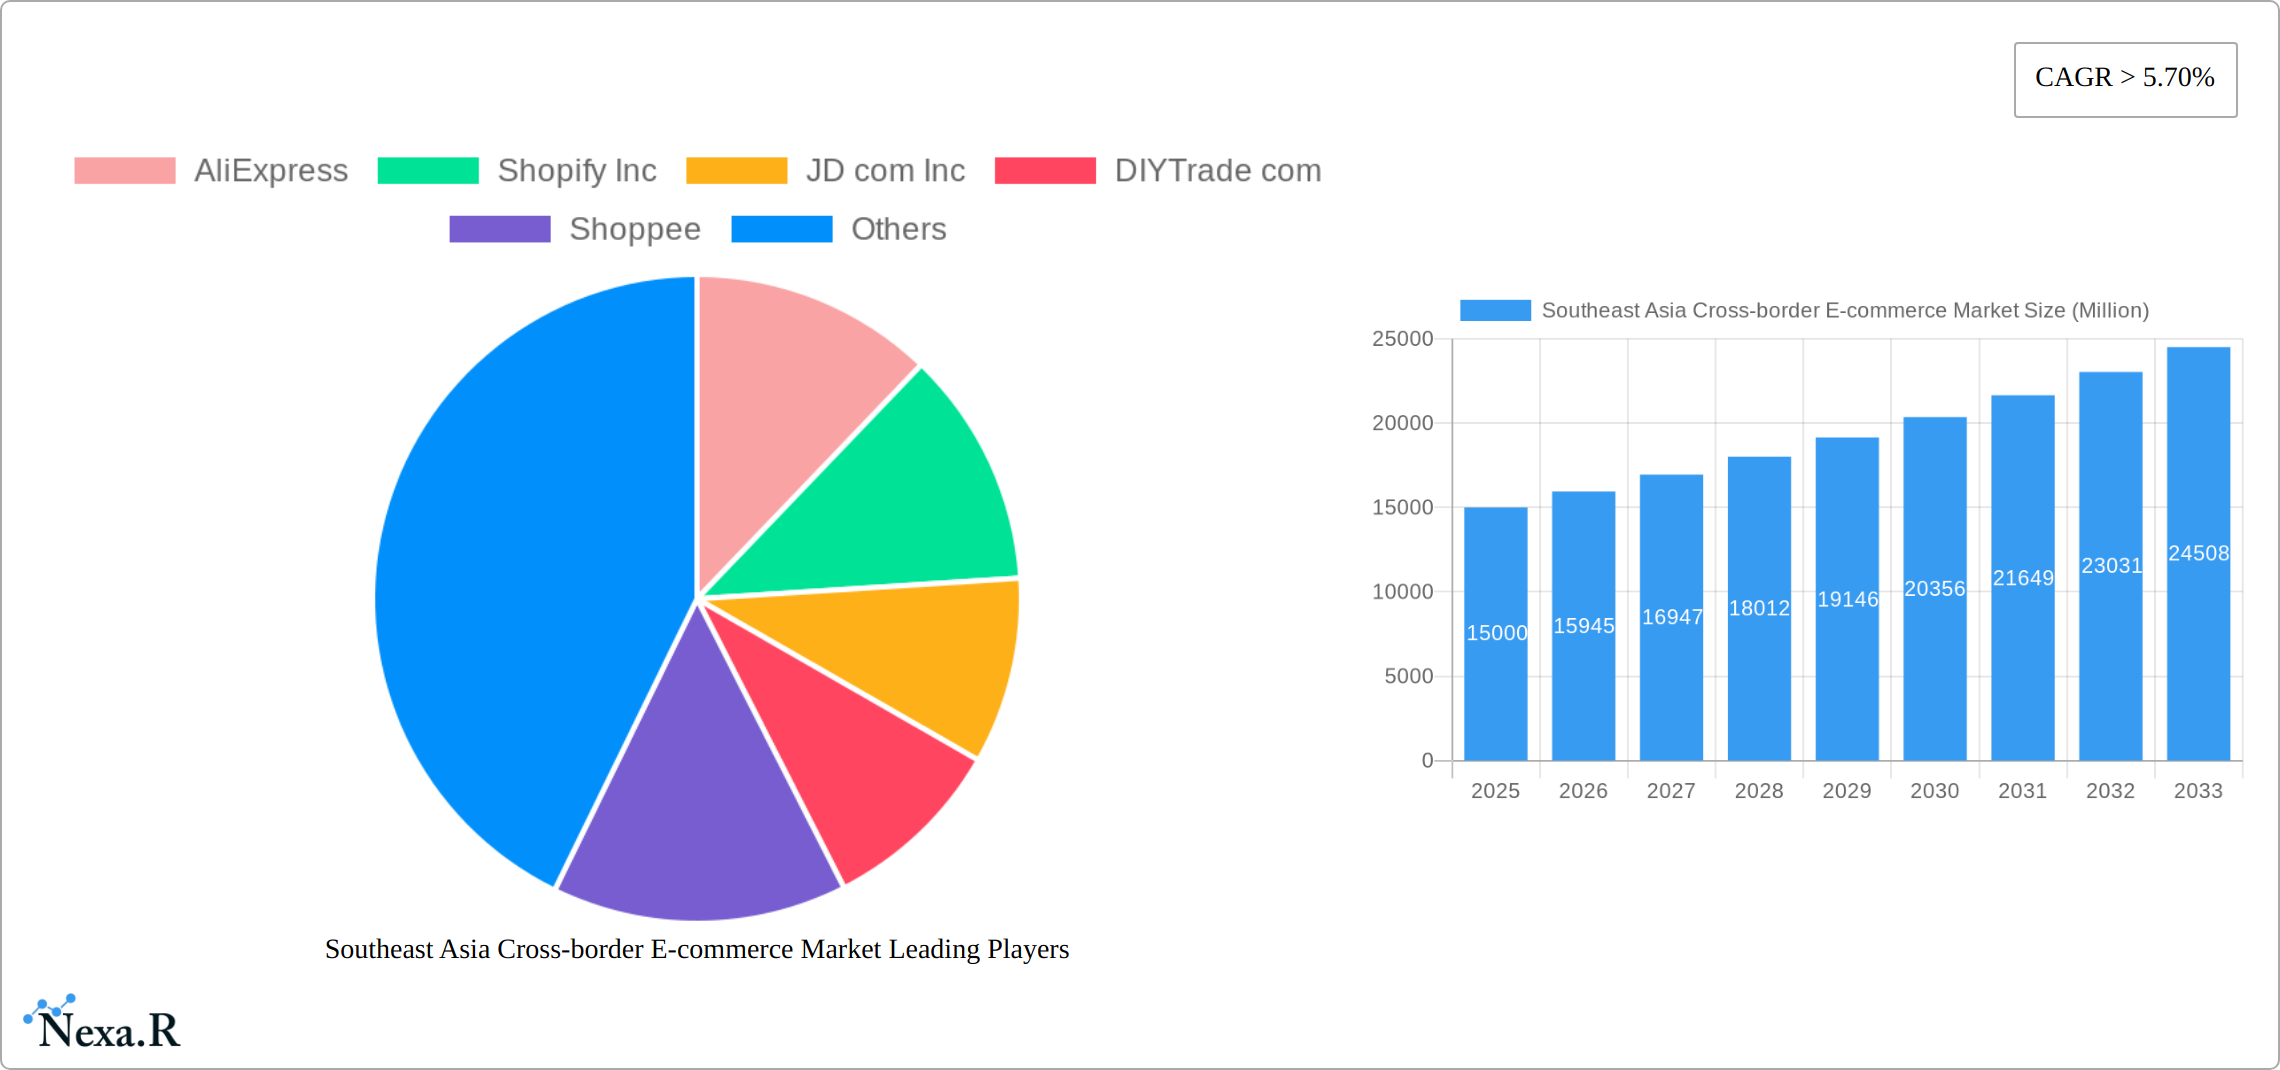
Southeast Asia Cross-border E-commerce Market Company Market Share
Southeast Asia Cross-border E-commerce Market: 2019-2033
This comprehensive report provides a detailed analysis of the Southeast Asia cross-border e-commerce market, covering the period 2019-2033. It offers invaluable insights for businesses seeking to navigate this rapidly expanding sector, encompassing market dynamics, growth trends, dominant players, and future opportunities. The report utilizes data from the historical period (2019-2024), with the base year set at 2025 and the forecast period spanning 2025-2033. Key segments analyzed include B2B and B2C businesses, with product categories encompassing Fashion and Apparel, Consumer Electronics, Home Appliances, Furniture, Beauty and Personal Care Products, and Other Products (Toys, Food Products, etc.). Geographic coverage includes Singapore, Thailand, Vietnam, Indonesia, Malaysia, Philippines, and the Rest of Southeast Asia.
Southeast Asia Cross-border E-commerce Market Dynamics & Structure
The Southeast Asia cross-border e-commerce market is characterized by high growth potential, driven by increasing internet and smartphone penetration, a burgeoning middle class, and favorable government policies. However, this dynamic landscape also presents challenges such as varying regulatory frameworks across nations and infrastructural limitations in some regions.
- Market Concentration: The market is moderately concentrated, with major players like Shopee, Lazada, and AliExpress holding significant market share, though smaller players and niche businesses continue to emerge. The estimated combined market share of the top 3 players in 2025 is xx%.
- Technological Innovation: The rapid adoption of mobile commerce, digital payment solutions (e.g., e-wallets), and logistics technologies are key innovation drivers. However, barriers exist in terms of digital literacy and internet access in certain areas.
- Regulatory Frameworks: Varying regulations across Southeast Asian countries regarding cross-border trade, data privacy, and consumer protection create complexity for businesses.
- Competitive Product Substitutes: Traditional retail channels remain strong competitors, although their market share is steadily eroding.
- End-User Demographics: The market is primarily driven by young, tech-savvy consumers in urban areas, though growth is expanding to rural populations.
- M&A Trends: The past few years have witnessed significant M&A activity, with larger players acquiring smaller companies to expand their reach and enhance capabilities (e.g., Razorpay's acquisition of Curlec). The estimated number of M&A deals in the sector from 2019 to 2024 was xx.
Southeast Asia Cross-border E-commerce Market Growth Trends & Insights
The Southeast Asia cross-border e-commerce market has experienced remarkable growth, with a Compound Annual Growth Rate (CAGR) of xx% during 2019-2024. This growth is projected to continue at a CAGR of xx% during 2025-2033, driven by factors like rising disposable incomes, increasing digital literacy, and the expansion of logistics infrastructure. Market penetration, currently at xx% in 2025, is expected to reach xx% by 2033. The shift towards mobile commerce and the adoption of innovative payment methods, such as Buy Now Pay Later (BNPL) solutions, are further accelerating market expansion. Consumer behavior is evolving towards greater online shopping frequency, driven by convenience and wider product selection. The market size in 2025 is estimated at xxx Million units, and is projected to reach xxx Million units by 2033.
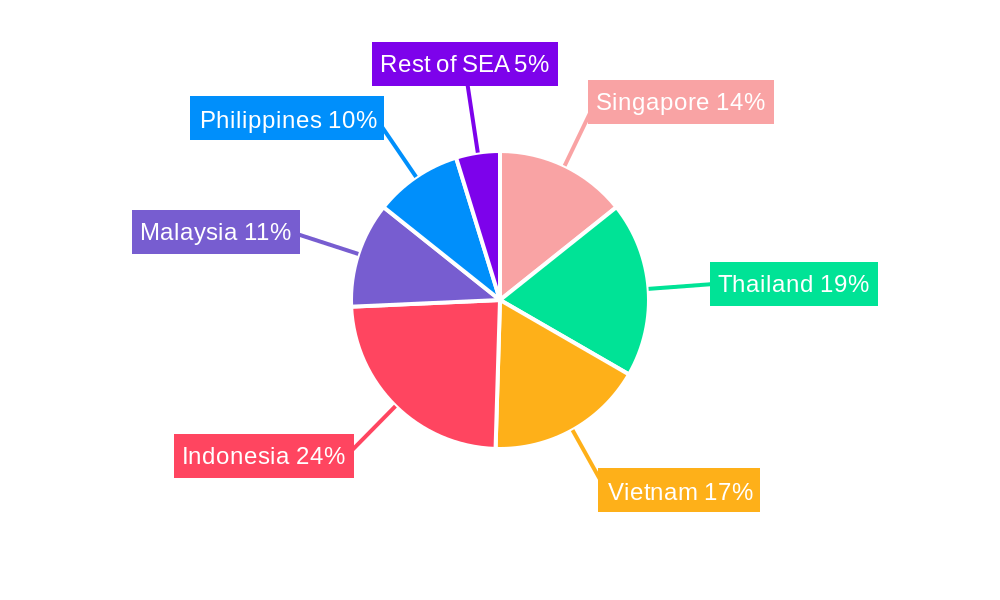
Dominant Regions, Countries, or Segments in Southeast Asia Cross-border E-commerce Market
Indonesia, followed by Vietnam and Thailand, represent the leading national markets in terms of revenue and growth potential. The B2C segment currently dominates, but the B2B sector is also experiencing significant growth. Within product categories, Fashion and Apparel and Consumer Electronics lead the market share, reflecting high consumer demand for these categories.
- Indonesia: Large population, increasing internet penetration, and a growing middle class contribute to Indonesia's dominance.
- Vietnam: Rapid economic growth, a young population, and favorable government policies fuel Vietnam's substantial growth.
- Thailand: Strong digital infrastructure and a relatively high level of digital literacy support market expansion.
- B2C: Convenience and wider product selection drive the high growth of the B2C segment.
- Fashion and Apparel, Consumer Electronics: High demand and preference for online shopping within these product categories contribute to their market leadership.
The rest of Southeast Asia also shows significant growth potential, with countries like the Philippines and Malaysia witnessing increasing adoption of e-commerce.
Southeast Asia Cross-border E-commerce Market Product Landscape
The Southeast Asian cross-border e-commerce market presents a vibrant and continuously evolving product landscape. Beyond the established categories of fashion, consumer electronics, home appliances, and personal care products, there's a growing demand for specialized items, including sustainable and eco-friendly goods, artisanal crafts, and health and wellness products. Innovation is heavily driven by sophisticated technologies aimed at enhancing the customer journey. This includes hyper-personalized recommendation engines leveraging AI, intelligent search functionalities that understand natural language, and advanced customer service solutions powered by AI-driven chatbots and virtual assistants, offering instant support. Furthermore, cutting-edge technologies like Augmented Reality (AR) and Virtual Reality (VR) are increasingly being integrated, allowing consumers to virtually try on clothes, visualize furniture in their homes, or experience products in immersive environments, thereby reducing purchase hesitation. The critical backbone of this market remains the relentless focus on optimizing logistics and delivery. Achieving same-day or next-day delivery in major urban centers, coupled with efficient last-mile solutions and transparent tracking, is paramount to fostering customer loyalty and satisfaction.
Key Drivers, Barriers & Challenges in Southeast Asia Cross-border E-commerce Market
Key Drivers:
- Increasing internet and smartphone penetration.
- Rising disposable incomes and a growing middle class.
- Favorable government policies promoting digital economy development.
- Emergence of innovative payment solutions like BNPL and e-wallets.
Key Challenges:
- Logistics and infrastructure limitations in certain regions.
- Varying regulatory frameworks and customs procedures across countries.
- Cybersecurity concerns and data privacy issues.
- Intense competition among established players and new entrants. The competition intensity is estimated at xx on a scale of 1 to 10 in 2025.
Emerging Opportunities in Southeast Asia Cross-border E-commerce Market
- Deep Dive into Rural and Underserved Markets: Beyond simply expanding reach, this involves developing tailored logistics networks, offering affordable data plans, and implementing digital literacy programs to empower rural consumers and unlock their significant purchasing potential.
- Niche Market Specialization and Personalization: Cultivating deeply specialized product categories, such as premium pet supplies, bespoke fashion accessories, or specific dietary supplements, and offering highly personalized product curation and content will attract loyal customer bases.
- Seamless Omnichannel Integration: Creating a unified customer experience where online browsing, purchasing, and in-store pickup or returns are effortlessly connected. This also includes leveraging social commerce and influencer marketing to bridge the online-offline gap.
- Strategic Adoption of Frontier Technologies: Beyond AR/VR, embracing AI for predictive analytics, supply chain optimization, and fraud detection, alongside exploring the potential of blockchain for enhanced transparency, secure payments, and supply chain traceability.
- Focus on Sustainability and Ethical Consumption: As consumer awareness grows, there's a significant opportunity in offering ethically sourced, eco-friendly, and sustainable products, coupled with transparent supply chain information.
Growth Accelerators in the Southeast Asia Cross-border E-commerce Market Industry
The rapid evolution of the Southeast Asian cross-border e-commerce landscape is propelled by a confluence of powerful accelerators. Technological advancements are at the forefront, with AI and machine learning continuously refining personalization, logistics, and customer service. Crucial to this ecosystem are strategic partnerships that foster synergy between e-commerce platforms, agile logistics providers, and innovative fintech companies. These collaborations are instrumental in streamlining payment gateways, optimizing last-mile delivery, and offering flexible financing options. Government initiatives play a pivotal role, with policies aimed at bolstering digital infrastructure, simplifying cross-border trade regulations, and promoting digital literacy creating a more conducive environment for growth. Furthermore, aggressive market expansion into secondary cities and the development of innovative business models, such as subscription services and social commerce integration, are significantly fueling the industry's upward trajectory.
Key Players Shaping the Southeast Asia Cross-border E-commerce Market Market
- AliExpress - A global retail online marketplace offering a vast array of products.
- Shopify Inc - A leading e-commerce platform enabling businesses to create and manage their online stores.
- JD.com Inc - A major Chinese e-commerce company known for its strong logistics network and focus on authentic products.
- DIYTrade.com - An online B2B marketplace connecting buyers and suppliers globally.
- Shopee - A dominant e-commerce platform in Southeast Asia, known for its mobile-centric approach and engaging user experience.
- Lazada - A leading online retailer in Southeast Asia, offering a wide range of products and focusing on convenience.
- ChinaAseanTrade.com - A platform facilitating trade between China and ASEAN countries.
- Bukalapak - A prominent Indonesian e-commerce platform, particularly strong in supporting SMEs.
- Amazon.com Inc - The global e-commerce giant, expanding its presence and offerings in Southeast Asia.
- Qoo - A Singapore-based e-commerce platform offering a diverse product selection.
- eBay Inc - A global online marketplace connecting buyers and sellers worldwide.
- Tokopedia - A leading Indonesian marketplace, offering a wide variety of goods and services.
- Alibaba Group Holding Limited - A multinational technology company specializing in e-commerce, retail, Internet, and technology, with significant operations in cross-border trade.
(List Not Exhaustive, constantly evolving with new entrants and strategies)
Notable Milestones in Southeast Asia Cross-border E-commerce Market Sector
- September 2022: Akulaku partners with Alipay+, enabling Indonesian consumers to use Akulaku PayLater at Alipay+ merchants. This expands payment options and enhances cross-border transactions.
- February 2022: Razorpay's acquisition of Curlec marks its entry into the Southeast Asian market, boosting its recurring payment solutions capabilities.
In-Depth Southeast Asia Cross-border E-commerce Market Market Outlook
The Southeast Asia cross-border e-commerce market is poised for sustained growth, fueled by ongoing technological advancements, expanding digital infrastructure, and increasing consumer adoption. Strategic partnerships, innovative business models, and government support will further drive market expansion. Opportunities abound for businesses that can effectively leverage technology, cater to evolving consumer preferences, and navigate the regulatory landscape. The market's long-term potential is significant, presenting lucrative prospects for both established players and new entrants.
Southeast Asia Cross-border E-commerce Market Segmentation
-
1. Business
- 1.1. B2B
- 1.2. B2C
-
2. Product
- 2.1. Fashion and Apparel
- 2.2. Consumer Electronics
- 2.3. Home Appliances
- 2.4. Furniture
- 2.5. Beauty and Personal Care Products
- 2.6. Other Products (Toys, Food Products, etc.)
Southeast Asia Cross-border E-commerce Market Segmentation By Geography
-
1. North America
- 1.1. United States
- 1.2. Canada
- 1.3. Mexico
-
2. South America
- 2.1. Brazil
- 2.2. Argentina
- 2.3. Rest of South America
-
3. Europe
- 3.1. United Kingdom
- 3.2. Germany
- 3.3. France
- 3.4. Italy
- 3.5. Spain
- 3.6. Russia
- 3.7. Benelux
- 3.8. Nordics
- 3.9. Rest of Europe
-
4. Middle East & Africa
- 4.1. Turkey
- 4.2. Israel
- 4.3. GCC
- 4.4. North Africa
- 4.5. South Africa
- 4.6. Rest of Middle East & Africa
-
5. Asia Pacific
- 5.1. China
- 5.2. India
- 5.3. Japan
- 5.4. South Korea
- 5.5. ASEAN
- 5.6. Oceania
- 5.7. Rest of Asia Pacific
Southeast Asia Cross-border E-commerce Market Regional Market Share
Geographic Coverage of Southeast Asia Cross-border E-commerce Market
Southeast Asia Cross-border E-commerce Market REPORT HIGHLIGHTS
| Aspects | Details |
|---|---|
| Study Period | 2020-2034 |
| Base Year | 2025 |
| Estimated Year | 2026 |
| Forecast Period | 2026-2034 |
| Historical Period | 2020-2025 |
| Growth Rate | CAGR of 21.13% from 2020-2034 |
| Segmentation |
|
Table of Contents
- 1. Introduction
- 1.1. Research Scope
- 1.2. Market Segmentation
- 1.3. Research Objective
- 1.4. Definitions and Assumptions
- 2. Executive Summary
- 2.1. Market Snapshot
- 3. Market Dynamics
- 3.1. Market Drivers
- 3.2. Market Restrains
- 3.3. Market Trends
- 3.4. Market Opportunities
- 4. Market Factor Analysis
- 4.1. Porters Five Forces
- 4.1.1. Bargaining Power of Suppliers
- 4.1.2. Bargaining Power of Buyers
- 4.1.3. Threat of New Entrants
- 4.1.4. Threat of Substitutes
- 4.1.5. Competitive Rivalry
- 4.2. PESTEL analysis
- 4.3. BCG Analysis
- 4.3.1. Stars (High Growth, High Market Share)
- 4.3.2. Cash Cows (Low Growth, High Market Share)
- 4.3.3. Question Mark (High Growth, Low Market Share)
- 4.3.4. Dogs (Low Growth, Low Market Share)
- 4.4. Ansoff Matrix Analysis
- 4.5. Supply Chain Analysis
- 4.6. Regulatory Landscape
- 4.7. Current Market Potential and Opportunity Assessment (TAM–SAM–SOM Framework)
- 4.8. NRP Analyst Note
- 4.1. Porters Five Forces
- 5. Market Analysis, Insights and Forecast 2021-2033
- 5.1. Market Analysis, Insights and Forecast - by Business
- 5.1.1. B2B
- 5.1.2. B2C
- 5.2. Market Analysis, Insights and Forecast - by Product
- 5.2.1. Fashion and Apparel
- 5.2.2. Consumer Electronics
- 5.2.3. Home Appliances
- 5.2.4. Furniture
- 5.2.5. Beauty and Personal Care Products
- 5.2.6. Other Products (Toys, Food Products, etc.)
- 5.3. Market Analysis, Insights and Forecast - by Region
- 5.3.1. North America
- 5.3.2. South America
- 5.3.3. Europe
- 5.3.4. Middle East & Africa
- 5.3.5. Asia Pacific
- 5.1. Market Analysis, Insights and Forecast - by Business
- 6. Global Southeast Asia Cross-border E-commerce Market Analysis, Insights and Forecast, 2021-2033
- 6.1. Market Analysis, Insights and Forecast - by Business
- 6.1.1. B2B
- 6.1.2. B2C
- 6.2. Market Analysis, Insights and Forecast - by Product
- 6.2.1. Fashion and Apparel
- 6.2.2. Consumer Electronics
- 6.2.3. Home Appliances
- 6.2.4. Furniture
- 6.2.5. Beauty and Personal Care Products
- 6.2.6. Other Products (Toys, Food Products, etc.)
- 6.1. Market Analysis, Insights and Forecast - by Business
- 7. North America Southeast Asia Cross-border E-commerce Market Analysis, Insights and Forecast, 2020-2032
- 7.1. Market Analysis, Insights and Forecast - by Business
- 7.1.1. B2B
- 7.1.2. B2C
- 7.2. Market Analysis, Insights and Forecast - by Product
- 7.2.1. Fashion and Apparel
- 7.2.2. Consumer Electronics
- 7.2.3. Home Appliances
- 7.2.4. Furniture
- 7.2.5. Beauty and Personal Care Products
- 7.2.6. Other Products (Toys, Food Products, etc.)
- 7.1. Market Analysis, Insights and Forecast - by Business
- 8. South America Southeast Asia Cross-border E-commerce Market Analysis, Insights and Forecast, 2020-2032
- 8.1. Market Analysis, Insights and Forecast - by Business
- 8.1.1. B2B
- 8.1.2. B2C
- 8.2. Market Analysis, Insights and Forecast - by Product
- 8.2.1. Fashion and Apparel
- 8.2.2. Consumer Electronics
- 8.2.3. Home Appliances
- 8.2.4. Furniture
- 8.2.5. Beauty and Personal Care Products
- 8.2.6. Other Products (Toys, Food Products, etc.)
- 8.1. Market Analysis, Insights and Forecast - by Business
- 9. Europe Southeast Asia Cross-border E-commerce Market Analysis, Insights and Forecast, 2020-2032
- 9.1. Market Analysis, Insights and Forecast - by Business
- 9.1.1. B2B
- 9.1.2. B2C
- 9.2. Market Analysis, Insights and Forecast - by Product
- 9.2.1. Fashion and Apparel
- 9.2.2. Consumer Electronics
- 9.2.3. Home Appliances
- 9.2.4. Furniture
- 9.2.5. Beauty and Personal Care Products
- 9.2.6. Other Products (Toys, Food Products, etc.)
- 9.1. Market Analysis, Insights and Forecast - by Business
- 10. Middle East & Africa Southeast Asia Cross-border E-commerce Market Analysis, Insights and Forecast, 2020-2032
- 10.1. Market Analysis, Insights and Forecast - by Business
- 10.1.1. B2B
- 10.1.2. B2C
- 10.2. Market Analysis, Insights and Forecast - by Product
- 10.2.1. Fashion and Apparel
- 10.2.2. Consumer Electronics
- 10.2.3. Home Appliances
- 10.2.4. Furniture
- 10.2.5. Beauty and Personal Care Products
- 10.2.6. Other Products (Toys, Food Products, etc.)
- 10.1. Market Analysis, Insights and Forecast - by Business
- 11. Asia Pacific Southeast Asia Cross-border E-commerce Market Analysis, Insights and Forecast, 2020-2032
- 11.1. Market Analysis, Insights and Forecast - by Business
- 11.1.1. B2B
- 11.1.2. B2C
- 11.2. Market Analysis, Insights and Forecast - by Product
- 11.2.1. Fashion and Apparel
- 11.2.2. Consumer Electronics
- 11.2.3. Home Appliances
- 11.2.4. Furniture
- 11.2.5. Beauty and Personal Care Products
- 11.2.6. Other Products (Toys, Food Products, etc.)
- 11.1. Market Analysis, Insights and Forecast - by Business
- 12. Competitive Analysis
- 12.1. Company Profiles
- 12.1.1 AliExpress
- 12.1.1.1. Company Overview
- 12.1.1.2. Products
- 12.1.1.3. Company Financials
- 12.1.1.4. SWOT Analysis
- 12.1.2 Shopify Inc
- 12.1.2.1. Company Overview
- 12.1.2.2. Products
- 12.1.2.3. Company Financials
- 12.1.2.4. SWOT Analysis
- 12.1.3 JD com Inc
- 12.1.3.1. Company Overview
- 12.1.3.2. Products
- 12.1.3.3. Company Financials
- 12.1.3.4. SWOT Analysis
- 12.1.4 DIYTrade com
- 12.1.4.1. Company Overview
- 12.1.4.2. Products
- 12.1.4.3. Company Financials
- 12.1.4.4. SWOT Analysis
- 12.1.5 Shoppee
- 12.1.5.1. Company Overview
- 12.1.5.2. Products
- 12.1.5.3. Company Financials
- 12.1.5.4. SWOT Analysis
- 12.1.6 Lazada
- 12.1.6.1. Company Overview
- 12.1.6.2. Products
- 12.1.6.3. Company Financials
- 12.1.6.4. SWOT Analysis
- 12.1.7 ChinaAseanTrade com
- 12.1.7.1. Company Overview
- 12.1.7.2. Products
- 12.1.7.3. Company Financials
- 12.1.7.4. SWOT Analysis
- 12.1.8 Bukalapak
- 12.1.8.1. Company Overview
- 12.1.8.2. Products
- 12.1.8.3. Company Financials
- 12.1.8.4. SWOT Analysis
- 12.1.9 Amazon com Inc
- 12.1.9.1. Company Overview
- 12.1.9.2. Products
- 12.1.9.3. Company Financials
- 12.1.9.4. SWOT Analysis
- 12.1.10 Qoo
- 12.1.10.1. Company Overview
- 12.1.10.2. Products
- 12.1.10.3. Company Financials
- 12.1.10.4. SWOT Analysis
- 12.1.11 eBay Inc
- 12.1.11.1. Company Overview
- 12.1.11.2. Products
- 12.1.11.3. Company Financials
- 12.1.11.4. SWOT Analysis
- 12.1.12 Tokopedia
- 12.1.12.1. Company Overview
- 12.1.12.2. Products
- 12.1.12.3. Company Financials
- 12.1.12.4. SWOT Analysis
- 12.1.13 Alibaba Group Holding Limited **List Not Exhaustive
- 12.1.13.1. Company Overview
- 12.1.13.2. Products
- 12.1.13.3. Company Financials
- 12.1.13.4. SWOT Analysis
- 12.1.1 AliExpress
- 12.2. Market Entropy
- 12.2.1 Company's Key Areas Served
- 12.2.2 Recent Developments
- 12.3. Company Market Share Analysis 2025
- 12.3.1 Top 5 Companies Market Share Analysis
- 12.3.2 Top 3 Companies Market Share Analysis
- 12.4. List of Potential Customers
- 13. Research Methodology
List of Figures
- Figure 1: Global Southeast Asia Cross-border E-commerce Market Revenue Breakdown (billion, %) by Region 2025 & 2033
- Figure 2: North America Southeast Asia Cross-border E-commerce Market Revenue (billion), by Business 2025 & 2033
- Figure 3: North America Southeast Asia Cross-border E-commerce Market Revenue Share (%), by Business 2025 & 2033
- Figure 4: North America Southeast Asia Cross-border E-commerce Market Revenue (billion), by Product 2025 & 2033
- Figure 5: North America Southeast Asia Cross-border E-commerce Market Revenue Share (%), by Product 2025 & 2033
- Figure 6: North America Southeast Asia Cross-border E-commerce Market Revenue (billion), by Country 2025 & 2033
- Figure 7: North America Southeast Asia Cross-border E-commerce Market Revenue Share (%), by Country 2025 & 2033
- Figure 8: South America Southeast Asia Cross-border E-commerce Market Revenue (billion), by Business 2025 & 2033
- Figure 9: South America Southeast Asia Cross-border E-commerce Market Revenue Share (%), by Business 2025 & 2033
- Figure 10: South America Southeast Asia Cross-border E-commerce Market Revenue (billion), by Product 2025 & 2033
- Figure 11: South America Southeast Asia Cross-border E-commerce Market Revenue Share (%), by Product 2025 & 2033
- Figure 12: South America Southeast Asia Cross-border E-commerce Market Revenue (billion), by Country 2025 & 2033
- Figure 13: South America Southeast Asia Cross-border E-commerce Market Revenue Share (%), by Country 2025 & 2033
- Figure 14: Europe Southeast Asia Cross-border E-commerce Market Revenue (billion), by Business 2025 & 2033
- Figure 15: Europe Southeast Asia Cross-border E-commerce Market Revenue Share (%), by Business 2025 & 2033
- Figure 16: Europe Southeast Asia Cross-border E-commerce Market Revenue (billion), by Product 2025 & 2033
- Figure 17: Europe Southeast Asia Cross-border E-commerce Market Revenue Share (%), by Product 2025 & 2033
- Figure 18: Europe Southeast Asia Cross-border E-commerce Market Revenue (billion), by Country 2025 & 2033
- Figure 19: Europe Southeast Asia Cross-border E-commerce Market Revenue Share (%), by Country 2025 & 2033
- Figure 20: Middle East & Africa Southeast Asia Cross-border E-commerce Market Revenue (billion), by Business 2025 & 2033
- Figure 21: Middle East & Africa Southeast Asia Cross-border E-commerce Market Revenue Share (%), by Business 2025 & 2033
- Figure 22: Middle East & Africa Southeast Asia Cross-border E-commerce Market Revenue (billion), by Product 2025 & 2033
- Figure 23: Middle East & Africa Southeast Asia Cross-border E-commerce Market Revenue Share (%), by Product 2025 & 2033
- Figure 24: Middle East & Africa Southeast Asia Cross-border E-commerce Market Revenue (billion), by Country 2025 & 2033
- Figure 25: Middle East & Africa Southeast Asia Cross-border E-commerce Market Revenue Share (%), by Country 2025 & 2033
- Figure 26: Asia Pacific Southeast Asia Cross-border E-commerce Market Revenue (billion), by Business 2025 & 2033
- Figure 27: Asia Pacific Southeast Asia Cross-border E-commerce Market Revenue Share (%), by Business 2025 & 2033
- Figure 28: Asia Pacific Southeast Asia Cross-border E-commerce Market Revenue (billion), by Product 2025 & 2033
- Figure 29: Asia Pacific Southeast Asia Cross-border E-commerce Market Revenue Share (%), by Product 2025 & 2033
- Figure 30: Asia Pacific Southeast Asia Cross-border E-commerce Market Revenue (billion), by Country 2025 & 2033
- Figure 31: Asia Pacific Southeast Asia Cross-border E-commerce Market Revenue Share (%), by Country 2025 & 2033
List of Tables
- Table 1: Global Southeast Asia Cross-border E-commerce Market Revenue billion Forecast, by Business 2020 & 2033
- Table 2: Global Southeast Asia Cross-border E-commerce Market Revenue billion Forecast, by Product 2020 & 2033
- Table 3: Global Southeast Asia Cross-border E-commerce Market Revenue billion Forecast, by Region 2020 & 2033
- Table 4: Global Southeast Asia Cross-border E-commerce Market Revenue billion Forecast, by Business 2020 & 2033
- Table 5: Global Southeast Asia Cross-border E-commerce Market Revenue billion Forecast, by Product 2020 & 2033
- Table 6: Global Southeast Asia Cross-border E-commerce Market Revenue billion Forecast, by Country 2020 & 2033
- Table 7: United States Southeast Asia Cross-border E-commerce Market Revenue (billion) Forecast, by Application 2020 & 2033
- Table 8: Canada Southeast Asia Cross-border E-commerce Market Revenue (billion) Forecast, by Application 2020 & 2033
- Table 9: Mexico Southeast Asia Cross-border E-commerce Market Revenue (billion) Forecast, by Application 2020 & 2033
- Table 10: Global Southeast Asia Cross-border E-commerce Market Revenue billion Forecast, by Business 2020 & 2033
- Table 11: Global Southeast Asia Cross-border E-commerce Market Revenue billion Forecast, by Product 2020 & 2033
- Table 12: Global Southeast Asia Cross-border E-commerce Market Revenue billion Forecast, by Country 2020 & 2033
- Table 13: Brazil Southeast Asia Cross-border E-commerce Market Revenue (billion) Forecast, by Application 2020 & 2033
- Table 14: Argentina Southeast Asia Cross-border E-commerce Market Revenue (billion) Forecast, by Application 2020 & 2033
- Table 15: Rest of South America Southeast Asia Cross-border E-commerce Market Revenue (billion) Forecast, by Application 2020 & 2033
- Table 16: Global Southeast Asia Cross-border E-commerce Market Revenue billion Forecast, by Business 2020 & 2033
- Table 17: Global Southeast Asia Cross-border E-commerce Market Revenue billion Forecast, by Product 2020 & 2033
- Table 18: Global Southeast Asia Cross-border E-commerce Market Revenue billion Forecast, by Country 2020 & 2033
- Table 19: United Kingdom Southeast Asia Cross-border E-commerce Market Revenue (billion) Forecast, by Application 2020 & 2033
- Table 20: Germany Southeast Asia Cross-border E-commerce Market Revenue (billion) Forecast, by Application 2020 & 2033
- Table 21: France Southeast Asia Cross-border E-commerce Market Revenue (billion) Forecast, by Application 2020 & 2033
- Table 22: Italy Southeast Asia Cross-border E-commerce Market Revenue (billion) Forecast, by Application 2020 & 2033
- Table 23: Spain Southeast Asia Cross-border E-commerce Market Revenue (billion) Forecast, by Application 2020 & 2033
- Table 24: Russia Southeast Asia Cross-border E-commerce Market Revenue (billion) Forecast, by Application 2020 & 2033
- Table 25: Benelux Southeast Asia Cross-border E-commerce Market Revenue (billion) Forecast, by Application 2020 & 2033
- Table 26: Nordics Southeast Asia Cross-border E-commerce Market Revenue (billion) Forecast, by Application 2020 & 2033
- Table 27: Rest of Europe Southeast Asia Cross-border E-commerce Market Revenue (billion) Forecast, by Application 2020 & 2033
- Table 28: Global Southeast Asia Cross-border E-commerce Market Revenue billion Forecast, by Business 2020 & 2033
- Table 29: Global Southeast Asia Cross-border E-commerce Market Revenue billion Forecast, by Product 2020 & 2033
- Table 30: Global Southeast Asia Cross-border E-commerce Market Revenue billion Forecast, by Country 2020 & 2033
- Table 31: Turkey Southeast Asia Cross-border E-commerce Market Revenue (billion) Forecast, by Application 2020 & 2033
- Table 32: Israel Southeast Asia Cross-border E-commerce Market Revenue (billion) Forecast, by Application 2020 & 2033
- Table 33: GCC Southeast Asia Cross-border E-commerce Market Revenue (billion) Forecast, by Application 2020 & 2033
- Table 34: North Africa Southeast Asia Cross-border E-commerce Market Revenue (billion) Forecast, by Application 2020 & 2033
- Table 35: South Africa Southeast Asia Cross-border E-commerce Market Revenue (billion) Forecast, by Application 2020 & 2033
- Table 36: Rest of Middle East & Africa Southeast Asia Cross-border E-commerce Market Revenue (billion) Forecast, by Application 2020 & 2033
- Table 37: Global Southeast Asia Cross-border E-commerce Market Revenue billion Forecast, by Business 2020 & 2033
- Table 38: Global Southeast Asia Cross-border E-commerce Market Revenue billion Forecast, by Product 2020 & 2033
- Table 39: Global Southeast Asia Cross-border E-commerce Market Revenue billion Forecast, by Country 2020 & 2033
- Table 40: China Southeast Asia Cross-border E-commerce Market Revenue (billion) Forecast, by Application 2020 & 2033
- Table 41: India Southeast Asia Cross-border E-commerce Market Revenue (billion) Forecast, by Application 2020 & 2033
- Table 42: Japan Southeast Asia Cross-border E-commerce Market Revenue (billion) Forecast, by Application 2020 & 2033
- Table 43: South Korea Southeast Asia Cross-border E-commerce Market Revenue (billion) Forecast, by Application 2020 & 2033
- Table 44: ASEAN Southeast Asia Cross-border E-commerce Market Revenue (billion) Forecast, by Application 2020 & 2033
- Table 45: Oceania Southeast Asia Cross-border E-commerce Market Revenue (billion) Forecast, by Application 2020 & 2033
- Table 46: Rest of Asia Pacific Southeast Asia Cross-border E-commerce Market Revenue (billion) Forecast, by Application 2020 & 2033
Frequently Asked Questions
1. What is the projected Compound Annual Growth Rate (CAGR) of the Southeast Asia Cross-border E-commerce Market?
The projected CAGR is approximately 21.13%.
2. Which companies are prominent players in the Southeast Asia Cross-border E-commerce Market?
Key companies in the market include AliExpress, Shopify Inc, JD com Inc, DIYTrade com, Shoppee, Lazada, ChinaAseanTrade com, Bukalapak, Amazon com Inc, Qoo, eBay Inc, Tokopedia, Alibaba Group Holding Limited **List Not Exhaustive.
3. What are the main segments of the Southeast Asia Cross-border E-commerce Market?
The market segments include Business, Product.
4. Can you provide details about the market size?
The market size is estimated to be USD 201.92 billion as of 2022.
5. What are some drivers contributing to market growth?
4.; Increasing International Trade Driving the Market4.; Increasing online users driving the market.
6. What are the notable trends driving market growth?
Growth in E-commerce sector in the region driving the market.
7. Are there any restraints impacting market growth?
4.; Regulatory Compliance Affecting the Market4.; High Competition in the Market.
8. Can you provide examples of recent developments in the market?
September 2022: Akulaku, a leading Southeast Asian banking and digital finance platform announced a partnership with Alipay+ that will allow Indonesian consumers to use its BNPL solution Akulaku PayLater at Alipay+'s global merchants. Alipay+, a suite of global cross-border digital payments and marketing solutions, will now support Akulaku PayLater, and merchants will be able to accept Akulaku PayLater as a payment method.
9. What pricing options are available for accessing the report?
Pricing options include single-user, multi-user, and enterprise licenses priced at USD 4750, USD 4950, and USD 6800 respectively.
10. Is the market size provided in terms of value or volume?
The market size is provided in terms of value, measured in billion.
11. Are there any specific market keywords associated with the report?
Yes, the market keyword associated with the report is "Southeast Asia Cross-border E-commerce Market," which aids in identifying and referencing the specific market segment covered.
12. How do I determine which pricing option suits my needs best?
The pricing options vary based on user requirements and access needs. Individual users may opt for single-user licenses, while businesses requiring broader access may choose multi-user or enterprise licenses for cost-effective access to the report.
13. Are there any additional resources or data provided in the Southeast Asia Cross-border E-commerce Market report?
While the report offers comprehensive insights, it's advisable to review the specific contents or supplementary materials provided to ascertain if additional resources or data are available.
14. How can I stay updated on further developments or reports in the Southeast Asia Cross-border E-commerce Market?
To stay informed about further developments, trends, and reports in the Southeast Asia Cross-border E-commerce Market, consider subscribing to industry newsletters, following relevant companies and organizations, or regularly checking reputable industry news sources and publications.
Methodology
Step 1 - Identification of Relevant Samples Size from Population Database


Step 2 - Approaches for Defining Global Market Size (Value, Volume* & Price*)

Note*: In applicable scenarios
Step 3 - Data Sources
Primary Research
- Web Analytics
- Survey Reports
- Research Institute
- Latest Research Reports
- Opinion Leaders
Secondary Research
- Annual Reports
- White Paper
- Latest Press Release
- Industry Association
- Paid Database
- Investor Presentations

Step 4 - Data Triangulation
Involves using different sources of information in order to increase the validity of a study
These sources are likely to be stakeholders in a program - participants, other researchers, program staff, other community members, and so on.
Then we put all data in single framework & apply various statistical tools to find out the dynamic on the market.
During the analysis stage, feedback from the stakeholder groups would be compared to determine areas of agreement as well as areas of divergence