

Key Insights
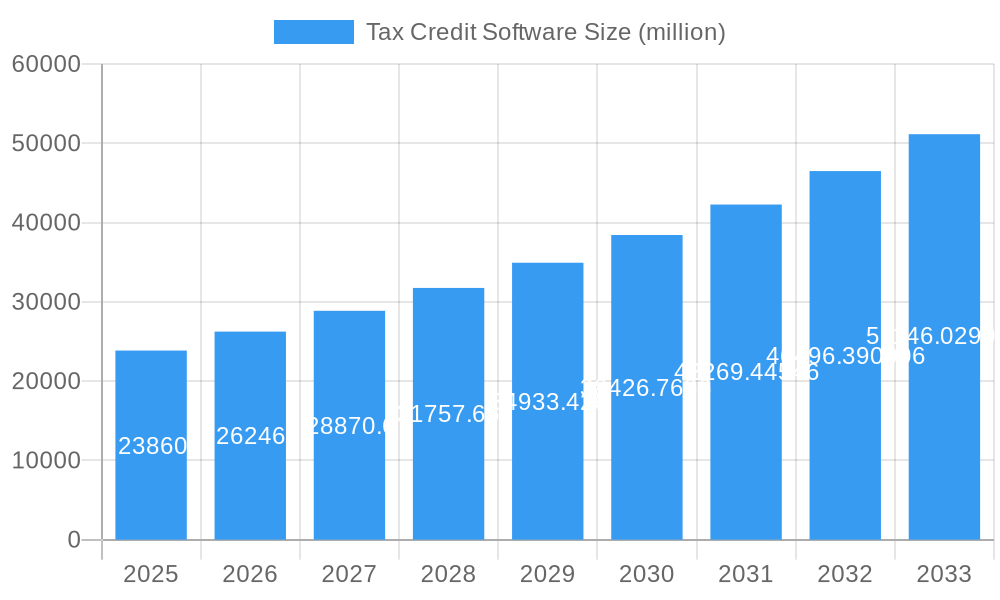
The global Tax Credit Software market is poised for robust expansion, projected to reach USD 23.86 billion by 2025, with a compelling Compound Annual Growth Rate (CAGR) of 10% anticipated through the forecast period of 2025-2033. This significant market valuation underscores the increasing reliance of businesses on streamlined and automated tax credit management solutions. The primary impetus for this growth is the evolving regulatory landscape and the persistent drive for cost optimization within organizations. Businesses, from burgeoning SMEs to large enterprises, are actively seeking efficient ways to identify, claim, and manage various tax credits, including those for Work Opportunity Tax Credits (WOTC) and Research and Development (R&D) initiatives. The complexity of tax laws and the potential for substantial financial benefits incentivize the adoption of specialized software that ensures compliance and maximizes returns. Key market drivers include government incentives aimed at encouraging business investment in innovation and employment, coupled with the growing awareness among businesses about the significant financial advantages these credits offer.
Tax Credit Software Market Size (In Billion)
The competitive landscape is characterized by a dynamic interplay of established players and innovative startups, all vying to capture market share by offering advanced features, user-friendly interfaces, and comprehensive support. The market is segmented effectively across different business sizes, with both Large Enterprises and SMEs showing strong demand for tailored solutions. Within software types, WOTC Tax Credit Software and R&D Tax Credit Software represent dominant segments, reflecting the widespread applicability and substantial value of these particular credits. Emerging trends indicate a growing demand for cloud-based solutions that offer scalability, accessibility, and enhanced data security. Restraints, such as the initial investment costs for sophisticated software and the perceived complexity in integrating new systems, are gradually being overcome by the demonstrable ROI and the increasing availability of subscription-based models. Regions like North America and Europe are leading the adoption, driven by mature tax ecosystems and proactive government initiatives, with Asia Pacific demonstrating significant growth potential.
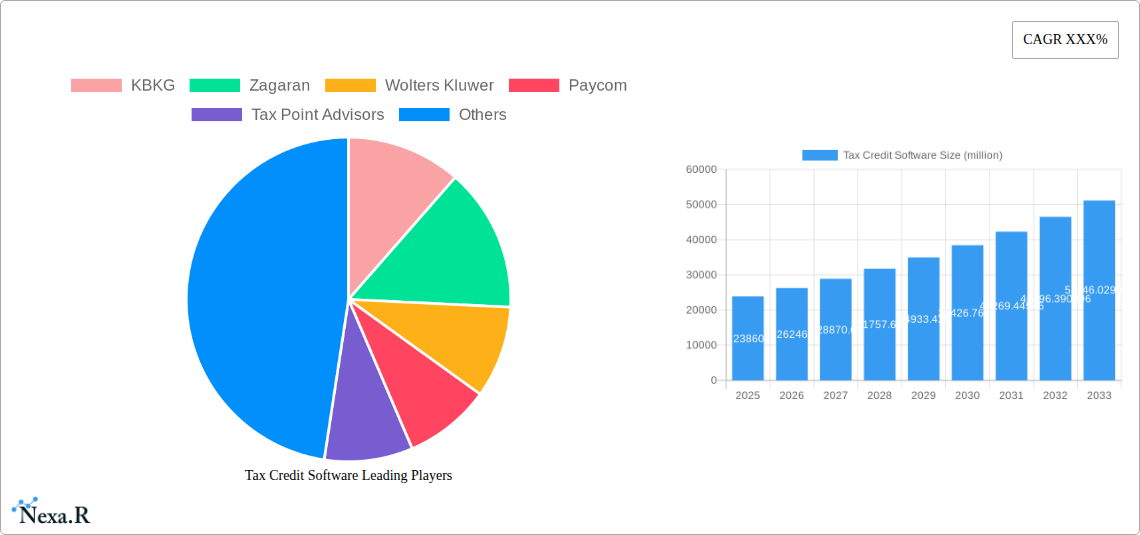
Tax Credit Software Company Market Share
Tax Credit Software Market Dynamics & Structure
The tax credit software market is characterized by a moderately concentrated landscape, with a blend of established players and emerging innovators vying for market share. Technological innovation serves as a primary driver, fueled by the continuous need for more accurate, efficient, and compliant tax credit calculation and management. Regulatory frameworks, particularly around R&D tax credits and Work Opportunity Tax Credits (WOTC), significantly influence market evolution, demanding constant software updates to align with changing legislation. Competitive product substitutes, such as manual processes and outsourced tax services, exist but are increasingly being outpaced by the cost-effectiveness and comprehensive features of dedicated software solutions. End-user demographics span from SMEs seeking streamlined tax processes to Large Enterprises requiring sophisticated compliance and optimization tools. Mergers and acquisitions (M&A) are a growing trend, with larger software providers acquiring smaller, specialized companies to expand their product portfolios and customer base.
- Market Concentration: Dominated by a few key players, but with significant room for specialized and emerging solutions.
- Technological Innovation Drivers: Automation, AI-powered analytics, cloud-based accessibility, and real-time compliance updates.
- Regulatory Frameworks: Evolution of federal and state tax credit legislation, influencing software development and features.
- Competitive Product Substitutes: Manual calculations, generic accounting software add-ons, and traditional tax consulting firms.
- End-User Demographics: Wide adoption across various business sizes, with specialized needs for each segment.
- M&A Trends: Consolidation for market expansion and enhanced feature sets.
Tax Credit Software Growth Trends & Insights
The tax credit software market is poised for substantial growth, projected to reach an estimated $18.5 billion by the end of 2025. This impressive expansion is driven by a confluence of factors, including increasing government incentives for businesses to innovate and hire, coupled with the growing complexity of tax regulations. The market has witnessed a steady upward trajectory in adoption rates, particularly among SMEs, who are increasingly recognizing the return on investment offered by these specialized solutions. Businesses are moving away from manual processes and generic software, opting for dedicated tax credit software that ensures accuracy, maximizes eligible credits, and simplifies compliance.
Technological disruptions are playing a pivotal role in shaping this growth. The integration of artificial intelligence (AI) and machine learning (ML) is revolutionizing how tax credits are identified and calculated. AI-powered analytics can sift through vast amounts of financial and operational data to pinpoint potential R&D tax credits or WOTC eligibility with unprecedented precision. This not only reduces the risk of errors but also uncovers opportunities that might otherwise be missed. Cloud-based platforms have further democratized access to these sophisticated tools, allowing businesses of all sizes to benefit from advanced tax credit management without significant upfront IT investments.
Consumer behavior shifts are also contributing to the market's dynamism. Businesses are becoming more proactive in their tax planning, seeking to optimize their tax liabilities year-round rather than solely during the annual tax filing period. This proactive approach necessitates continuous monitoring and accurate data management, which tax credit software excels at providing. The demand for user-friendly interfaces and seamless integration with existing accounting and HR systems is also a growing trend, as businesses prioritize efficiency and minimal disruption to their operations. The forecast period of 2025–2033 is expected to see a Compound Annual Growth Rate (CAGR) of 14.2%, underscoring the sustained and robust expansion of this critical market. The market penetration for specialized tax credit software is expected to climb from xx% in 2024 to over xx% by 2033, indicating a significant shift in how businesses approach tax credit optimization.
Dominant Regions, Countries, or Segments in Tax Credit Software
The global tax credit software market's dominance is largely dictated by regions and countries with robust government incentives and a thriving business ecosystem. North America, particularly the United States, stands out as the leading region, driven by its extensive R&D tax credit programs and the Work Opportunity Tax Credit (WOTC). The US government's consistent encouragement of innovation through tax credits, alongside substantial support for job creation, has fostered a fertile ground for tax credit software adoption. The sheer volume of SMEs and Large Enterprises operating within the US, coupled with the increasing complexity of its tax landscape, necessitates sophisticated solutions for compliance and optimization.
Within the Application segment, SMEs are emerging as a significant growth engine. While Large Enterprises have historically been primary adopters due to their complex tax structures and greater potential for significant credit claims, SMEs are increasingly recognizing the transformative impact of tax credit software. These businesses often lack dedicated in-house tax expertise and find manual processes to be time-consuming and error-prone. Tax credit software provides them with an affordable and efficient way to access valuable tax savings, thereby improving their cash flow and competitiveness. The projected market share for SMEs in this segment is estimated to grow from 40% in 2025 to over 55% by 2033, showcasing their rising importance.
In terms of Type, R&D Tax Credit Software currently holds the largest market share, estimated at 45% in 2025. This is directly attributable to the substantial financial benefits and the widespread availability of R&D tax credits across numerous industries. The continuous drive for innovation globally ensures sustained demand for R&D tax credits and, consequently, for specialized software to manage them. However, WOTC Tax Credit Software is experiencing the fastest growth rate, with an anticipated CAGR of 16.8% over the forecast period. This surge is fueled by employers' ongoing need to reduce payroll taxes and stimulate job growth, particularly in sectors with high employee turnover. The ease of integration and the direct impact on operational costs make WOTC software increasingly attractive.
- Dominant Region: North America (primarily the United States) due to comprehensive R&D and WOTC incentives.
- Key Drivers (US): Strong government support for innovation and job creation, complex tax regulations, high concentration of SMEs and Large Enterprises.
- Dominant Application Segment (Growth): SMEs, driven by cost-efficiency and accessibility of tax savings.
- Projected market share growth from 40% (2025) to over 55% (2033).
- Dominant Type Segment (Current Share): R&D Tax Credit Software (estimated 45% in 2025).
- Fastest Growing Type Segment: WOTC Tax Credit Software, driven by job creation incentives and ease of use.
- Anticipated CAGR of 16.8% for WOTC software.
Tax Credit Software Product Landscape
The tax credit software product landscape is defined by an ever-increasing sophistication and specialization. Innovations are centered around automating complex calculations, ensuring regulatory compliance across multiple jurisdictions, and providing actionable insights for maximizing tax benefits. Solutions are moving beyond basic calculation to offer predictive analytics, real-time reporting, and seamless integration with ERP, accounting, and HR systems. Unique selling propositions often lie in the software's ability to handle niche tax credits, its user-friendly interface for non-tax professionals, and its robust audit defense capabilities. For instance, companies like WhisperClaims are focusing on AI-driven document analysis to automatically identify eligible R&D expenditures, while platforms like Gusto are integrating WOTC screening directly into their payroll services for SMEs. The performance metrics most valued by users include accuracy of credit calculation, speed of processing, ease of implementation, and demonstrably improved tax savings.
Key Drivers, Barriers & Challenges in Tax Credit Software
Key Drivers:
The tax credit software market is propelled by several powerful forces. Government incentives remain the primary driver, with ongoing legislative support for R&D, job creation (WOTC), and other strategic business activities. The increasing complexity of tax regulations globally compels businesses to seek specialized software for accurate compliance. Technological advancements, particularly in AI and automation, enable more efficient and precise credit identification and claim submission. The growing awareness of potential tax savings among businesses of all sizes is a significant catalyst, shifting tax management from a reactive to a proactive strategy.
Barriers & Challenges:
Despite robust growth, the market faces several hurdles. Perceived cost and implementation complexity can be a barrier for smaller businesses, although SaaS models are mitigating this. Resistance to change and reliance on traditional, manual processes present a challenge in widespread adoption. Regulatory uncertainty and frequent changes in tax laws necessitate continuous software updates, posing a challenge for developers and users alike. Data security and privacy concerns are paramount, especially with sensitive financial information, requiring robust cybersecurity measures. The shortage of skilled tax professionals who can effectively utilize and interpret the software outputs can also be a restraint. Quantifiable impacts include the estimated 5-10% of eligible credits lost annually due to manual errors or lack of awareness, highlighting the market's potential.
Emerging Opportunities in Tax Credit Software
Emerging opportunities in the tax credit software industry are abundant, driven by evolving business needs and technological advancements. The expansion into global markets presents a significant untapped potential, as more countries are adopting or enhancing their tax credit programs. Furthermore, the development of industry-specific tax credit software tailored to unique sector requirements (e.g., biotech, manufacturing, software development) will cater to niche demands. The integration of blockchain technology for enhanced transparency and auditability of tax credit claims is an exciting frontier. As businesses increasingly prioritize sustainability, opportunities exist for software that helps identify and claim credits related to green initiatives and energy efficiency.
Growth Accelerators in the Tax Credit Software Industry
Several catalysts are accelerating the growth of the tax credit software industry. Strategic partnerships between tax credit software providers and accounting firms, HR platforms, and industry associations are expanding reach and building trust. Continuous innovation in AI and machine learning is enabling more sophisticated and accurate identification of eligible credits, reducing manual effort and maximizing savings. The increasing adoption of cloud-based solutions is making advanced tax credit management accessible and affordable for a wider range of businesses. Government initiatives to promote business investment and job creation, often accompanied by enhanced tax credit programs, directly fuel demand for these software solutions.
Key Players Shaping the Tax Credit Software Market
- KBKG
- Zagaran
- Wolters Kluwer
- Paycom
- Tax Point Advisors
- WhisperClaims
- Gusto
- Clarus R+D
- GOAT.tax
- TaxRobot
- Exactera
- Boast
- Replicon (Deltek)
- Neo.Tax
- MainStreet
- Kipsi
Notable Milestones in Tax Credit Software Sector
- 2019: Increased government focus on R&D tax credits and WOTC, leading to enhanced software features for compliance.
- 2020: Accelerated adoption of cloud-based tax credit software due to remote work trends and the need for accessible solutions.
- 2021: Significant investment in AI and ML technologies for tax credit software, improving automation and accuracy.
- 2022: Emergence of specialized WOTC tax credit software tailored for SMEs, driving wider adoption.
- 2023: Increased M&A activity as larger players acquire innovative startups to broaden their offerings.
- 2024: Focus on enhanced audit defense capabilities and integration with broader financial management suites.
- 2025 (Projected): Introduction of more sophisticated predictive analytics for identifying emerging tax credit opportunities.
In-Depth Tax Credit Software Market Outlook
The future outlook for the tax credit software market is exceptionally promising, driven by sustained growth accelerators. The continuous evolution of government incentives and the increasing global emphasis on innovation and job creation will ensure ongoing demand. The industry will witness further technological advancements, particularly in AI, leading to more automated, intelligent, and user-friendly solutions that maximize tax savings for businesses. Strategic partnerships and market expansion, especially into underserved global regions and niche industry segments, will unlock significant growth potential. The ongoing shift towards proactive tax planning by businesses of all sizes solidifies the indispensable role of tax credit software, positioning it as a critical tool for financial optimization and competitive advantage.
Tax Credit Software Segmentation
-
1. Application
- 1.1. Large Enterprises
- 1.2. SMEs
-
2. Type
- 2.1. WOTC Tax Credit Software
- 2.2. R&D Tax Credit Software
- 2.3. Other
Tax Credit Software Segmentation By Geography
-
1. North America
- 1.1. United States
- 1.2. Canada
- 1.3. Mexico
-
2. South America
- 2.1. Brazil
- 2.2. Argentina
- 2.3. Rest of South America
-
3. Europe
- 3.1. United Kingdom
- 3.2. Germany
- 3.3. France
- 3.4. Italy
- 3.5. Spain
- 3.6. Russia
- 3.7. Benelux
- 3.8. Nordics
- 3.9. Rest of Europe
-
4. Middle East & Africa
- 4.1. Turkey
- 4.2. Israel
- 4.3. GCC
- 4.4. North Africa
- 4.5. South Africa
- 4.6. Rest of Middle East & Africa
-
5. Asia Pacific
- 5.1. China
- 5.2. India
- 5.3. Japan
- 5.4. South Korea
- 5.5. ASEAN
- 5.6. Oceania
- 5.7. Rest of Asia Pacific
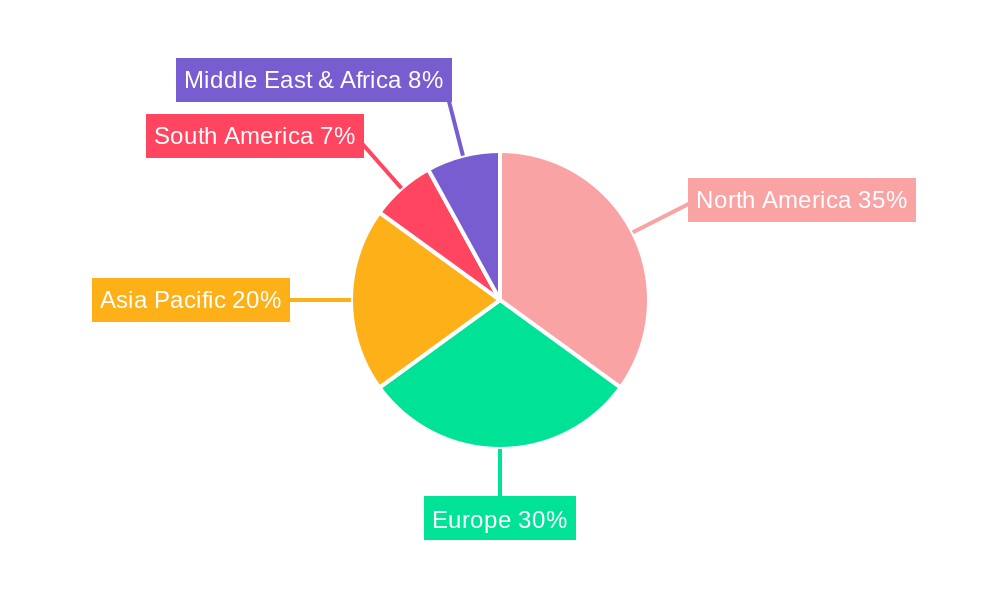
Tax Credit Software Regional Market Share
Geographic Coverage of Tax Credit Software
Tax Credit Software REPORT HIGHLIGHTS
| Aspects | Details |
|---|---|
| Study Period | 2020-2034 |
| Base Year | 2025 |
| Estimated Year | 2026 |
| Forecast Period | 2026-2034 |
| Historical Period | 2020-2025 |
| Growth Rate | CAGR of 10% from 2020-2034 |
| Segmentation |
|
Table of Contents
- 1. Introduction
- 1.1. Research Scope
- 1.2. Market Segmentation
- 1.3. Research Methodology
- 1.4. Definitions and Assumptions
- 2. Executive Summary
- 2.1. Introduction
- 3. Market Dynamics
- 3.1. Introduction
- 3.2. Market Drivers
- 3.3. Market Restrains
- 3.4. Market Trends
- 4. Market Factor Analysis
- 4.1. Porters Five Forces
- 4.2. Supply/Value Chain
- 4.3. PESTEL analysis
- 4.4. Market Entropy
- 4.5. Patent/Trademark Analysis
- 5. Global Tax Credit Software Analysis, Insights and Forecast, 2020-2032
- 5.1. Market Analysis, Insights and Forecast - by Application
- 5.1.1. Large Enterprises
- 5.1.2. SMEs
- 5.2. Market Analysis, Insights and Forecast - by Type
- 5.2.1. WOTC Tax Credit Software
- 5.2.2. R&D Tax Credit Software
- 5.2.3. Other
- 5.3. Market Analysis, Insights and Forecast - by Region
- 5.3.1. North America
- 5.3.2. South America
- 5.3.3. Europe
- 5.3.4. Middle East & Africa
- 5.3.5. Asia Pacific
- 5.1. Market Analysis, Insights and Forecast - by Application
- 6. North America Tax Credit Software Analysis, Insights and Forecast, 2020-2032
- 6.1. Market Analysis, Insights and Forecast - by Application
- 6.1.1. Large Enterprises
- 6.1.2. SMEs
- 6.2. Market Analysis, Insights and Forecast - by Type
- 6.2.1. WOTC Tax Credit Software
- 6.2.2. R&D Tax Credit Software
- 6.2.3. Other
- 6.1. Market Analysis, Insights and Forecast - by Application
- 7. South America Tax Credit Software Analysis, Insights and Forecast, 2020-2032
- 7.1. Market Analysis, Insights and Forecast - by Application
- 7.1.1. Large Enterprises
- 7.1.2. SMEs
- 7.2. Market Analysis, Insights and Forecast - by Type
- 7.2.1. WOTC Tax Credit Software
- 7.2.2. R&D Tax Credit Software
- 7.2.3. Other
- 7.1. Market Analysis, Insights and Forecast - by Application
- 8. Europe Tax Credit Software Analysis, Insights and Forecast, 2020-2032
- 8.1. Market Analysis, Insights and Forecast - by Application
- 8.1.1. Large Enterprises
- 8.1.2. SMEs
- 8.2. Market Analysis, Insights and Forecast - by Type
- 8.2.1. WOTC Tax Credit Software
- 8.2.2. R&D Tax Credit Software
- 8.2.3. Other
- 8.1. Market Analysis, Insights and Forecast - by Application
- 9. Middle East & Africa Tax Credit Software Analysis, Insights and Forecast, 2020-2032
- 9.1. Market Analysis, Insights and Forecast - by Application
- 9.1.1. Large Enterprises
- 9.1.2. SMEs
- 9.2. Market Analysis, Insights and Forecast - by Type
- 9.2.1. WOTC Tax Credit Software
- 9.2.2. R&D Tax Credit Software
- 9.2.3. Other
- 9.1. Market Analysis, Insights and Forecast - by Application
- 10. Asia Pacific Tax Credit Software Analysis, Insights and Forecast, 2020-2032
- 10.1. Market Analysis, Insights and Forecast - by Application
- 10.1.1. Large Enterprises
- 10.1.2. SMEs
- 10.2. Market Analysis, Insights and Forecast - by Type
- 10.2.1. WOTC Tax Credit Software
- 10.2.2. R&D Tax Credit Software
- 10.2.3. Other
- 10.1. Market Analysis, Insights and Forecast - by Application
- 11. Competitive Analysis
- 11.1. Global Market Share Analysis 2025
- 11.2. Company Profiles
- 11.2.1 KBKG
- 11.2.1.1. Overview
- 11.2.1.2. Products
- 11.2.1.3. SWOT Analysis
- 11.2.1.4. Recent Developments
- 11.2.1.5. Financials (Based on Availability)
- 11.2.2 Zagaran
- 11.2.2.1. Overview
- 11.2.2.2. Products
- 11.2.2.3. SWOT Analysis
- 11.2.2.4. Recent Developments
- 11.2.2.5. Financials (Based on Availability)
- 11.2.3 Wolters Kluwer
- 11.2.3.1. Overview
- 11.2.3.2. Products
- 11.2.3.3. SWOT Analysis
- 11.2.3.4. Recent Developments
- 11.2.3.5. Financials (Based on Availability)
- 11.2.4 Paycom
- 11.2.4.1. Overview
- 11.2.4.2. Products
- 11.2.4.3. SWOT Analysis
- 11.2.4.4. Recent Developments
- 11.2.4.5. Financials (Based on Availability)
- 11.2.5 Tax Point Advisors
- 11.2.5.1. Overview
- 11.2.5.2. Products
- 11.2.5.3. SWOT Analysis
- 11.2.5.4. Recent Developments
- 11.2.5.5. Financials (Based on Availability)
- 11.2.6 WhisperClaims
- 11.2.6.1. Overview
- 11.2.6.2. Products
- 11.2.6.3. SWOT Analysis
- 11.2.6.4. Recent Developments
- 11.2.6.5. Financials (Based on Availability)
- 11.2.7 Gusto
- 11.2.7.1. Overview
- 11.2.7.2. Products
- 11.2.7.3. SWOT Analysis
- 11.2.7.4. Recent Developments
- 11.2.7.5. Financials (Based on Availability)
- 11.2.8 Clarus R+D
- 11.2.8.1. Overview
- 11.2.8.2. Products
- 11.2.8.3. SWOT Analysis
- 11.2.8.4. Recent Developments
- 11.2.8.5. Financials (Based on Availability)
- 11.2.9 GOAT.tax
- 11.2.9.1. Overview
- 11.2.9.2. Products
- 11.2.9.3. SWOT Analysis
- 11.2.9.4. Recent Developments
- 11.2.9.5. Financials (Based on Availability)
- 11.2.10 TaxRobot
- 11.2.10.1. Overview
- 11.2.10.2. Products
- 11.2.10.3. SWOT Analysis
- 11.2.10.4. Recent Developments
- 11.2.10.5. Financials (Based on Availability)
- 11.2.11 Exactera
- 11.2.11.1. Overview
- 11.2.11.2. Products
- 11.2.11.3. SWOT Analysis
- 11.2.11.4. Recent Developments
- 11.2.11.5. Financials (Based on Availability)
- 11.2.12 Boast
- 11.2.12.1. Overview
- 11.2.12.2. Products
- 11.2.12.3. SWOT Analysis
- 11.2.12.4. Recent Developments
- 11.2.12.5. Financials (Based on Availability)
- 11.2.13 Replicon (Deltek)
- 11.2.13.1. Overview
- 11.2.13.2. Products
- 11.2.13.3. SWOT Analysis
- 11.2.13.4. Recent Developments
- 11.2.13.5. Financials (Based on Availability)
- 11.2.14 Neo.Tax
- 11.2.14.1. Overview
- 11.2.14.2. Products
- 11.2.14.3. SWOT Analysis
- 11.2.14.4. Recent Developments
- 11.2.14.5. Financials (Based on Availability)
- 11.2.15 MainStreet
- 11.2.15.1. Overview
- 11.2.15.2. Products
- 11.2.15.3. SWOT Analysis
- 11.2.15.4. Recent Developments
- 11.2.15.5. Financials (Based on Availability)
- 11.2.16 Kipsi
- 11.2.16.1. Overview
- 11.2.16.2. Products
- 11.2.16.3. SWOT Analysis
- 11.2.16.4. Recent Developments
- 11.2.16.5. Financials (Based on Availability)
- 11.2.1 KBKG
List of Figures
- Figure 1: Global Tax Credit Software Revenue Breakdown (undefined, %) by Region 2025 & 2033
- Figure 2: North America Tax Credit Software Revenue (undefined), by Application 2025 & 2033
- Figure 3: North America Tax Credit Software Revenue Share (%), by Application 2025 & 2033
- Figure 4: North America Tax Credit Software Revenue (undefined), by Type 2025 & 2033
- Figure 5: North America Tax Credit Software Revenue Share (%), by Type 2025 & 2033
- Figure 6: North America Tax Credit Software Revenue (undefined), by Country 2025 & 2033
- Figure 7: North America Tax Credit Software Revenue Share (%), by Country 2025 & 2033
- Figure 8: South America Tax Credit Software Revenue (undefined), by Application 2025 & 2033
- Figure 9: South America Tax Credit Software Revenue Share (%), by Application 2025 & 2033
- Figure 10: South America Tax Credit Software Revenue (undefined), by Type 2025 & 2033
- Figure 11: South America Tax Credit Software Revenue Share (%), by Type 2025 & 2033
- Figure 12: South America Tax Credit Software Revenue (undefined), by Country 2025 & 2033
- Figure 13: South America Tax Credit Software Revenue Share (%), by Country 2025 & 2033
- Figure 14: Europe Tax Credit Software Revenue (undefined), by Application 2025 & 2033
- Figure 15: Europe Tax Credit Software Revenue Share (%), by Application 2025 & 2033
- Figure 16: Europe Tax Credit Software Revenue (undefined), by Type 2025 & 2033
- Figure 17: Europe Tax Credit Software Revenue Share (%), by Type 2025 & 2033
- Figure 18: Europe Tax Credit Software Revenue (undefined), by Country 2025 & 2033
- Figure 19: Europe Tax Credit Software Revenue Share (%), by Country 2025 & 2033
- Figure 20: Middle East & Africa Tax Credit Software Revenue (undefined), by Application 2025 & 2033
- Figure 21: Middle East & Africa Tax Credit Software Revenue Share (%), by Application 2025 & 2033
- Figure 22: Middle East & Africa Tax Credit Software Revenue (undefined), by Type 2025 & 2033
- Figure 23: Middle East & Africa Tax Credit Software Revenue Share (%), by Type 2025 & 2033
- Figure 24: Middle East & Africa Tax Credit Software Revenue (undefined), by Country 2025 & 2033
- Figure 25: Middle East & Africa Tax Credit Software Revenue Share (%), by Country 2025 & 2033
- Figure 26: Asia Pacific Tax Credit Software Revenue (undefined), by Application 2025 & 2033
- Figure 27: Asia Pacific Tax Credit Software Revenue Share (%), by Application 2025 & 2033
- Figure 28: Asia Pacific Tax Credit Software Revenue (undefined), by Type 2025 & 2033
- Figure 29: Asia Pacific Tax Credit Software Revenue Share (%), by Type 2025 & 2033
- Figure 30: Asia Pacific Tax Credit Software Revenue (undefined), by Country 2025 & 2033
- Figure 31: Asia Pacific Tax Credit Software Revenue Share (%), by Country 2025 & 2033
List of Tables
- Table 1: Global Tax Credit Software Revenue undefined Forecast, by Application 2020 & 2033
- Table 2: Global Tax Credit Software Revenue undefined Forecast, by Type 2020 & 2033
- Table 3: Global Tax Credit Software Revenue undefined Forecast, by Region 2020 & 2033
- Table 4: Global Tax Credit Software Revenue undefined Forecast, by Application 2020 & 2033
- Table 5: Global Tax Credit Software Revenue undefined Forecast, by Type 2020 & 2033
- Table 6: Global Tax Credit Software Revenue undefined Forecast, by Country 2020 & 2033
- Table 7: United States Tax Credit Software Revenue (undefined) Forecast, by Application 2020 & 2033
- Table 8: Canada Tax Credit Software Revenue (undefined) Forecast, by Application 2020 & 2033
- Table 9: Mexico Tax Credit Software Revenue (undefined) Forecast, by Application 2020 & 2033
- Table 10: Global Tax Credit Software Revenue undefined Forecast, by Application 2020 & 2033
- Table 11: Global Tax Credit Software Revenue undefined Forecast, by Type 2020 & 2033
- Table 12: Global Tax Credit Software Revenue undefined Forecast, by Country 2020 & 2033
- Table 13: Brazil Tax Credit Software Revenue (undefined) Forecast, by Application 2020 & 2033
- Table 14: Argentina Tax Credit Software Revenue (undefined) Forecast, by Application 2020 & 2033
- Table 15: Rest of South America Tax Credit Software Revenue (undefined) Forecast, by Application 2020 & 2033
- Table 16: Global Tax Credit Software Revenue undefined Forecast, by Application 2020 & 2033
- Table 17: Global Tax Credit Software Revenue undefined Forecast, by Type 2020 & 2033
- Table 18: Global Tax Credit Software Revenue undefined Forecast, by Country 2020 & 2033
- Table 19: United Kingdom Tax Credit Software Revenue (undefined) Forecast, by Application 2020 & 2033
- Table 20: Germany Tax Credit Software Revenue (undefined) Forecast, by Application 2020 & 2033
- Table 21: France Tax Credit Software Revenue (undefined) Forecast, by Application 2020 & 2033
- Table 22: Italy Tax Credit Software Revenue (undefined) Forecast, by Application 2020 & 2033
- Table 23: Spain Tax Credit Software Revenue (undefined) Forecast, by Application 2020 & 2033
- Table 24: Russia Tax Credit Software Revenue (undefined) Forecast, by Application 2020 & 2033
- Table 25: Benelux Tax Credit Software Revenue (undefined) Forecast, by Application 2020 & 2033
- Table 26: Nordics Tax Credit Software Revenue (undefined) Forecast, by Application 2020 & 2033
- Table 27: Rest of Europe Tax Credit Software Revenue (undefined) Forecast, by Application 2020 & 2033
- Table 28: Global Tax Credit Software Revenue undefined Forecast, by Application 2020 & 2033
- Table 29: Global Tax Credit Software Revenue undefined Forecast, by Type 2020 & 2033
- Table 30: Global Tax Credit Software Revenue undefined Forecast, by Country 2020 & 2033
- Table 31: Turkey Tax Credit Software Revenue (undefined) Forecast, by Application 2020 & 2033
- Table 32: Israel Tax Credit Software Revenue (undefined) Forecast, by Application 2020 & 2033
- Table 33: GCC Tax Credit Software Revenue (undefined) Forecast, by Application 2020 & 2033
- Table 34: North Africa Tax Credit Software Revenue (undefined) Forecast, by Application 2020 & 2033
- Table 35: South Africa Tax Credit Software Revenue (undefined) Forecast, by Application 2020 & 2033
- Table 36: Rest of Middle East & Africa Tax Credit Software Revenue (undefined) Forecast, by Application 2020 & 2033
- Table 37: Global Tax Credit Software Revenue undefined Forecast, by Application 2020 & 2033
- Table 38: Global Tax Credit Software Revenue undefined Forecast, by Type 2020 & 2033
- Table 39: Global Tax Credit Software Revenue undefined Forecast, by Country 2020 & 2033
- Table 40: China Tax Credit Software Revenue (undefined) Forecast, by Application 2020 & 2033
- Table 41: India Tax Credit Software Revenue (undefined) Forecast, by Application 2020 & 2033
- Table 42: Japan Tax Credit Software Revenue (undefined) Forecast, by Application 2020 & 2033
- Table 43: South Korea Tax Credit Software Revenue (undefined) Forecast, by Application 2020 & 2033
- Table 44: ASEAN Tax Credit Software Revenue (undefined) Forecast, by Application 2020 & 2033
- Table 45: Oceania Tax Credit Software Revenue (undefined) Forecast, by Application 2020 & 2033
- Table 46: Rest of Asia Pacific Tax Credit Software Revenue (undefined) Forecast, by Application 2020 & 2033
Frequently Asked Questions
1. What is the projected Compound Annual Growth Rate (CAGR) of the Tax Credit Software?
The projected CAGR is approximately 10%.
2. Which companies are prominent players in the Tax Credit Software?
Key companies in the market include KBKG, Zagaran, Wolters Kluwer, Paycom, Tax Point Advisors, WhisperClaims, Gusto, Clarus R+D, GOAT.tax, TaxRobot, Exactera, Boast, Replicon (Deltek), Neo.Tax, MainStreet, Kipsi.
3. What are the main segments of the Tax Credit Software?
The market segments include Application, Type.
4. Can you provide details about the market size?
The market size is estimated to be USD XXX N/A as of 2022.
5. What are some drivers contributing to market growth?
N/A
6. What are the notable trends driving market growth?
N/A
7. Are there any restraints impacting market growth?
N/A
8. Can you provide examples of recent developments in the market?
N/A
9. What pricing options are available for accessing the report?
Pricing options include single-user, multi-user, and enterprise licenses priced at USD 2900.00, USD 4350.00, and USD 5800.00 respectively.
10. Is the market size provided in terms of value or volume?
The market size is provided in terms of value, measured in N/A.
11. Are there any specific market keywords associated with the report?
Yes, the market keyword associated with the report is "Tax Credit Software," which aids in identifying and referencing the specific market segment covered.
12. How do I determine which pricing option suits my needs best?
The pricing options vary based on user requirements and access needs. Individual users may opt for single-user licenses, while businesses requiring broader access may choose multi-user or enterprise licenses for cost-effective access to the report.
13. Are there any additional resources or data provided in the Tax Credit Software report?
While the report offers comprehensive insights, it's advisable to review the specific contents or supplementary materials provided to ascertain if additional resources or data are available.
14. How can I stay updated on further developments or reports in the Tax Credit Software?
To stay informed about further developments, trends, and reports in the Tax Credit Software, consider subscribing to industry newsletters, following relevant companies and organizations, or regularly checking reputable industry news sources and publications.
Methodology
Step 1 - Identification of Relevant Samples Size from Population Database


Step 2 - Approaches for Defining Global Market Size (Value, Volume* & Price*)

Note*: In applicable scenarios
Step 3 - Data Sources
Primary Research
- Web Analytics
- Survey Reports
- Research Institute
- Latest Research Reports
- Opinion Leaders
Secondary Research
- Annual Reports
- White Paper
- Latest Press Release
- Industry Association
- Paid Database
- Investor Presentations

Step 4 - Data Triangulation
Involves using different sources of information in order to increase the validity of a study
These sources are likely to be stakeholders in a program - participants, other researchers, program staff, other community members, and so on.
Then we put all data in single framework & apply various statistical tools to find out the dynamic on the market.
During the analysis stage, feedback from the stakeholder groups would be compared to determine areas of agreement as well as areas of divergence