

Key Insights
The global Tip Distribution Software market is poised for substantial expansion, projected to reach USD 3.1 billion in 2025. This growth is fueled by an impressive CAGR of 15%, indicating a dynamic and rapidly evolving landscape. A primary driver for this surge is the increasing adoption of digital payment methods and the growing need for streamlined, transparent, and efficient tip management solutions within the hospitality sector. Restaurants and bars, being the largest application segments, are actively seeking software that can automate tip pooling, prevent disputes, and ensure compliance with labor laws, thereby enhancing employee satisfaction and operational efficiency. The shift towards cloud-based solutions is also a significant trend, offering scalability, accessibility, and cost-effectiveness for businesses of all sizes. This move away from on-premises systems reflects the broader digital transformation occurring across industries.
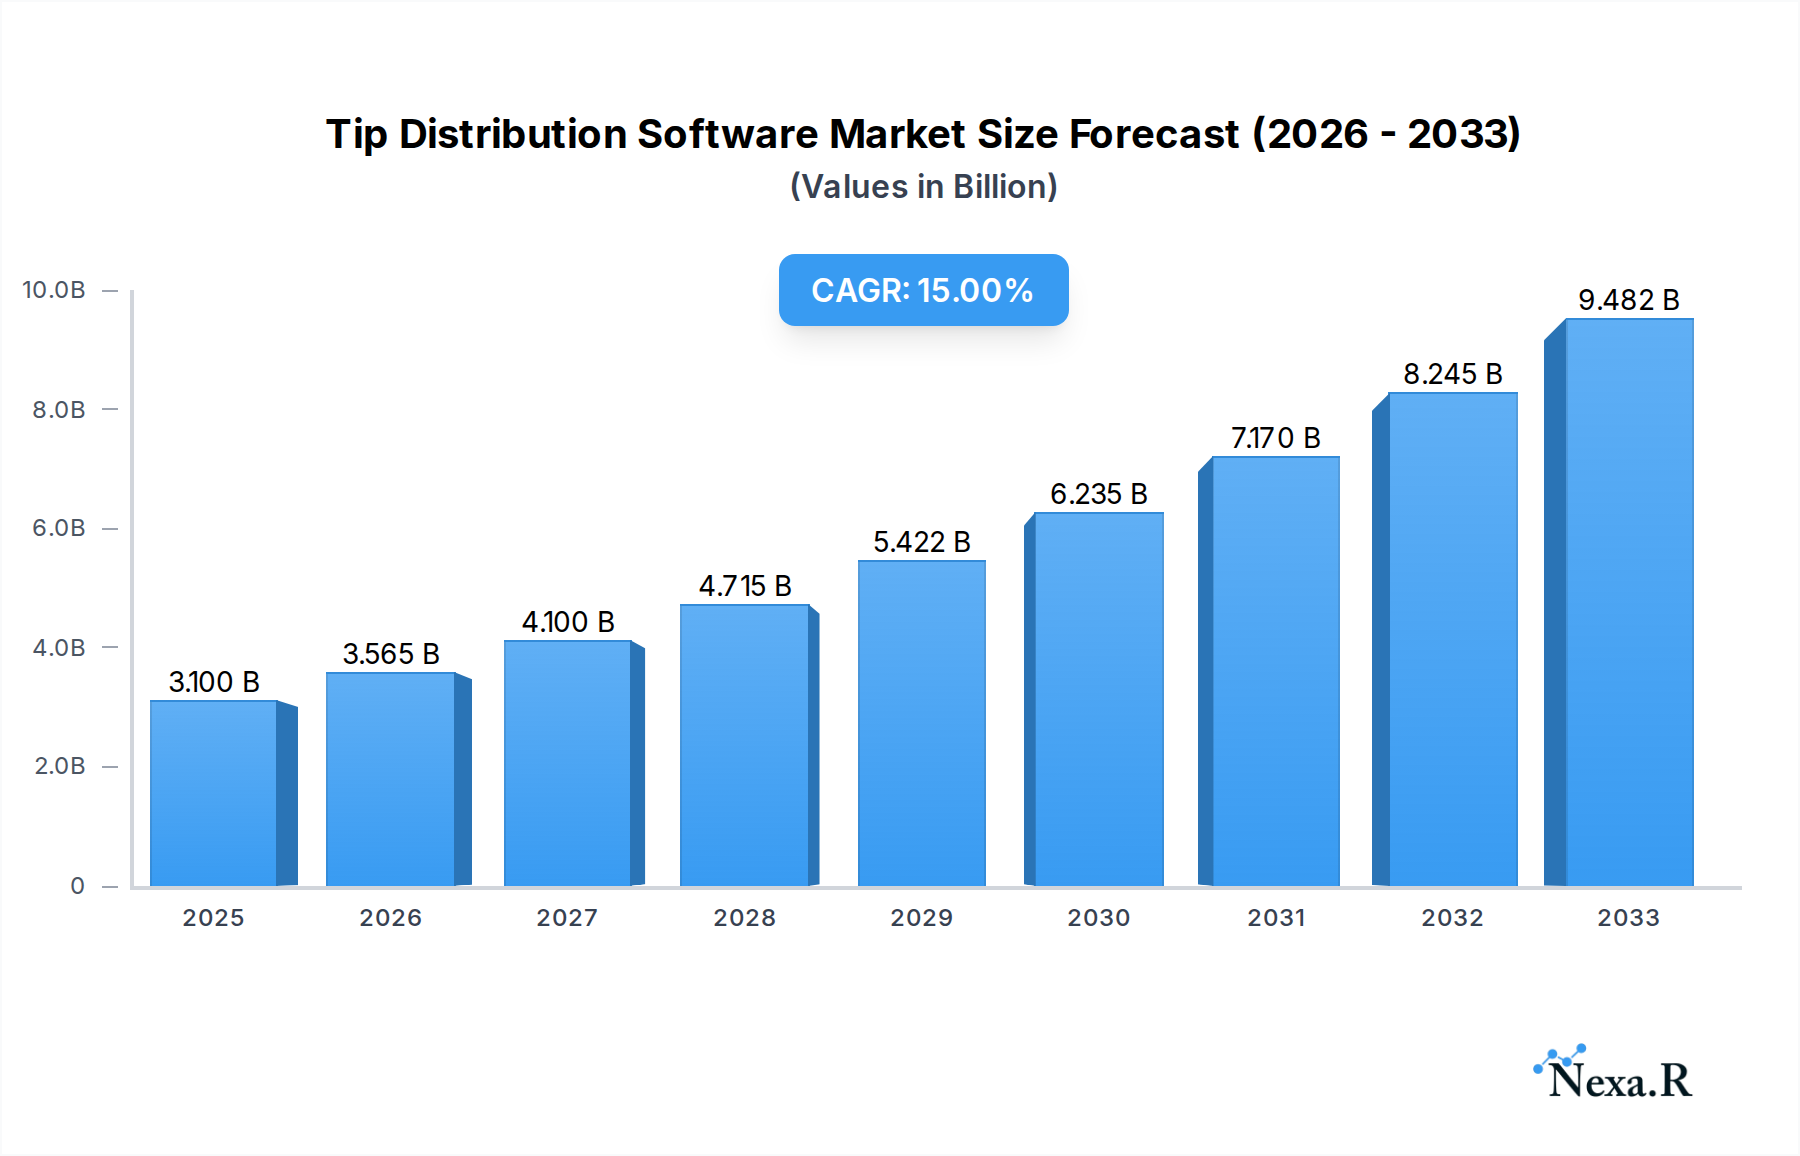
Tip Distribution Software Market Size (In Billion)
Further solidifying the market's upward trajectory are emerging trends such as the integration of tip distribution software with broader HR and payroll systems, offering a holistic approach to workforce management. The demand for real-time reporting and analytics is also on the rise, enabling businesses to gain deeper insights into their tipping patterns and labor costs. While the market is largely driven by the need for efficiency and fairness, potential restraints could include the initial cost of implementation for smaller establishments and concerns around data security and privacy. However, the overwhelming benefits of accurate, automated tip distribution in reducing administrative burden and fostering a positive work environment are expected to outweigh these challenges, propelling sustained market growth throughout the forecast period. The North American region, with its mature hospitality industry and high adoption of technology, is anticipated to lead the market, followed by Europe and the Asia Pacific.

Tip Distribution Software Company Market Share
Tip Distribution Software Market Dynamics & Structure
The global Tip Distribution Software market is characterized by moderate concentration, with a dynamic interplay of established players and emerging innovators. Technological innovation remains a primary driver, fueled by the demand for seamless, secure, and compliant tip management solutions. Regulatory frameworks, particularly concerning labor laws and financial transactions, significantly shape market development, emphasizing transparency and fairness in tip allocation. Competitive product substitutes, including manual processes and basic payroll systems, are gradually being phased out as the benefits of specialized software become more apparent. End-user demographics are shifting towards tech-savvy restaurant and bar staff who expect modern digital solutions for their earnings. Mergers and acquisitions (M&A) trends are on the rise as larger entities seek to consolidate market share and acquire innovative technologies.
- Market Concentration: A mix of niche players and broader hospitality management software providers, with key companies like Kickfin and 7shifts holding significant sway.
- Technological Innovation Drivers: Emphasis on real-time payouts, mobile accessibility, AI-powered allocation algorithms, and integration with POS systems.
- Regulatory Frameworks: Compliance with Fair Labor Standards Act (FLSA), state-specific wage laws, and data security regulations are paramount.
- Competitive Product Substitutes: Manual tip pooling, basic spreadsheets, and integrated but less specialized payroll modules.
- End-User Demographics: Growing preference for instant payouts, digital receipts, and user-friendly mobile applications among service industry workers.
- M&A Trends: Consolidation to achieve economies of scale and broader feature sets; acquisition of startups with novel technologies.
Tip Distribution Software Growth Trends & Insights
The Tip Distribution Software market is projected for robust expansion over the forecast period. Fueled by an increasing reliance on digital transactions and the growing gig economy within the service sector, adoption rates for specialized tip management solutions are accelerating. Market size is expected to witness a substantial increase, driven by the need for operational efficiency, enhanced employee satisfaction, and reduced compliance risks for businesses in the food service and hospitality industries. Technological disruptions, such as blockchain integration for enhanced security and transparency, and the proliferation of AI for optimized tip allocation, are poised to further revolutionize the landscape. Consumer behavior shifts, particularly the growing expectation of immediate payment for services rendered, are also a significant catalyst. Businesses are recognizing that efficient tip distribution is not just an operational necessity but a critical component of employee retention and morale in a competitive labor market. The transition from manual processes to automated systems is a defining trend, as businesses of all sizes are seeking to streamline operations and minimize errors in tip handling. The ongoing digital transformation across all business verticals, including hospitality, naturally extends to how employees receive their earnings. Furthermore, the increasing focus on employee well-being and fair compensation practices by regulatory bodies and the public alike are pushing businesses to adopt transparent and efficient tip distribution methods. This report leverages extensive market research to project a Compound Annual Growth Rate (CAGR) of xx% for the Tip Distribution Software market during the 2025-2033 forecast period, reaching an estimated market value of $xx billion in 2033 from a base of $xx billion in 2025. Market penetration is anticipated to rise from xx% in 2025 to xx% by 2033, reflecting the growing adoption across various segments of the food and beverage industry. The impact of cloud-based solutions, offering scalability and accessibility, is a particularly strong driver of this growth.
Dominant Regions, Countries, or Segments in Tip Distribution Software
The Cloud Based segment, particularly within the Restaurants application, is emerging as the dominant force in the global Tip Distribution Software market. This dominance is attributed to several interconnected factors, including scalability, cost-effectiveness, and ease of implementation, which are crucial for businesses operating on tight margins and with dynamic staffing needs. Cloud-based solutions provide unparalleled accessibility, allowing businesses to manage tip distribution from anywhere, at any time, facilitating real-time updates and immediate payouts, a highly sought-after feature by modern service industry employees. The Restaurants segment, by its sheer volume and the ubiquitous nature of tipping culture, naturally commands the largest share of the market. The shift towards digital payments and mobile-first solutions further amplifies the appeal of cloud-based platforms.
Key drivers for this dominance include:
- Technological Adoption: Restaurants are increasingly embracing technology to streamline operations, from point-of-sale (POS) systems to employee management. Cloud-based tip distribution software seamlessly integrates with these existing technologies.
- Flexibility and Scalability: Cloud solutions offer the flexibility to scale up or down based on business needs, a significant advantage for seasonal or event-driven establishments.
- Employee Expectations: The modern workforce, especially in the hospitality sector, expects instant access to their earnings. Cloud-based software facilitates rapid, often real-time, tip disbursements.
- Regulatory Compliance: Cloud providers often invest heavily in ensuring their platforms meet stringent labor and financial regulations, offering peace of mind to businesses.
- Cost-Effectiveness: Eliminating the need for on-premises hardware and maintenance, cloud-based solutions often present a more attractive total cost of ownership.
The United States stands out as a leading country in this market, owing to a strong tipping culture, a mature hospitality industry, and a high rate of digital payment adoption. Furthermore, stringent labor laws in the US necessitate compliant and transparent tip distribution mechanisms. The growth potential in North America remains substantial, driven by ongoing innovation and the continuous adoption of advanced software solutions by businesses aiming to enhance operational efficiency and employee satisfaction. Asia-Pacific is also projected to witness significant growth, fueled by the expanding tourism and hospitality sectors and increasing digitalization trends.
Tip Distribution Software Product Landscape
The product landscape of Tip Distribution Software is defined by a strong emphasis on user-friendly interfaces, robust security features, and seamless integration capabilities. Key innovations include AI-powered algorithms for fair and automated tip allocation, real-time direct deposit options for immediate payouts, and mobile applications that provide employees with clear earning breakdowns and withdrawal options. Performance metrics are centered around transaction speed, accuracy of calculations, compliance with labor laws, and overall system reliability. Unique selling propositions often lie in specialized features such as customizable distribution rules, comprehensive reporting for business owners, and advanced fraud detection mechanisms, ensuring both efficiency and trust in the financial operations of hospitality businesses.
Key Drivers, Barriers & Challenges in Tip Distribution Software
Key Drivers:
- Demand for Instant Gratification: Employees in the service industry increasingly expect immediate access to their earned tips.
- Operational Efficiency: Businesses seek to automate and streamline complex tip pooling and distribution processes, reducing manual errors and saving time.
- Regulatory Compliance: Evolving labor laws and the need for transparent tip handling necessitate compliant software solutions.
- Employee Retention: Fair and timely tip distribution contributes significantly to employee satisfaction and retention in a competitive job market.
- Digital Transformation: The broader shift towards digital solutions in all business sectors extends to payment and payroll management.
Key Barriers & Challenges:
- Initial Investment Costs: For some small businesses, the upfront cost of implementing new software can be a barrier.
- Integration Complexity: Integrating new tip distribution software with existing POS or payroll systems can be technically challenging.
- Resistance to Change: Some business owners or employees may be resistant to adopting new technologies and processes.
- Data Security Concerns: Businesses and employees are concerned about the security of sensitive financial data.
- Varying Regulatory Landscapes: Navigating the diverse and often changing labor laws across different regions can be complex for software providers.
- Fragmented Market: The presence of numerous small players can create fragmentation and make it challenging to establish market dominance.
Emerging Opportunities in Tip Distribution Software
Emerging opportunities in the Tip Distribution Software market lie in the continued expansion of integrations with a wider array of POS systems and payroll providers, creating a more unified operational ecosystem for businesses. The untapped potential of leveraging data analytics to provide deeper insights into tipping patterns and labor costs for businesses presents another significant avenue. Furthermore, the increasing demand for features that cater to independent contractors and gig economy workers in sectors beyond traditional hospitality offers a substantial growth area. The development of white-label solutions for payroll providers looking to enhance their service offerings also represents a promising opportunity for software developers.
Growth Accelerators in the Tip Distribution Software Industry
Several catalysts are accelerating the growth of the Tip Distribution Software industry. Technological breakthroughs, such as the integration of AI for predictive tip allocation and the exploration of blockchain for enhanced transaction security and transparency, are key. Strategic partnerships between tip distribution software providers and established POS system vendors, as well as payroll companies, are crucial for expanding market reach and offering comprehensive solutions. Market expansion strategies, including targeting emerging economies with growing hospitality sectors and tailoring solutions for specific niches within the food service industry (e.g., food trucks, event catering), are also driving growth. The increasing focus on financial wellness for service industry employees is another significant accelerator, pushing businesses to adopt tools that facilitate better management of their earnings.
Key Players Shaping the Tip Distribution Software Market
- Kickfin
- Dolce Software
- Tip Haus
- 7shifts
- Cloudme Software Solution
- Evention
- GraTrack
- Netclues
- Netspend
- Payouts Network
- SoftTouch
- TipMeOut
- Tipnpost
- DirectTIPS Operations
Notable Milestones in Tip Distribution Software Sector
- 2019: Increased focus on compliance with evolving labor laws like the FLSA tip credit regulations, leading to feature enhancements in accuracy and transparency.
- 2020: Surge in demand for contactless payment solutions and immediate digital tip payouts due to the global pandemic and its impact on the hospitality industry.
- 2021: Growing integration of tip distribution software with broader HR and payroll platforms, aiming for a holistic employee management solution.
- 2022: Advancements in mobile application development, offering enhanced user experience and self-service options for employees.
- 2023: Exploration and early adoption of AI-driven algorithms for more sophisticated and fair tip allocation models.
- 2024: Increased M&A activity as larger hospitality tech companies acquire specialized tip distribution software providers to expand their service portfolios.
In-Depth Tip Distribution Software Market Outlook
The future outlook for the Tip Distribution Software market is exceptionally bright, underpinned by sustained growth accelerators. Continued technological innovation, particularly in AI and blockchain, will unlock new levels of efficiency and security. Strategic alliances and market expansion initiatives will broaden access to these essential tools for businesses globally. The increasing prioritization of employee financial well-being and the persistent demand for transparent, immediate tip disbursements will ensure that tip distribution software remains a critical component of successful hospitality operations. The market is poised for significant growth, driven by the fundamental need for streamlined, compliant, and employee-centric tip management solutions.
Tip Distribution Software Segmentation
-
1. Application
- 1.1. Restaurants
- 1.2. Bars
- 1.3. Others
-
2. Type
- 2.1. Cloud Based
- 2.2. On Premises
Tip Distribution Software Segmentation By Geography
-
1. North America
- 1.1. United States
- 1.2. Canada
- 1.3. Mexico
-
2. South America
- 2.1. Brazil
- 2.2. Argentina
- 2.3. Rest of South America
-
3. Europe
- 3.1. United Kingdom
- 3.2. Germany
- 3.3. France
- 3.4. Italy
- 3.5. Spain
- 3.6. Russia
- 3.7. Benelux
- 3.8. Nordics
- 3.9. Rest of Europe
-
4. Middle East & Africa
- 4.1. Turkey
- 4.2. Israel
- 4.3. GCC
- 4.4. North Africa
- 4.5. South Africa
- 4.6. Rest of Middle East & Africa
-
5. Asia Pacific
- 5.1. China
- 5.2. India
- 5.3. Japan
- 5.4. South Korea
- 5.5. ASEAN
- 5.6. Oceania
- 5.7. Rest of Asia Pacific
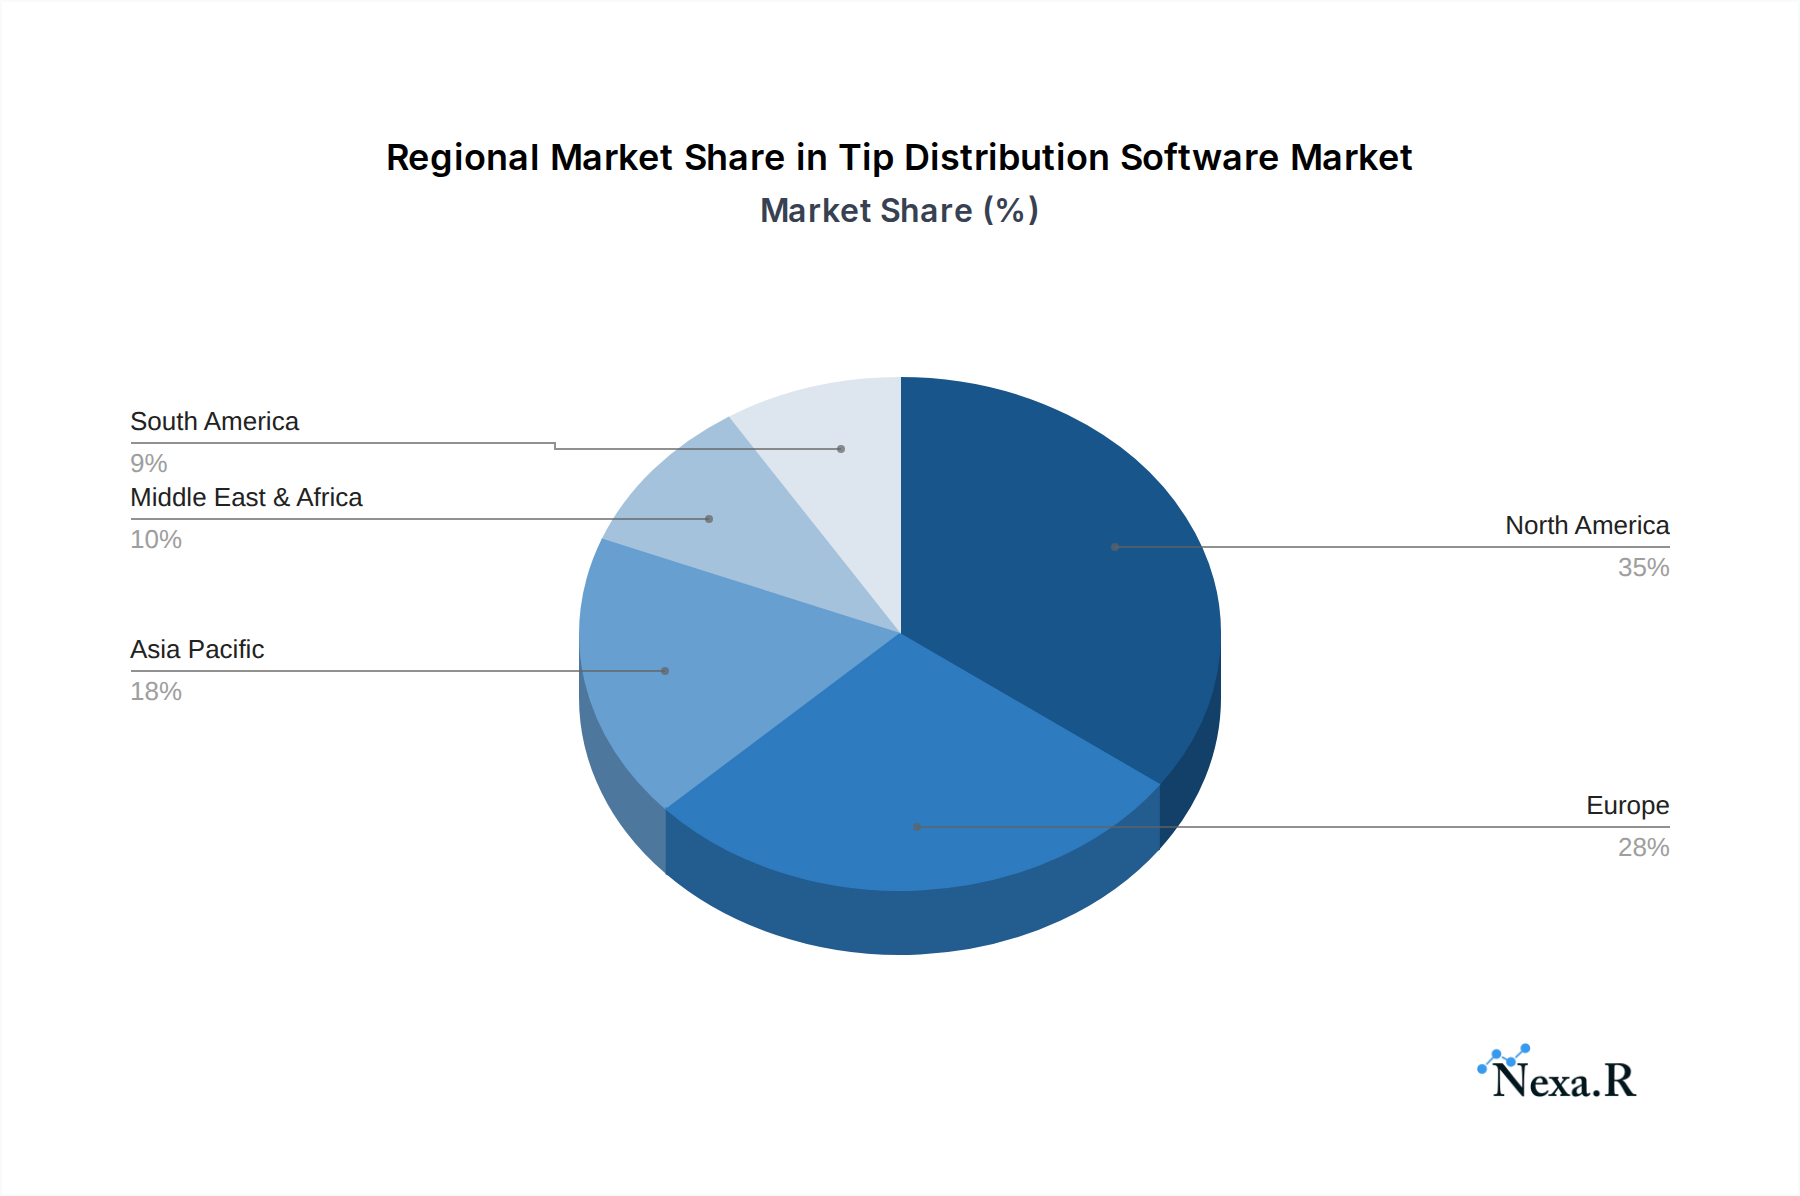
Tip Distribution Software Regional Market Share
Geographic Coverage of Tip Distribution Software
Tip Distribution Software REPORT HIGHLIGHTS
| Aspects | Details |
|---|---|
| Study Period | 2020-2034 |
| Base Year | 2025 |
| Estimated Year | 2026 |
| Forecast Period | 2026-2034 |
| Historical Period | 2020-2025 |
| Growth Rate | CAGR of 9.09% from 2020-2034 |
| Segmentation |
|
Table of Contents
- 1. Introduction
- 1.1. Research Scope
- 1.2. Market Segmentation
- 1.3. Research Objective
- 1.4. Definitions and Assumptions
- 2. Executive Summary
- 2.1. Market Snapshot
- 3. Market Dynamics
- 3.1. Market Drivers
- 3.2. Market Restrains
- 3.3. Market Trends
- 3.4. Market Opportunities
- 4. Market Factor Analysis
- 4.1. Porters Five Forces
- 4.1.1. Bargaining Power of Suppliers
- 4.1.2. Bargaining Power of Buyers
- 4.1.3. Threat of New Entrants
- 4.1.4. Threat of Substitutes
- 4.1.5. Competitive Rivalry
- 4.2. PESTEL analysis
- 4.3. BCG Analysis
- 4.3.1. Stars (High Growth, High Market Share)
- 4.3.2. Cash Cows (Low Growth, High Market Share)
- 4.3.3. Question Mark (High Growth, Low Market Share)
- 4.3.4. Dogs (Low Growth, Low Market Share)
- 4.4. Ansoff Matrix Analysis
- 4.5. Supply Chain Analysis
- 4.6. Regulatory Landscape
- 4.7. Current Market Potential and Opportunity Assessment (TAM–SAM–SOM Framework)
- 4.8. NRP Analyst Note
- 4.1. Porters Five Forces
- 5. Market Analysis, Insights and Forecast 2021-2033
- 5.1. Market Analysis, Insights and Forecast - by Application
- 5.1.1. Restaurants
- 5.1.2. Bars
- 5.1.3. Others
- 5.2. Market Analysis, Insights and Forecast - by Type
- 5.2.1. Cloud Based
- 5.2.2. On Premises
- 5.3. Market Analysis, Insights and Forecast - by Region
- 5.3.1. North America
- 5.3.2. South America
- 5.3.3. Europe
- 5.3.4. Middle East & Africa
- 5.3.5. Asia Pacific
- 5.1. Market Analysis, Insights and Forecast - by Application
- 6. Global Tip Distribution Software Analysis, Insights and Forecast, 2021-2033
- 6.1. Market Analysis, Insights and Forecast - by Application
- 6.1.1. Restaurants
- 6.1.2. Bars
- 6.1.3. Others
- 6.2. Market Analysis, Insights and Forecast - by Type
- 6.2.1. Cloud Based
- 6.2.2. On Premises
- 6.1. Market Analysis, Insights and Forecast - by Application
- 7. North America Tip Distribution Software Analysis, Insights and Forecast, 2020-2032
- 7.1. Market Analysis, Insights and Forecast - by Application
- 7.1.1. Restaurants
- 7.1.2. Bars
- 7.1.3. Others
- 7.2. Market Analysis, Insights and Forecast - by Type
- 7.2.1. Cloud Based
- 7.2.2. On Premises
- 7.1. Market Analysis, Insights and Forecast - by Application
- 8. South America Tip Distribution Software Analysis, Insights and Forecast, 2020-2032
- 8.1. Market Analysis, Insights and Forecast - by Application
- 8.1.1. Restaurants
- 8.1.2. Bars
- 8.1.3. Others
- 8.2. Market Analysis, Insights and Forecast - by Type
- 8.2.1. Cloud Based
- 8.2.2. On Premises
- 8.1. Market Analysis, Insights and Forecast - by Application
- 9. Europe Tip Distribution Software Analysis, Insights and Forecast, 2020-2032
- 9.1. Market Analysis, Insights and Forecast - by Application
- 9.1.1. Restaurants
- 9.1.2. Bars
- 9.1.3. Others
- 9.2. Market Analysis, Insights and Forecast - by Type
- 9.2.1. Cloud Based
- 9.2.2. On Premises
- 9.1. Market Analysis, Insights and Forecast - by Application
- 10. Middle East & Africa Tip Distribution Software Analysis, Insights and Forecast, 2020-2032
- 10.1. Market Analysis, Insights and Forecast - by Application
- 10.1.1. Restaurants
- 10.1.2. Bars
- 10.1.3. Others
- 10.2. Market Analysis, Insights and Forecast - by Type
- 10.2.1. Cloud Based
- 10.2.2. On Premises
- 10.1. Market Analysis, Insights and Forecast - by Application
- 11. Asia Pacific Tip Distribution Software Analysis, Insights and Forecast, 2020-2032
- 11.1. Market Analysis, Insights and Forecast - by Application
- 11.1.1. Restaurants
- 11.1.2. Bars
- 11.1.3. Others
- 11.2. Market Analysis, Insights and Forecast - by Type
- 11.2.1. Cloud Based
- 11.2.2. On Premises
- 11.1. Market Analysis, Insights and Forecast - by Application
- 12. Competitive Analysis
- 12.1. Company Profiles
- 12.1.1 Kickfin
- 12.1.1.1. Company Overview
- 12.1.1.2. Products
- 12.1.1.3. Company Financials
- 12.1.1.4. SWOT Analysis
- 12.1.2 Dolce Software
- 12.1.2.1. Company Overview
- 12.1.2.2. Products
- 12.1.2.3. Company Financials
- 12.1.2.4. SWOT Analysis
- 12.1.3 Tip Haus
- 12.1.3.1. Company Overview
- 12.1.3.2. Products
- 12.1.3.3. Company Financials
- 12.1.3.4. SWOT Analysis
- 12.1.4 7shifts
- 12.1.4.1. Company Overview
- 12.1.4.2. Products
- 12.1.4.3. Company Financials
- 12.1.4.4. SWOT Analysis
- 12.1.5 Cloudme Software Solution
- 12.1.5.1. Company Overview
- 12.1.5.2. Products
- 12.1.5.3. Company Financials
- 12.1.5.4. SWOT Analysis
- 12.1.6 Evention
- 12.1.6.1. Company Overview
- 12.1.6.2. Products
- 12.1.6.3. Company Financials
- 12.1.6.4. SWOT Analysis
- 12.1.7 GraTrack
- 12.1.7.1. Company Overview
- 12.1.7.2. Products
- 12.1.7.3. Company Financials
- 12.1.7.4. SWOT Analysis
- 12.1.8 Netclues
- 12.1.8.1. Company Overview
- 12.1.8.2. Products
- 12.1.8.3. Company Financials
- 12.1.8.4. SWOT Analysis
- 12.1.9 Netspend
- 12.1.9.1. Company Overview
- 12.1.9.2. Products
- 12.1.9.3. Company Financials
- 12.1.9.4. SWOT Analysis
- 12.1.10 Payouts Network
- 12.1.10.1. Company Overview
- 12.1.10.2. Products
- 12.1.10.3. Company Financials
- 12.1.10.4. SWOT Analysis
- 12.1.11 SoftTouch
- 12.1.11.1. Company Overview
- 12.1.11.2. Products
- 12.1.11.3. Company Financials
- 12.1.11.4. SWOT Analysis
- 12.1.12 TipMeOut
- 12.1.12.1. Company Overview
- 12.1.12.2. Products
- 12.1.12.3. Company Financials
- 12.1.12.4. SWOT Analysis
- 12.1.13 Tipnpost
- 12.1.13.1. Company Overview
- 12.1.13.2. Products
- 12.1.13.3. Company Financials
- 12.1.13.4. SWOT Analysis
- 12.1.14 DirectTIPS Operations
- 12.1.14.1. Company Overview
- 12.1.14.2. Products
- 12.1.14.3. Company Financials
- 12.1.14.4. SWOT Analysis
- 12.1.1 Kickfin
- 12.2. Market Entropy
- 12.2.1 Company's Key Areas Served
- 12.2.2 Recent Developments
- 12.3. Company Market Share Analysis 2025
- 12.3.1 Top 5 Companies Market Share Analysis
- 12.3.2 Top 3 Companies Market Share Analysis
- 12.4. List of Potential Customers
- 13. Research Methodology
List of Figures
- Figure 1: Global Tip Distribution Software Revenue Breakdown (undefined, %) by Region 2025 & 2033
- Figure 2: North America Tip Distribution Software Revenue (undefined), by Application 2025 & 2033
- Figure 3: North America Tip Distribution Software Revenue Share (%), by Application 2025 & 2033
- Figure 4: North America Tip Distribution Software Revenue (undefined), by Type 2025 & 2033
- Figure 5: North America Tip Distribution Software Revenue Share (%), by Type 2025 & 2033
- Figure 6: North America Tip Distribution Software Revenue (undefined), by Country 2025 & 2033
- Figure 7: North America Tip Distribution Software Revenue Share (%), by Country 2025 & 2033
- Figure 8: South America Tip Distribution Software Revenue (undefined), by Application 2025 & 2033
- Figure 9: South America Tip Distribution Software Revenue Share (%), by Application 2025 & 2033
- Figure 10: South America Tip Distribution Software Revenue (undefined), by Type 2025 & 2033
- Figure 11: South America Tip Distribution Software Revenue Share (%), by Type 2025 & 2033
- Figure 12: South America Tip Distribution Software Revenue (undefined), by Country 2025 & 2033
- Figure 13: South America Tip Distribution Software Revenue Share (%), by Country 2025 & 2033
- Figure 14: Europe Tip Distribution Software Revenue (undefined), by Application 2025 & 2033
- Figure 15: Europe Tip Distribution Software Revenue Share (%), by Application 2025 & 2033
- Figure 16: Europe Tip Distribution Software Revenue (undefined), by Type 2025 & 2033
- Figure 17: Europe Tip Distribution Software Revenue Share (%), by Type 2025 & 2033
- Figure 18: Europe Tip Distribution Software Revenue (undefined), by Country 2025 & 2033
- Figure 19: Europe Tip Distribution Software Revenue Share (%), by Country 2025 & 2033
- Figure 20: Middle East & Africa Tip Distribution Software Revenue (undefined), by Application 2025 & 2033
- Figure 21: Middle East & Africa Tip Distribution Software Revenue Share (%), by Application 2025 & 2033
- Figure 22: Middle East & Africa Tip Distribution Software Revenue (undefined), by Type 2025 & 2033
- Figure 23: Middle East & Africa Tip Distribution Software Revenue Share (%), by Type 2025 & 2033
- Figure 24: Middle East & Africa Tip Distribution Software Revenue (undefined), by Country 2025 & 2033
- Figure 25: Middle East & Africa Tip Distribution Software Revenue Share (%), by Country 2025 & 2033
- Figure 26: Asia Pacific Tip Distribution Software Revenue (undefined), by Application 2025 & 2033
- Figure 27: Asia Pacific Tip Distribution Software Revenue Share (%), by Application 2025 & 2033
- Figure 28: Asia Pacific Tip Distribution Software Revenue (undefined), by Type 2025 & 2033
- Figure 29: Asia Pacific Tip Distribution Software Revenue Share (%), by Type 2025 & 2033
- Figure 30: Asia Pacific Tip Distribution Software Revenue (undefined), by Country 2025 & 2033
- Figure 31: Asia Pacific Tip Distribution Software Revenue Share (%), by Country 2025 & 2033
List of Tables
- Table 1: Global Tip Distribution Software Revenue undefined Forecast, by Application 2020 & 2033
- Table 2: Global Tip Distribution Software Revenue undefined Forecast, by Type 2020 & 2033
- Table 3: Global Tip Distribution Software Revenue undefined Forecast, by Region 2020 & 2033
- Table 4: Global Tip Distribution Software Revenue undefined Forecast, by Application 2020 & 2033
- Table 5: Global Tip Distribution Software Revenue undefined Forecast, by Type 2020 & 2033
- Table 6: Global Tip Distribution Software Revenue undefined Forecast, by Country 2020 & 2033
- Table 7: United States Tip Distribution Software Revenue (undefined) Forecast, by Application 2020 & 2033
- Table 8: Canada Tip Distribution Software Revenue (undefined) Forecast, by Application 2020 & 2033
- Table 9: Mexico Tip Distribution Software Revenue (undefined) Forecast, by Application 2020 & 2033
- Table 10: Global Tip Distribution Software Revenue undefined Forecast, by Application 2020 & 2033
- Table 11: Global Tip Distribution Software Revenue undefined Forecast, by Type 2020 & 2033
- Table 12: Global Tip Distribution Software Revenue undefined Forecast, by Country 2020 & 2033
- Table 13: Brazil Tip Distribution Software Revenue (undefined) Forecast, by Application 2020 & 2033
- Table 14: Argentina Tip Distribution Software Revenue (undefined) Forecast, by Application 2020 & 2033
- Table 15: Rest of South America Tip Distribution Software Revenue (undefined) Forecast, by Application 2020 & 2033
- Table 16: Global Tip Distribution Software Revenue undefined Forecast, by Application 2020 & 2033
- Table 17: Global Tip Distribution Software Revenue undefined Forecast, by Type 2020 & 2033
- Table 18: Global Tip Distribution Software Revenue undefined Forecast, by Country 2020 & 2033
- Table 19: United Kingdom Tip Distribution Software Revenue (undefined) Forecast, by Application 2020 & 2033
- Table 20: Germany Tip Distribution Software Revenue (undefined) Forecast, by Application 2020 & 2033
- Table 21: France Tip Distribution Software Revenue (undefined) Forecast, by Application 2020 & 2033
- Table 22: Italy Tip Distribution Software Revenue (undefined) Forecast, by Application 2020 & 2033
- Table 23: Spain Tip Distribution Software Revenue (undefined) Forecast, by Application 2020 & 2033
- Table 24: Russia Tip Distribution Software Revenue (undefined) Forecast, by Application 2020 & 2033
- Table 25: Benelux Tip Distribution Software Revenue (undefined) Forecast, by Application 2020 & 2033
- Table 26: Nordics Tip Distribution Software Revenue (undefined) Forecast, by Application 2020 & 2033
- Table 27: Rest of Europe Tip Distribution Software Revenue (undefined) Forecast, by Application 2020 & 2033
- Table 28: Global Tip Distribution Software Revenue undefined Forecast, by Application 2020 & 2033
- Table 29: Global Tip Distribution Software Revenue undefined Forecast, by Type 2020 & 2033
- Table 30: Global Tip Distribution Software Revenue undefined Forecast, by Country 2020 & 2033
- Table 31: Turkey Tip Distribution Software Revenue (undefined) Forecast, by Application 2020 & 2033
- Table 32: Israel Tip Distribution Software Revenue (undefined) Forecast, by Application 2020 & 2033
- Table 33: GCC Tip Distribution Software Revenue (undefined) Forecast, by Application 2020 & 2033
- Table 34: North Africa Tip Distribution Software Revenue (undefined) Forecast, by Application 2020 & 2033
- Table 35: South Africa Tip Distribution Software Revenue (undefined) Forecast, by Application 2020 & 2033
- Table 36: Rest of Middle East & Africa Tip Distribution Software Revenue (undefined) Forecast, by Application 2020 & 2033
- Table 37: Global Tip Distribution Software Revenue undefined Forecast, by Application 2020 & 2033
- Table 38: Global Tip Distribution Software Revenue undefined Forecast, by Type 2020 & 2033
- Table 39: Global Tip Distribution Software Revenue undefined Forecast, by Country 2020 & 2033
- Table 40: China Tip Distribution Software Revenue (undefined) Forecast, by Application 2020 & 2033
- Table 41: India Tip Distribution Software Revenue (undefined) Forecast, by Application 2020 & 2033
- Table 42: Japan Tip Distribution Software Revenue (undefined) Forecast, by Application 2020 & 2033
- Table 43: South Korea Tip Distribution Software Revenue (undefined) Forecast, by Application 2020 & 2033
- Table 44: ASEAN Tip Distribution Software Revenue (undefined) Forecast, by Application 2020 & 2033
- Table 45: Oceania Tip Distribution Software Revenue (undefined) Forecast, by Application 2020 & 2033
- Table 46: Rest of Asia Pacific Tip Distribution Software Revenue (undefined) Forecast, by Application 2020 & 2033
Frequently Asked Questions
1. What is the projected Compound Annual Growth Rate (CAGR) of the Tip Distribution Software?
The projected CAGR is approximately 9.09%.
2. Which companies are prominent players in the Tip Distribution Software?
Key companies in the market include Kickfin, Dolce Software, Tip Haus, 7shifts, Cloudme Software Solution, Evention, GraTrack, Netclues, Netspend, Payouts Network, SoftTouch, TipMeOut, Tipnpost, DirectTIPS Operations.
3. What are the main segments of the Tip Distribution Software?
The market segments include Application, Type.
4. Can you provide details about the market size?
The market size is estimated to be USD XXX N/A as of 2022.
5. What are some drivers contributing to market growth?
N/A
6. What are the notable trends driving market growth?
N/A
7. Are there any restraints impacting market growth?
N/A
8. Can you provide examples of recent developments in the market?
N/A
9. What pricing options are available for accessing the report?
Pricing options include single-user, multi-user, and enterprise licenses priced at USD 3950.00, USD 5925.00, and USD 7900.00 respectively.
10. Is the market size provided in terms of value or volume?
The market size is provided in terms of value, measured in N/A.
11. Are there any specific market keywords associated with the report?
Yes, the market keyword associated with the report is "Tip Distribution Software," which aids in identifying and referencing the specific market segment covered.
12. How do I determine which pricing option suits my needs best?
The pricing options vary based on user requirements and access needs. Individual users may opt for single-user licenses, while businesses requiring broader access may choose multi-user or enterprise licenses for cost-effective access to the report.
13. Are there any additional resources or data provided in the Tip Distribution Software report?
While the report offers comprehensive insights, it's advisable to review the specific contents or supplementary materials provided to ascertain if additional resources or data are available.
14. How can I stay updated on further developments or reports in the Tip Distribution Software?
To stay informed about further developments, trends, and reports in the Tip Distribution Software, consider subscribing to industry newsletters, following relevant companies and organizations, or regularly checking reputable industry news sources and publications.
Methodology
Step 1 - Identification of Relevant Samples Size from Population Database


Step 2 - Approaches for Defining Global Market Size (Value, Volume* & Price*)

Note*: In applicable scenarios
Step 3 - Data Sources
Primary Research
- Web Analytics
- Survey Reports
- Research Institute
- Latest Research Reports
- Opinion Leaders
Secondary Research
- Annual Reports
- White Paper
- Latest Press Release
- Industry Association
- Paid Database
- Investor Presentations

Step 4 - Data Triangulation
Involves using different sources of information in order to increase the validity of a study
These sources are likely to be stakeholders in a program - participants, other researchers, program staff, other community members, and so on.
Then we put all data in single framework & apply various statistical tools to find out the dynamic on the market.
During the analysis stage, feedback from the stakeholder groups would be compared to determine areas of agreement as well as areas of divergence