

Key Insights
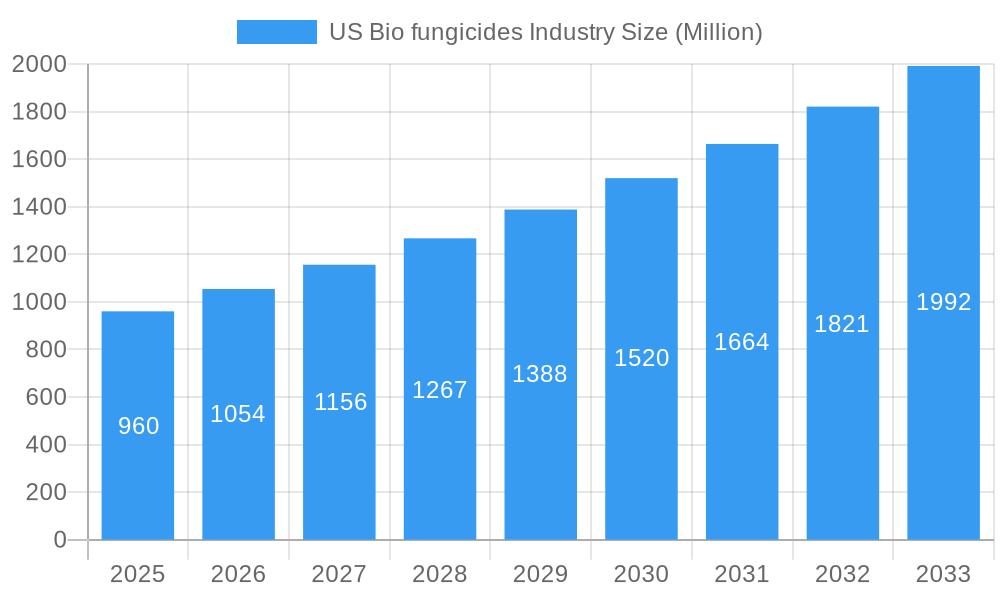
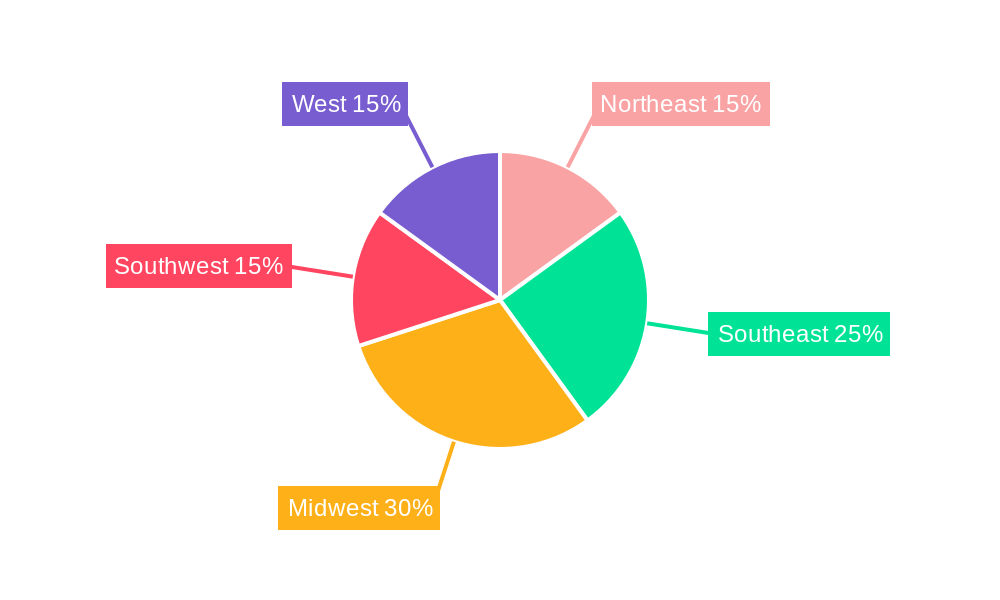
The US biofungicides market, valued at $960 million in 2025, is poised for robust growth, exhibiting a Compound Annual Growth Rate (CAGR) of 9.5% from 2025 to 2033. This expansion is driven by several factors. Increasing consumer demand for organically produced fruits, vegetables, and grains fuels the adoption of biofungicides as a safer alternative to conventional chemical fungicides. Furthermore, the growing awareness of the environmental impact of synthetic pesticides, coupled with stricter regulations regarding their use, is significantly bolstering the market. The rising incidence of plant diseases due to climate change and increasing pest pressure further contributes to market growth. The market is segmented by crop type, with grains and cereals, oilseeds, commercial crops, fruits and vegetables, and turf and ornamentals representing key segments. Major players like BioWorks Inc, Novozyme Biologicals, Isagro USA, Marrone Bio Innovations, Valent BioSciences LLC, Syngenta AG, De Sangosse Lt, and Certis USA LLC are actively engaged in research and development, expanding their product portfolios, and strengthening their market positions through strategic partnerships and acquisitions. Regional variations exist, with the Midwest, Southeast and West likely demonstrating particularly strong growth driven by intensive agricultural practices and large-scale farming operations.
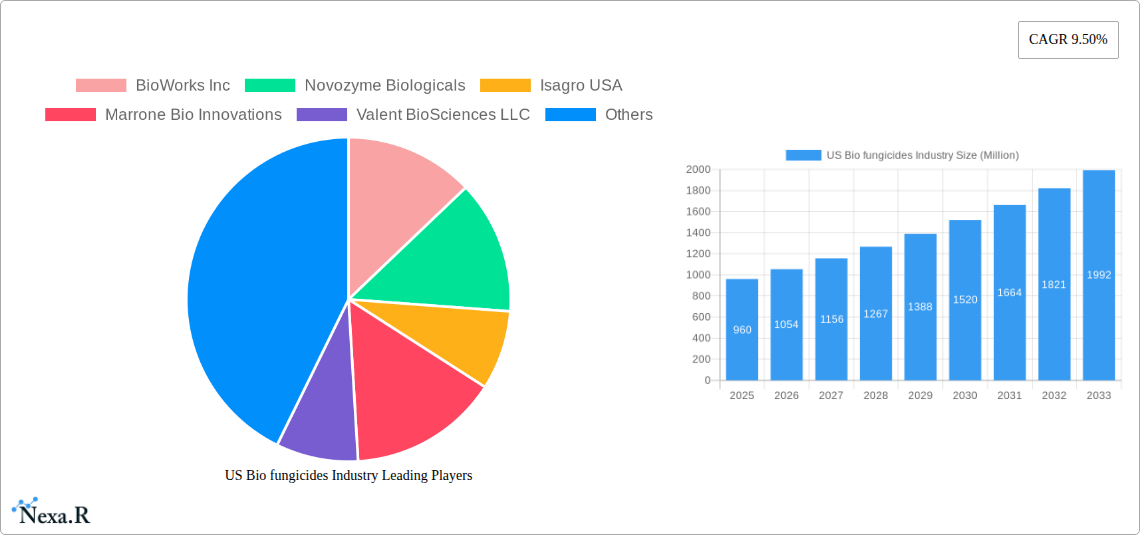
US Bio fungicides Industry Market Size (In Million)
The forecast period of 2025-2033 suggests a continued upward trajectory for the US biofungicides market, driven by sustained consumer demand for sustainable agricultural practices. Factors such as advancements in biofungicide technology, improved efficacy, and increased farmer awareness about the benefits of biofungicides will contribute to market expansion. However, challenges such as the relatively higher cost compared to chemical fungicides and inconsistent efficacy across various crops and environmental conditions will need to be addressed for sustained market penetration. Nevertheless, the overall outlook for the US biofungicides market remains highly positive, driven by a confluence of factors that position it for substantial growth in the coming years.
US Bio fungicides Industry Company Market Share
US Biofungicides Industry Market Report: 2019-2033
This comprehensive report provides an in-depth analysis of the US biofungicides market, offering valuable insights for industry professionals, investors, and researchers. Covering the period from 2019 to 2033, with a focus on 2025, this report unveils the market dynamics, growth trends, dominant segments, and key players shaping this burgeoning sector. The report segments the market by crop type: Grains and Cereals, Oilseeds, Commercial Crops, Fruits and Vegetables, and Turf and Ornamentals. The market size is presented in million USD.
US Biofungicides Industry Market Dynamics & Structure
The US biofungicides market is characterized by moderate concentration, with several key players holding significant market share, alongside numerous smaller, specialized firms. Technological innovation, driven by advancements in microbial genomics and formulation technologies, is a primary growth driver. Stringent regulatory frameworks, including EPA approvals, impact market entry and product development. Biofungicides face competition from conventional chemical fungicides, but their environmentally friendly nature and growing consumer demand for sustainable agriculture are key advantages. Mergers and acquisitions (M&A) activity is relatively frequent, reflecting industry consolidation and expansion strategies.
- Market Concentration: Moderately concentrated, with top 5 players holding approximately xx% market share in 2025.
- Technological Innovation: Significant advancements in microbial strain selection and formulation technologies are driving efficacy and market penetration.
- Regulatory Landscape: EPA regulations and approval processes influence product development timelines and market access.
- Competitive Substitutes: Conventional chemical fungicides remain a significant competitor, however growing consumer preference for organic and sustainable products is creating an advantage for biofungicides.
- M&A Activity: An average of xx M&A deals per year were recorded between 2019-2024, indicating industry consolidation.
- Innovation Barriers: High R&D costs and lengthy regulatory approval processes are key barriers to innovation.
US Biofungicides Industry Growth Trends & Insights
The US biofungicides market experienced robust growth during the historical period (2019-2024), fueled by increasing awareness of environmental concerns, the growing demand for organic produce, and stringent regulations on chemical pesticides. The market size reached xx million USD in 2024, exhibiting a CAGR of xx% during this period. The market is expected to continue its expansion during the forecast period (2025-2033), driven by technological advancements, increasing crop yields, and government support for sustainable agriculture practices. The adoption rate of biofungicides is rising steadily across various crop types, particularly in high-value crops such as fruits and vegetables. Technological disruptions, such as the development of next-generation biofungicides with enhanced efficacy and broader applications, are poised to further accelerate market growth. Consumer behavior shifts towards healthier and sustainably produced food are also driving demand for biofungicides. The market size is projected to reach xx million USD by 2033, with a projected CAGR of xx% during the forecast period.
Dominant Regions, Countries, or Segments in US Biofungicides Industry
The Fruits and Vegetables segment is currently the dominant segment within the US biofungicides market, driven by high consumer demand for organically grown produce and the susceptibility of these crops to various fungal diseases. California, Florida, and Washington are key states contributing significantly to this segment's growth, benefiting from favorable climatic conditions and established agricultural infrastructure. The Grains and Cereals segment is also experiencing significant growth, driven by increasing awareness of sustainable agricultural practices and the need to minimize the use of chemical fungicides.
- Key Drivers in Fruits and Vegetables:
- High consumer demand for organic produce.
- Favorable climatic conditions in key growing regions (California, Florida, Washington).
- High susceptibility of fruits and vegetables to fungal diseases.
- Key Drivers in Grains and Cereals:
- Growing adoption of sustainable farming practices.
- Government policies promoting biopesticide usage.
- Increasing awareness of the negative impacts of chemical fungicides.
- Market Share: Fruits and Vegetables holds approximately xx% of the total market share in 2025, while Grains and Cereals holds approximately xx%.
US Biofungicides Industry Product Landscape
The US biofungicides market offers a diverse range of products based on various microbial strains, including bacteria, fungi, and viruses. These products are formulated as liquids, powders, or granules, tailored for different application methods and crop types. Innovations focus on improving efficacy, expanding application spectrum, and enhancing environmental compatibility. New product formulations aim to enhance adhesion, persistence, and broader spectrum of disease control. Technological advancements include the use of nanotechnology for enhanced delivery and improved efficacy. Many biofungicides boast superior environmental profiles, boasting minimal impact on non-target organisms and reduced chemical residues in crops.
Key Drivers, Barriers & Challenges in US Biofungicides Industry
Key Drivers:
- Growing consumer demand for organic and sustainable food products.
- Increasing concerns about environmental safety and human health risks associated with conventional chemical fungicides.
- Favorable government policies and regulatory frameworks promoting biopesticide adoption.
- Technological advancements enhancing the efficacy and application of biofungicides.
Challenges and Restraints:
- Higher cost of production compared to conventional chemical fungicides, impacting market accessibility.
- Relatively shorter shelf life compared to chemical fungicides, impacting logistical and storage costs.
- Efficacy concerns against certain fungal pathogens, limiting widespread adoption in some crops.
- Competition from established chemical fungicides with superior market penetration. The market share of chemical fungicides is estimated at xx% in 2025, posing a significant challenge.
Emerging Opportunities in US Biofungicides Industry
- Untapped Markets: Expansion into niche markets such as organic farming, specialty crops, and horticultural applications presents substantial opportunities.
- Innovative Applications: Development of biofungicides targeting specific diseases or crop types can lead to increased market penetration.
- Evolving Consumer Preferences: Meeting the growing consumer preference for eco-friendly and sustainable products can further drive market expansion.
- Strategic Partnerships: Collaborations between biofungicide manufacturers and agricultural companies can accelerate market growth.
Growth Accelerators in the US Biofungicides Industry
Technological breakthroughs in strain improvement, formulation development, and delivery systems are key catalysts for long-term growth. Strategic partnerships with agricultural companies and distributors are vital to expanding market reach. Government initiatives promoting sustainable agriculture and reducing reliance on chemical pesticides provide further impetus. Market expansion into new crop types and geographical areas presents significant growth potential.
Key Players Shaping the US Biofungicides Market
Notable Milestones in US Biofungicides Industry Sector
- 2020: Introduction of a new biofungicide with enhanced efficacy against late blight in tomatoes by Marrone Bio Innovations.
- 2021: Acquisition of a smaller biofungicide company by Valent BioSciences LLC, expanding its product portfolio.
- 2022: Launch of a new biofungicide formulation with improved shelf life by BioWorks Inc.
- 2023: Approval of a novel biofungicide by the EPA, opening up new market opportunities.
In-Depth US Biofungicides Industry Market Outlook
The US biofungicides market is poised for significant growth over the forecast period (2025-2033). Technological advancements, increased consumer awareness of environmental concerns, and supportive government policies will continue to drive market expansion. Strategic partnerships, market diversification, and new product development will be key to capturing significant market share. The market's future potential is substantial, offering promising opportunities for both established players and new entrants.
US Bio fungicides Industry Segmentation
- 1. Production Analysis
- 2. Consumption Analysis
- 3. Import Market Analysis (Value & Volume)
- 4. Export Market Analysis (Value & Volume)
- 5. Price Trend Analysis
US Bio fungicides Industry Segmentation By Geography
-
1. North America
- 1.1. United States
- 1.2. Canada
- 1.3. Mexico
-
2. South America
- 2.1. Brazil
- 2.2. Argentina
- 2.3. Rest of South America
-
3. Europe
- 3.1. United Kingdom
- 3.2. Germany
- 3.3. France
- 3.4. Italy
- 3.5. Spain
- 3.6. Russia
- 3.7. Benelux
- 3.8. Nordics
- 3.9. Rest of Europe
-
4. Middle East & Africa
- 4.1. Turkey
- 4.2. Israel
- 4.3. GCC
- 4.4. North Africa
- 4.5. South Africa
- 4.6. Rest of Middle East & Africa
-
5. Asia Pacific
- 5.1. China
- 5.2. India
- 5.3. Japan
- 5.4. South Korea
- 5.5. ASEAN
- 5.6. Oceania
- 5.7. Rest of Asia Pacific
US Bio fungicides Industry Regional Market Share
Geographic Coverage of US Bio fungicides Industry
US Bio fungicides Industry REPORT HIGHLIGHTS
| Aspects | Details |
|---|---|
| Study Period | 2020-2034 |
| Base Year | 2025 |
| Estimated Year | 2026 |
| Forecast Period | 2026-2034 |
| Historical Period | 2020-2025 |
| Growth Rate | CAGR of 9.50% from 2020-2034 |
| Segmentation |
|
Table of Contents
- 1. Introduction
- 1.1. Research Scope
- 1.2. Market Segmentation
- 1.3. Research Methodology
- 1.4. Definitions and Assumptions
- 2. Executive Summary
- 2.1. Introduction
- 3. Market Dynamics
- 3.1. Introduction
- 3.2. Market Drivers
- 3.2.1. Adoption of Organic and Eco-friendly Farming Practices; Declining Area of Arable Land and Rising Food Security Concerns
- 3.3. Market Restrains
- 3.3.1. High Demand for Conventional and Synthetic Products; Lack of Awareness and Other Factors Limiting the Adoption of Agricultural Inoculants
- 3.4. Market Trends
- 3.4.1. Fruits and Vegetables Fastest Market Growing Segment
- 4. Market Factor Analysis
- 4.1. Porters Five Forces
- 4.2. Supply/Value Chain
- 4.3. PESTEL analysis
- 4.4. Market Entropy
- 4.5. Patent/Trademark Analysis
- 5. Global US Bio fungicides Industry Analysis, Insights and Forecast, 2020-2032
- 5.1. Market Analysis, Insights and Forecast - by Production Analysis
- 5.2. Market Analysis, Insights and Forecast - by Consumption Analysis
- 5.3. Market Analysis, Insights and Forecast - by Import Market Analysis (Value & Volume)
- 5.4. Market Analysis, Insights and Forecast - by Export Market Analysis (Value & Volume)
- 5.5. Market Analysis, Insights and Forecast - by Price Trend Analysis
- 5.6. Market Analysis, Insights and Forecast - by Region
- 5.6.1. North America
- 5.6.2. South America
- 5.6.3. Europe
- 5.6.4. Middle East & Africa
- 5.6.5. Asia Pacific
- 5.1. Market Analysis, Insights and Forecast - by Production Analysis
- 6. North America US Bio fungicides Industry Analysis, Insights and Forecast, 2020-2032
- 6.1. Market Analysis, Insights and Forecast - by Production Analysis
- 6.2. Market Analysis, Insights and Forecast - by Consumption Analysis
- 6.3. Market Analysis, Insights and Forecast - by Import Market Analysis (Value & Volume)
- 6.4. Market Analysis, Insights and Forecast - by Export Market Analysis (Value & Volume)
- 6.5. Market Analysis, Insights and Forecast - by Price Trend Analysis
- 6.1. Market Analysis, Insights and Forecast - by Production Analysis
- 7. South America US Bio fungicides Industry Analysis, Insights and Forecast, 2020-2032
- 7.1. Market Analysis, Insights and Forecast - by Production Analysis
- 7.2. Market Analysis, Insights and Forecast - by Consumption Analysis
- 7.3. Market Analysis, Insights and Forecast - by Import Market Analysis (Value & Volume)
- 7.4. Market Analysis, Insights and Forecast - by Export Market Analysis (Value & Volume)
- 7.5. Market Analysis, Insights and Forecast - by Price Trend Analysis
- 7.1. Market Analysis, Insights and Forecast - by Production Analysis
- 8. Europe US Bio fungicides Industry Analysis, Insights and Forecast, 2020-2032
- 8.1. Market Analysis, Insights and Forecast - by Production Analysis
- 8.2. Market Analysis, Insights and Forecast - by Consumption Analysis
- 8.3. Market Analysis, Insights and Forecast - by Import Market Analysis (Value & Volume)
- 8.4. Market Analysis, Insights and Forecast - by Export Market Analysis (Value & Volume)
- 8.5. Market Analysis, Insights and Forecast - by Price Trend Analysis
- 8.1. Market Analysis, Insights and Forecast - by Production Analysis
- 9. Middle East & Africa US Bio fungicides Industry Analysis, Insights and Forecast, 2020-2032
- 9.1. Market Analysis, Insights and Forecast - by Production Analysis
- 9.2. Market Analysis, Insights and Forecast - by Consumption Analysis
- 9.3. Market Analysis, Insights and Forecast - by Import Market Analysis (Value & Volume)
- 9.4. Market Analysis, Insights and Forecast - by Export Market Analysis (Value & Volume)
- 9.5. Market Analysis, Insights and Forecast - by Price Trend Analysis
- 9.1. Market Analysis, Insights and Forecast - by Production Analysis
- 10. Asia Pacific US Bio fungicides Industry Analysis, Insights and Forecast, 2020-2032
- 10.1. Market Analysis, Insights and Forecast - by Production Analysis
- 10.2. Market Analysis, Insights and Forecast - by Consumption Analysis
- 10.3. Market Analysis, Insights and Forecast - by Import Market Analysis (Value & Volume)
- 10.4. Market Analysis, Insights and Forecast - by Export Market Analysis (Value & Volume)
- 10.5. Market Analysis, Insights and Forecast - by Price Trend Analysis
- 10.1. Market Analysis, Insights and Forecast - by Production Analysis
- 11. Competitive Analysis
- 11.1. Global Market Share Analysis 2025
- 11.2. Company Profiles
- 11.2.1 BioWorks Inc
- 11.2.1.1. Overview
- 11.2.1.2. Products
- 11.2.1.3. SWOT Analysis
- 11.2.1.4. Recent Developments
- 11.2.1.5. Financials (Based on Availability)
- 11.2.2 Novozyme Biologicals
- 11.2.2.1. Overview
- 11.2.2.2. Products
- 11.2.2.3. SWOT Analysis
- 11.2.2.4. Recent Developments
- 11.2.2.5. Financials (Based on Availability)
- 11.2.3 Isagro USA
- 11.2.3.1. Overview
- 11.2.3.2. Products
- 11.2.3.3. SWOT Analysis
- 11.2.3.4. Recent Developments
- 11.2.3.5. Financials (Based on Availability)
- 11.2.4 Marrone Bio Innovations
- 11.2.4.1. Overview
- 11.2.4.2. Products
- 11.2.4.3. SWOT Analysis
- 11.2.4.4. Recent Developments
- 11.2.4.5. Financials (Based on Availability)
- 11.2.5 Valent BioSciences LLC
- 11.2.5.1. Overview
- 11.2.5.2. Products
- 11.2.5.3. SWOT Analysis
- 11.2.5.4. Recent Developments
- 11.2.5.5. Financials (Based on Availability)
- 11.2.6 Syngenta AG
- 11.2.6.1. Overview
- 11.2.6.2. Products
- 11.2.6.3. SWOT Analysis
- 11.2.6.4. Recent Developments
- 11.2.6.5. Financials (Based on Availability)
- 11.2.7 De Sangosse Lt
- 11.2.7.1. Overview
- 11.2.7.2. Products
- 11.2.7.3. SWOT Analysis
- 11.2.7.4. Recent Developments
- 11.2.7.5. Financials (Based on Availability)
- 11.2.8 Certis USA LLC
- 11.2.8.1. Overview
- 11.2.8.2. Products
- 11.2.8.3. SWOT Analysis
- 11.2.8.4. Recent Developments
- 11.2.8.5. Financials (Based on Availability)
- 11.2.1 BioWorks Inc
List of Figures
- Figure 1: Global US Bio fungicides Industry Revenue Breakdown (Million, %) by Region 2025 & 2033
- Figure 2: North America US Bio fungicides Industry Revenue (Million), by Production Analysis 2025 & 2033
- Figure 3: North America US Bio fungicides Industry Revenue Share (%), by Production Analysis 2025 & 2033
- Figure 4: North America US Bio fungicides Industry Revenue (Million), by Consumption Analysis 2025 & 2033
- Figure 5: North America US Bio fungicides Industry Revenue Share (%), by Consumption Analysis 2025 & 2033
- Figure 6: North America US Bio fungicides Industry Revenue (Million), by Import Market Analysis (Value & Volume) 2025 & 2033
- Figure 7: North America US Bio fungicides Industry Revenue Share (%), by Import Market Analysis (Value & Volume) 2025 & 2033
- Figure 8: North America US Bio fungicides Industry Revenue (Million), by Export Market Analysis (Value & Volume) 2025 & 2033
- Figure 9: North America US Bio fungicides Industry Revenue Share (%), by Export Market Analysis (Value & Volume) 2025 & 2033
- Figure 10: North America US Bio fungicides Industry Revenue (Million), by Price Trend Analysis 2025 & 2033
- Figure 11: North America US Bio fungicides Industry Revenue Share (%), by Price Trend Analysis 2025 & 2033
- Figure 12: North America US Bio fungicides Industry Revenue (Million), by Country 2025 & 2033
- Figure 13: North America US Bio fungicides Industry Revenue Share (%), by Country 2025 & 2033
- Figure 14: South America US Bio fungicides Industry Revenue (Million), by Production Analysis 2025 & 2033
- Figure 15: South America US Bio fungicides Industry Revenue Share (%), by Production Analysis 2025 & 2033
- Figure 16: South America US Bio fungicides Industry Revenue (Million), by Consumption Analysis 2025 & 2033
- Figure 17: South America US Bio fungicides Industry Revenue Share (%), by Consumption Analysis 2025 & 2033
- Figure 18: South America US Bio fungicides Industry Revenue (Million), by Import Market Analysis (Value & Volume) 2025 & 2033
- Figure 19: South America US Bio fungicides Industry Revenue Share (%), by Import Market Analysis (Value & Volume) 2025 & 2033
- Figure 20: South America US Bio fungicides Industry Revenue (Million), by Export Market Analysis (Value & Volume) 2025 & 2033
- Figure 21: South America US Bio fungicides Industry Revenue Share (%), by Export Market Analysis (Value & Volume) 2025 & 2033
- Figure 22: South America US Bio fungicides Industry Revenue (Million), by Price Trend Analysis 2025 & 2033
- Figure 23: South America US Bio fungicides Industry Revenue Share (%), by Price Trend Analysis 2025 & 2033
- Figure 24: South America US Bio fungicides Industry Revenue (Million), by Country 2025 & 2033
- Figure 25: South America US Bio fungicides Industry Revenue Share (%), by Country 2025 & 2033
- Figure 26: Europe US Bio fungicides Industry Revenue (Million), by Production Analysis 2025 & 2033
- Figure 27: Europe US Bio fungicides Industry Revenue Share (%), by Production Analysis 2025 & 2033
- Figure 28: Europe US Bio fungicides Industry Revenue (Million), by Consumption Analysis 2025 & 2033
- Figure 29: Europe US Bio fungicides Industry Revenue Share (%), by Consumption Analysis 2025 & 2033
- Figure 30: Europe US Bio fungicides Industry Revenue (Million), by Import Market Analysis (Value & Volume) 2025 & 2033
- Figure 31: Europe US Bio fungicides Industry Revenue Share (%), by Import Market Analysis (Value & Volume) 2025 & 2033
- Figure 32: Europe US Bio fungicides Industry Revenue (Million), by Export Market Analysis (Value & Volume) 2025 & 2033
- Figure 33: Europe US Bio fungicides Industry Revenue Share (%), by Export Market Analysis (Value & Volume) 2025 & 2033
- Figure 34: Europe US Bio fungicides Industry Revenue (Million), by Price Trend Analysis 2025 & 2033
- Figure 35: Europe US Bio fungicides Industry Revenue Share (%), by Price Trend Analysis 2025 & 2033
- Figure 36: Europe US Bio fungicides Industry Revenue (Million), by Country 2025 & 2033
- Figure 37: Europe US Bio fungicides Industry Revenue Share (%), by Country 2025 & 2033
- Figure 38: Middle East & Africa US Bio fungicides Industry Revenue (Million), by Production Analysis 2025 & 2033
- Figure 39: Middle East & Africa US Bio fungicides Industry Revenue Share (%), by Production Analysis 2025 & 2033
- Figure 40: Middle East & Africa US Bio fungicides Industry Revenue (Million), by Consumption Analysis 2025 & 2033
- Figure 41: Middle East & Africa US Bio fungicides Industry Revenue Share (%), by Consumption Analysis 2025 & 2033
- Figure 42: Middle East & Africa US Bio fungicides Industry Revenue (Million), by Import Market Analysis (Value & Volume) 2025 & 2033
- Figure 43: Middle East & Africa US Bio fungicides Industry Revenue Share (%), by Import Market Analysis (Value & Volume) 2025 & 2033
- Figure 44: Middle East & Africa US Bio fungicides Industry Revenue (Million), by Export Market Analysis (Value & Volume) 2025 & 2033
- Figure 45: Middle East & Africa US Bio fungicides Industry Revenue Share (%), by Export Market Analysis (Value & Volume) 2025 & 2033
- Figure 46: Middle East & Africa US Bio fungicides Industry Revenue (Million), by Price Trend Analysis 2025 & 2033
- Figure 47: Middle East & Africa US Bio fungicides Industry Revenue Share (%), by Price Trend Analysis 2025 & 2033
- Figure 48: Middle East & Africa US Bio fungicides Industry Revenue (Million), by Country 2025 & 2033
- Figure 49: Middle East & Africa US Bio fungicides Industry Revenue Share (%), by Country 2025 & 2033
- Figure 50: Asia Pacific US Bio fungicides Industry Revenue (Million), by Production Analysis 2025 & 2033
- Figure 51: Asia Pacific US Bio fungicides Industry Revenue Share (%), by Production Analysis 2025 & 2033
- Figure 52: Asia Pacific US Bio fungicides Industry Revenue (Million), by Consumption Analysis 2025 & 2033
- Figure 53: Asia Pacific US Bio fungicides Industry Revenue Share (%), by Consumption Analysis 2025 & 2033
- Figure 54: Asia Pacific US Bio fungicides Industry Revenue (Million), by Import Market Analysis (Value & Volume) 2025 & 2033
- Figure 55: Asia Pacific US Bio fungicides Industry Revenue Share (%), by Import Market Analysis (Value & Volume) 2025 & 2033
- Figure 56: Asia Pacific US Bio fungicides Industry Revenue (Million), by Export Market Analysis (Value & Volume) 2025 & 2033
- Figure 57: Asia Pacific US Bio fungicides Industry Revenue Share (%), by Export Market Analysis (Value & Volume) 2025 & 2033
- Figure 58: Asia Pacific US Bio fungicides Industry Revenue (Million), by Price Trend Analysis 2025 & 2033
- Figure 59: Asia Pacific US Bio fungicides Industry Revenue Share (%), by Price Trend Analysis 2025 & 2033
- Figure 60: Asia Pacific US Bio fungicides Industry Revenue (Million), by Country 2025 & 2033
- Figure 61: Asia Pacific US Bio fungicides Industry Revenue Share (%), by Country 2025 & 2033
List of Tables
- Table 1: Global US Bio fungicides Industry Revenue Million Forecast, by Production Analysis 2020 & 2033
- Table 2: Global US Bio fungicides Industry Revenue Million Forecast, by Consumption Analysis 2020 & 2033
- Table 3: Global US Bio fungicides Industry Revenue Million Forecast, by Import Market Analysis (Value & Volume) 2020 & 2033
- Table 4: Global US Bio fungicides Industry Revenue Million Forecast, by Export Market Analysis (Value & Volume) 2020 & 2033
- Table 5: Global US Bio fungicides Industry Revenue Million Forecast, by Price Trend Analysis 2020 & 2033
- Table 6: Global US Bio fungicides Industry Revenue Million Forecast, by Region 2020 & 2033
- Table 7: Global US Bio fungicides Industry Revenue Million Forecast, by Production Analysis 2020 & 2033
- Table 8: Global US Bio fungicides Industry Revenue Million Forecast, by Consumption Analysis 2020 & 2033
- Table 9: Global US Bio fungicides Industry Revenue Million Forecast, by Import Market Analysis (Value & Volume) 2020 & 2033
- Table 10: Global US Bio fungicides Industry Revenue Million Forecast, by Export Market Analysis (Value & Volume) 2020 & 2033
- Table 11: Global US Bio fungicides Industry Revenue Million Forecast, by Price Trend Analysis 2020 & 2033
- Table 12: Global US Bio fungicides Industry Revenue Million Forecast, by Country 2020 & 2033
- Table 13: United States US Bio fungicides Industry Revenue (Million) Forecast, by Application 2020 & 2033
- Table 14: Canada US Bio fungicides Industry Revenue (Million) Forecast, by Application 2020 & 2033
- Table 15: Mexico US Bio fungicides Industry Revenue (Million) Forecast, by Application 2020 & 2033
- Table 16: Global US Bio fungicides Industry Revenue Million Forecast, by Production Analysis 2020 & 2033
- Table 17: Global US Bio fungicides Industry Revenue Million Forecast, by Consumption Analysis 2020 & 2033
- Table 18: Global US Bio fungicides Industry Revenue Million Forecast, by Import Market Analysis (Value & Volume) 2020 & 2033
- Table 19: Global US Bio fungicides Industry Revenue Million Forecast, by Export Market Analysis (Value & Volume) 2020 & 2033
- Table 20: Global US Bio fungicides Industry Revenue Million Forecast, by Price Trend Analysis 2020 & 2033
- Table 21: Global US Bio fungicides Industry Revenue Million Forecast, by Country 2020 & 2033
- Table 22: Brazil US Bio fungicides Industry Revenue (Million) Forecast, by Application 2020 & 2033
- Table 23: Argentina US Bio fungicides Industry Revenue (Million) Forecast, by Application 2020 & 2033
- Table 24: Rest of South America US Bio fungicides Industry Revenue (Million) Forecast, by Application 2020 & 2033
- Table 25: Global US Bio fungicides Industry Revenue Million Forecast, by Production Analysis 2020 & 2033
- Table 26: Global US Bio fungicides Industry Revenue Million Forecast, by Consumption Analysis 2020 & 2033
- Table 27: Global US Bio fungicides Industry Revenue Million Forecast, by Import Market Analysis (Value & Volume) 2020 & 2033
- Table 28: Global US Bio fungicides Industry Revenue Million Forecast, by Export Market Analysis (Value & Volume) 2020 & 2033
- Table 29: Global US Bio fungicides Industry Revenue Million Forecast, by Price Trend Analysis 2020 & 2033
- Table 30: Global US Bio fungicides Industry Revenue Million Forecast, by Country 2020 & 2033
- Table 31: United Kingdom US Bio fungicides Industry Revenue (Million) Forecast, by Application 2020 & 2033
- Table 32: Germany US Bio fungicides Industry Revenue (Million) Forecast, by Application 2020 & 2033
- Table 33: France US Bio fungicides Industry Revenue (Million) Forecast, by Application 2020 & 2033
- Table 34: Italy US Bio fungicides Industry Revenue (Million) Forecast, by Application 2020 & 2033
- Table 35: Spain US Bio fungicides Industry Revenue (Million) Forecast, by Application 2020 & 2033
- Table 36: Russia US Bio fungicides Industry Revenue (Million) Forecast, by Application 2020 & 2033
- Table 37: Benelux US Bio fungicides Industry Revenue (Million) Forecast, by Application 2020 & 2033
- Table 38: Nordics US Bio fungicides Industry Revenue (Million) Forecast, by Application 2020 & 2033
- Table 39: Rest of Europe US Bio fungicides Industry Revenue (Million) Forecast, by Application 2020 & 2033
- Table 40: Global US Bio fungicides Industry Revenue Million Forecast, by Production Analysis 2020 & 2033
- Table 41: Global US Bio fungicides Industry Revenue Million Forecast, by Consumption Analysis 2020 & 2033
- Table 42: Global US Bio fungicides Industry Revenue Million Forecast, by Import Market Analysis (Value & Volume) 2020 & 2033
- Table 43: Global US Bio fungicides Industry Revenue Million Forecast, by Export Market Analysis (Value & Volume) 2020 & 2033
- Table 44: Global US Bio fungicides Industry Revenue Million Forecast, by Price Trend Analysis 2020 & 2033
- Table 45: Global US Bio fungicides Industry Revenue Million Forecast, by Country 2020 & 2033
- Table 46: Turkey US Bio fungicides Industry Revenue (Million) Forecast, by Application 2020 & 2033
- Table 47: Israel US Bio fungicides Industry Revenue (Million) Forecast, by Application 2020 & 2033
- Table 48: GCC US Bio fungicides Industry Revenue (Million) Forecast, by Application 2020 & 2033
- Table 49: North Africa US Bio fungicides Industry Revenue (Million) Forecast, by Application 2020 & 2033
- Table 50: South Africa US Bio fungicides Industry Revenue (Million) Forecast, by Application 2020 & 2033
- Table 51: Rest of Middle East & Africa US Bio fungicides Industry Revenue (Million) Forecast, by Application 2020 & 2033
- Table 52: Global US Bio fungicides Industry Revenue Million Forecast, by Production Analysis 2020 & 2033
- Table 53: Global US Bio fungicides Industry Revenue Million Forecast, by Consumption Analysis 2020 & 2033
- Table 54: Global US Bio fungicides Industry Revenue Million Forecast, by Import Market Analysis (Value & Volume) 2020 & 2033
- Table 55: Global US Bio fungicides Industry Revenue Million Forecast, by Export Market Analysis (Value & Volume) 2020 & 2033
- Table 56: Global US Bio fungicides Industry Revenue Million Forecast, by Price Trend Analysis 2020 & 2033
- Table 57: Global US Bio fungicides Industry Revenue Million Forecast, by Country 2020 & 2033
- Table 58: China US Bio fungicides Industry Revenue (Million) Forecast, by Application 2020 & 2033
- Table 59: India US Bio fungicides Industry Revenue (Million) Forecast, by Application 2020 & 2033
- Table 60: Japan US Bio fungicides Industry Revenue (Million) Forecast, by Application 2020 & 2033
- Table 61: South Korea US Bio fungicides Industry Revenue (Million) Forecast, by Application 2020 & 2033
- Table 62: ASEAN US Bio fungicides Industry Revenue (Million) Forecast, by Application 2020 & 2033
- Table 63: Oceania US Bio fungicides Industry Revenue (Million) Forecast, by Application 2020 & 2033
- Table 64: Rest of Asia Pacific US Bio fungicides Industry Revenue (Million) Forecast, by Application 2020 & 2033
Frequently Asked Questions
1. What is the projected Compound Annual Growth Rate (CAGR) of the US Bio fungicides Industry?
The projected CAGR is approximately 9.50%.
2. Which companies are prominent players in the US Bio fungicides Industry?
Key companies in the market include BioWorks Inc, Novozyme Biologicals, Isagro USA, Marrone Bio Innovations, Valent BioSciences LLC, Syngenta AG, De Sangosse Lt, Certis USA LLC.
3. What are the main segments of the US Bio fungicides Industry?
The market segments include Production Analysis, Consumption Analysis, Import Market Analysis (Value & Volume), Export Market Analysis (Value & Volume), Price Trend Analysis.
4. Can you provide details about the market size?
The market size is estimated to be USD 0.96 Million as of 2022.
5. What are some drivers contributing to market growth?
Adoption of Organic and Eco-friendly Farming Practices; Declining Area of Arable Land and Rising Food Security Concerns.
6. What are the notable trends driving market growth?
Fruits and Vegetables Fastest Market Growing Segment.
7. Are there any restraints impacting market growth?
High Demand for Conventional and Synthetic Products; Lack of Awareness and Other Factors Limiting the Adoption of Agricultural Inoculants.
8. Can you provide examples of recent developments in the market?
N/A
9. What pricing options are available for accessing the report?
Pricing options include single-user, multi-user, and enterprise licenses priced at USD 3800, USD 4500, and USD 5800 respectively.
10. Is the market size provided in terms of value or volume?
The market size is provided in terms of value, measured in Million.
11. Are there any specific market keywords associated with the report?
Yes, the market keyword associated with the report is "US Bio fungicides Industry," which aids in identifying and referencing the specific market segment covered.
12. How do I determine which pricing option suits my needs best?
The pricing options vary based on user requirements and access needs. Individual users may opt for single-user licenses, while businesses requiring broader access may choose multi-user or enterprise licenses for cost-effective access to the report.
13. Are there any additional resources or data provided in the US Bio fungicides Industry report?
While the report offers comprehensive insights, it's advisable to review the specific contents or supplementary materials provided to ascertain if additional resources or data are available.
14. How can I stay updated on further developments or reports in the US Bio fungicides Industry?
To stay informed about further developments, trends, and reports in the US Bio fungicides Industry, consider subscribing to industry newsletters, following relevant companies and organizations, or regularly checking reputable industry news sources and publications.
Methodology
Step 1 - Identification of Relevant Samples Size from Population Database


Step 2 - Approaches for Defining Global Market Size (Value, Volume* & Price*)

Note*: In applicable scenarios
Step 3 - Data Sources
Primary Research
- Web Analytics
- Survey Reports
- Research Institute
- Latest Research Reports
- Opinion Leaders
Secondary Research
- Annual Reports
- White Paper
- Latest Press Release
- Industry Association
- Paid Database
- Investor Presentations

Step 4 - Data Triangulation
Involves using different sources of information in order to increase the validity of a study
These sources are likely to be stakeholders in a program - participants, other researchers, program staff, other community members, and so on.
Then we put all data in single framework & apply various statistical tools to find out the dynamic on the market.
During the analysis stage, feedback from the stakeholder groups would be compared to determine areas of agreement as well as areas of divergence