

Key Insights
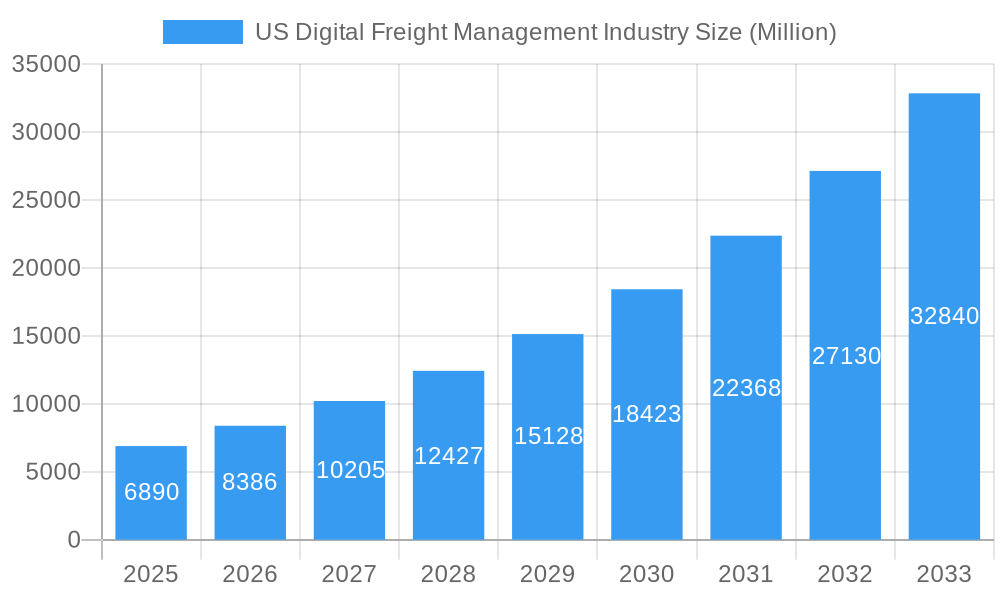
The US digital freight management market is experiencing robust growth, projected to reach $6.89 billion in 2025 and maintain a Compound Annual Growth Rate (CAGR) of 21.72% from 2025 to 2033. This expansion is fueled by several key factors. The increasing adoption of digital technologies across the logistics sector, driven by the need for enhanced efficiency, transparency, and cost optimization, is a major catalyst. E-commerce's continued boom necessitates faster, more reliable delivery systems, further fueling demand for digital freight management solutions. Furthermore, the sector's fragmentation presents opportunities for consolidation and the emergence of sophisticated platforms offering end-to-end visibility and automation. Large enterprises and governments are actively adopting these technologies to streamline their supply chains, while SMEs benefit from increased accessibility and cost-effectiveness. The diverse modes of transportation – ocean, air, and land – each contribute to the market's complexity and growth potential. While challenges remain, such as the need for robust cybersecurity measures and potential integration difficulties with legacy systems, the overall market trajectory indicates strong future prospects.
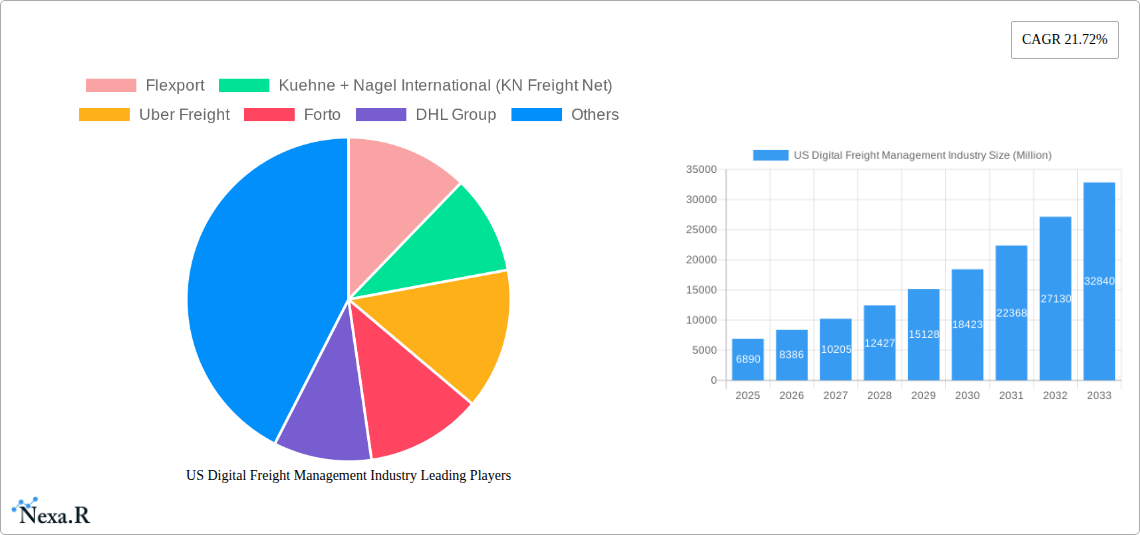
US Digital Freight Management Industry Market Size (In Billion)
The regional breakdown within the US reveals significant growth opportunities across all regions – Northeast, Southeast, Midwest, Southwest, and West. However, the distribution of market share likely correlates with existing economic activity and logistics infrastructure. The leading companies—Flexport, Kuehne + Nagel, Uber Freight, Forto, and DHL—are strategically positioned to capitalize on this growth, through continuous innovation, strategic partnerships, and expansion into new markets and service offerings. Competition is intensifying with the emergence of smaller, specialized players focused on niche segments or specific transportation modes. The long-term outlook remains positive, anticipating continued technological advancements driving automation, predictive analytics, and enhanced supply chain visibility, thereby solidifying the digital freight management market's prominent role in the future of logistics.
US Digital Freight Management Industry Company Market Share
US Digital Freight Management Industry Market Report: 2019-2033
This comprehensive report provides an in-depth analysis of the US Digital Freight Management industry, encompassing market dynamics, growth trends, key players, and future outlook. The study period covers 2019-2033, with 2025 as the base and estimated year. This report is crucial for businesses, investors, and stakeholders seeking to understand and capitalize on the opportunities within this rapidly evolving sector. The report analyzes the parent market of Logistics and Transportation and the child market of Digital Freight Management, offering granular insights into various segments.
US Digital Freight Management Industry Market Dynamics & Structure
The US digital freight management market is characterized by intense competition, rapid technological advancements, and evolving regulatory landscapes. Market concentration is moderate, with several large players alongside numerous smaller, specialized firms. The industry is witnessing significant mergers and acquisitions (M&A) activity, exemplified by the October 2022 merger of Transplace and Uber Freight. This consolidation is driving technological innovation and network expansion, creating both opportunities and challenges for existing and emerging players.
- Market Concentration: Moderate, with a few dominant players and numerous smaller firms. Market share for the top 5 players is estimated at xx%.
- Technological Innovation: AI, machine learning, and blockchain are key drivers, improving efficiency and transparency across the supply chain. Barriers to innovation include legacy systems and data integration challenges.
- Regulatory Framework: Federal and state regulations concerning trucking, safety, and data privacy influence market operations.
- Competitive Product Substitutes: Traditional freight forwarding methods pose some competition, but digital solutions offer superior efficiency and transparency.
- End-User Demographics: The industry caters to SMEs, large enterprises, and government agencies, each with unique needs and digital adoption rates. Large Enterprises represent the largest segment, with xx% market share in 2025.
- M&A Trends: Consolidation is a dominant trend, with an estimated xx M&A deals in the last 5 years, driven by the need for scale and technological integration.
US Digital Freight Management Industry Growth Trends & Insights
The US digital freight management market is experiencing robust growth, driven by increasing adoption of digital platforms across the supply chain. The market size is projected to reach $xx Million by 2025 and is expected to grow at a Compound Annual Growth Rate (CAGR) of xx% from 2025 to 2033. This growth is fueled by several factors including: increasing e-commerce activity, demand for real-time visibility and efficiency, and the need to optimize logistics operations. Technological advancements like AI-powered route optimization and predictive analytics are further accelerating market expansion. Consumer behavior shifts towards increased online purchasing and on-demand delivery are also major contributors. Market penetration in the SME segment is expected to reach xx% by 2033.
Dominant Regions, Countries, or Segments in US Digital Freight Management Industry
The US digital freight management market is geographically diverse, with significant activity across various regions. However, the largest segment by firm type is Large Enterprises, driven by their higher volumes and budgets for digital solutions. By mode of transportation, the Land segment dominates, accounting for xx% of the market, followed by Ocean and Air, reflecting the volume of goods transported by land across the country. Key growth drivers include robust e-commerce, advancements in transportation infrastructure, and government initiatives to support digitalization.
- Large Enterprises: High adoption rate due to significant cost and efficiency benefits.
- Land Transportation: Predominant mode due to extensive road networks and high freight volumes.
- Economic Policies: Government initiatives promoting infrastructure development and digital adoption.
US Digital Freight Management Industry Product Landscape
Digital freight management platforms offer a range of functionalities, including load matching, real-time tracking, shipment management, and analytics. These platforms are designed to streamline logistics processes, reduce costs, and improve efficiency. Key innovations include AI-powered route optimization, predictive analytics for demand forecasting, and blockchain technology for enhanced security and transparency. The unique selling propositions of these platforms lie in their ability to provide end-to-end visibility, data-driven decision-making, and seamless integration with existing supply chain systems.
Key Drivers, Barriers & Challenges in US Digital Freight Management Industry
Key Drivers:
- Technological advancements such as AI, machine learning, and blockchain.
- Growing e-commerce and the need for efficient delivery solutions.
- Government initiatives to improve transportation infrastructure and logistics.
Challenges:
- Data security and privacy concerns.
- Integration challenges with legacy systems.
- High implementation costs for smaller firms.
- Competition from established freight forwarders.
- Driver shortage impacting land transportation capacity.
Emerging Opportunities in US Digital Freight Management Industry
- Expansion into niche markets such as last-mile delivery and specialized freight.
- Development of integrated platforms offering end-to-end supply chain visibility.
- Increased adoption of blockchain technology to improve transparency and security.
- Leveraging AI and machine learning for predictive analytics and route optimization.
Growth Accelerators in the US Digital Freight Management Industry
Technological advancements, strategic partnerships between technology providers and logistics companies, and expansion into new markets (e.g., last-mile delivery) will be key growth accelerators in the coming years. Increased investment in AI and machine learning capabilities, along with the development of sophisticated data analytics platforms, will further drive market expansion.
Key Players Shaping the US Digital Freight Management Industry Market
- Flexport
- Kuehne + Nagel International (KN Freight Net)
- Uber Freight
- Forto
- DHL Group
- Agility Logistics Pvt Ltd
- Expeditors International
- InstaFreight
- Turvo
- iContainers
- Twill
- NYSHEX
- Transporteca
- uShip
- Convoy
- Kontainers
Notable Milestones in US Digital Freight Management Industry Sector
- October 2022: Transplace and Uber Freight merger creates a massive integrated network platform.
- September 2022: Kuehne+Nagel invests in a new healthcare contract logistics network.
In-Depth US Digital Freight Management Industry Market Outlook
The US digital freight management market is poised for continued strong growth, driven by technological innovation and increasing adoption across various segments. Strategic partnerships, expansion into new markets, and the development of integrated platforms will be key factors shaping the industry's future. The potential for significant efficiency gains and cost savings will attract further investment and drive long-term market expansion.
US Digital Freight Management Industry Segmentation
-
1. Mode of Transportation
- 1.1. Ocean
- 1.2. Air
- 1.3. Land
-
2. Firm Type
- 2.1. SMEs
- 2.2. Large Enterprises and Governments
US Digital Freight Management Industry Segmentation By Geography
-
1. North America
- 1.1. United States
- 1.2. Canada
- 1.3. Mexico
-
2. South America
- 2.1. Brazil
- 2.2. Argentina
- 2.3. Rest of South America
-
3. Europe
- 3.1. United Kingdom
- 3.2. Germany
- 3.3. France
- 3.4. Italy
- 3.5. Spain
- 3.6. Russia
- 3.7. Benelux
- 3.8. Nordics
- 3.9. Rest of Europe
-
4. Middle East & Africa
- 4.1. Turkey
- 4.2. Israel
- 4.3. GCC
- 4.4. North Africa
- 4.5. South Africa
- 4.6. Rest of Middle East & Africa
-
5. Asia Pacific
- 5.1. China
- 5.2. India
- 5.3. Japan
- 5.4. South Korea
- 5.5. ASEAN
- 5.6. Oceania
- 5.7. Rest of Asia Pacific
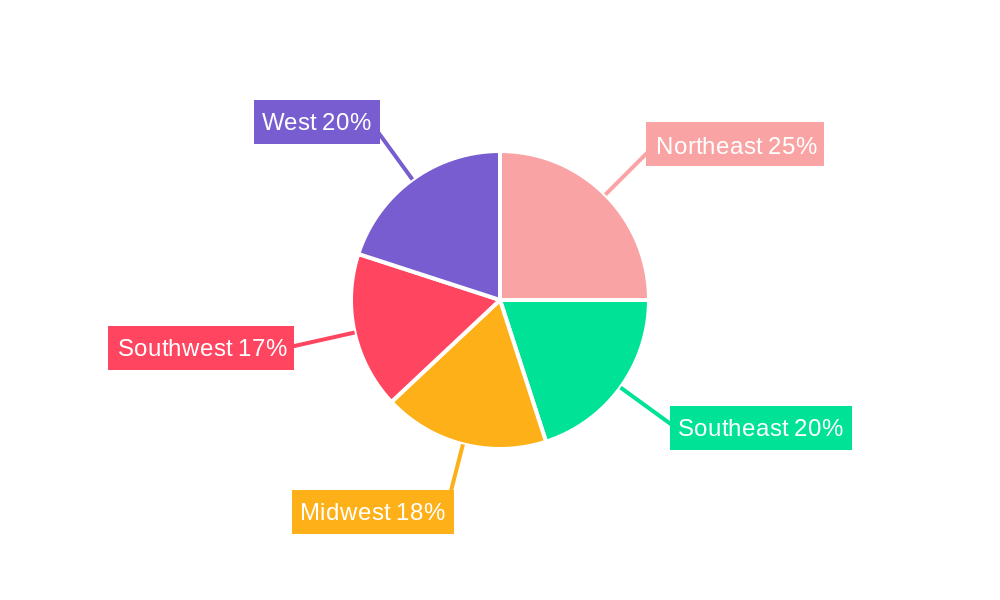
US Digital Freight Management Industry Regional Market Share
Geographic Coverage of US Digital Freight Management Industry
US Digital Freight Management Industry REPORT HIGHLIGHTS
| Aspects | Details |
|---|---|
| Study Period | 2020-2034 |
| Base Year | 2025 |
| Estimated Year | 2026 |
| Forecast Period | 2026-2034 |
| Historical Period | 2020-2025 |
| Growth Rate | CAGR of 21.72% from 2020-2034 |
| Segmentation |
|
Table of Contents
- 1. Introduction
- 1.1. Research Scope
- 1.2. Market Segmentation
- 1.3. Research Objective
- 1.4. Definitions and Assumptions
- 2. Executive Summary
- 2.1. Market Snapshot
- 3. Market Dynamics
- 3.1. Market Drivers
- 3.2. Market Restrains
- 3.3. Market Trends
- 3.4. Market Opportunities
- 4. Market Factor Analysis
- 4.1. Porters Five Forces
- 4.1.1. Bargaining Power of Suppliers
- 4.1.2. Bargaining Power of Buyers
- 4.1.3. Threat of New Entrants
- 4.1.4. Threat of Substitutes
- 4.1.5. Competitive Rivalry
- 4.2. PESTEL analysis
- 4.3. BCG Analysis
- 4.3.1. Stars (High Growth, High Market Share)
- 4.3.2. Cash Cows (Low Growth, High Market Share)
- 4.3.3. Question Mark (High Growth, Low Market Share)
- 4.3.4. Dogs (Low Growth, Low Market Share)
- 4.4. Ansoff Matrix Analysis
- 4.5. Supply Chain Analysis
- 4.6. Regulatory Landscape
- 4.7. Current Market Potential and Opportunity Assessment (TAM–SAM–SOM Framework)
- 4.8. NRP Analyst Note
- 4.1. Porters Five Forces
- 5. Market Analysis, Insights and Forecast 2021-2033
- 5.1. Market Analysis, Insights and Forecast - by Mode of Transportation
- 5.1.1. Ocean
- 5.1.2. Air
- 5.1.3. Land
- 5.2. Market Analysis, Insights and Forecast - by Firm Type
- 5.2.1. SMEs
- 5.2.2. Large Enterprises and Governments
- 5.3. Market Analysis, Insights and Forecast - by Region
- 5.3.1. North America
- 5.3.2. South America
- 5.3.3. Europe
- 5.3.4. Middle East & Africa
- 5.3.5. Asia Pacific
- 5.1. Market Analysis, Insights and Forecast - by Mode of Transportation
- 6. Global US Digital Freight Management Industry Analysis, Insights and Forecast, 2021-2033
- 6.1. Market Analysis, Insights and Forecast - by Mode of Transportation
- 6.1.1. Ocean
- 6.1.2. Air
- 6.1.3. Land
- 6.2. Market Analysis, Insights and Forecast - by Firm Type
- 6.2.1. SMEs
- 6.2.2. Large Enterprises and Governments
- 6.1. Market Analysis, Insights and Forecast - by Mode of Transportation
- 7. North America US Digital Freight Management Industry Analysis, Insights and Forecast, 2020-2032
- 7.1. Market Analysis, Insights and Forecast - by Mode of Transportation
- 7.1.1. Ocean
- 7.1.2. Air
- 7.1.3. Land
- 7.2. Market Analysis, Insights and Forecast - by Firm Type
- 7.2.1. SMEs
- 7.2.2. Large Enterprises and Governments
- 7.1. Market Analysis, Insights and Forecast - by Mode of Transportation
- 8. South America US Digital Freight Management Industry Analysis, Insights and Forecast, 2020-2032
- 8.1. Market Analysis, Insights and Forecast - by Mode of Transportation
- 8.1.1. Ocean
- 8.1.2. Air
- 8.1.3. Land
- 8.2. Market Analysis, Insights and Forecast - by Firm Type
- 8.2.1. SMEs
- 8.2.2. Large Enterprises and Governments
- 8.1. Market Analysis, Insights and Forecast - by Mode of Transportation
- 9. Europe US Digital Freight Management Industry Analysis, Insights and Forecast, 2020-2032
- 9.1. Market Analysis, Insights and Forecast - by Mode of Transportation
- 9.1.1. Ocean
- 9.1.2. Air
- 9.1.3. Land
- 9.2. Market Analysis, Insights and Forecast - by Firm Type
- 9.2.1. SMEs
- 9.2.2. Large Enterprises and Governments
- 9.1. Market Analysis, Insights and Forecast - by Mode of Transportation
- 10. Middle East & Africa US Digital Freight Management Industry Analysis, Insights and Forecast, 2020-2032
- 10.1. Market Analysis, Insights and Forecast - by Mode of Transportation
- 10.1.1. Ocean
- 10.1.2. Air
- 10.1.3. Land
- 10.2. Market Analysis, Insights and Forecast - by Firm Type
- 10.2.1. SMEs
- 10.2.2. Large Enterprises and Governments
- 10.1. Market Analysis, Insights and Forecast - by Mode of Transportation
- 11. Asia Pacific US Digital Freight Management Industry Analysis, Insights and Forecast, 2020-2032
- 11.1. Market Analysis, Insights and Forecast - by Mode of Transportation
- 11.1.1. Ocean
- 11.1.2. Air
- 11.1.3. Land
- 11.2. Market Analysis, Insights and Forecast - by Firm Type
- 11.2.1. SMEs
- 11.2.2. Large Enterprises and Governments
- 11.1. Market Analysis, Insights and Forecast - by Mode of Transportation
- 12. Competitive Analysis
- 12.1. Company Profiles
- 12.1.1 Flexport
- 12.1.1.1. Company Overview
- 12.1.1.2. Products
- 12.1.1.3. Company Financials
- 12.1.1.4. SWOT Analysis
- 12.1.2 Kuehne + Nagel International (KN Freight Net)
- 12.1.2.1. Company Overview
- 12.1.2.2. Products
- 12.1.2.3. Company Financials
- 12.1.2.4. SWOT Analysis
- 12.1.3 Uber Freight
- 12.1.3.1. Company Overview
- 12.1.3.2. Products
- 12.1.3.3. Company Financials
- 12.1.3.4. SWOT Analysis
- 12.1.4 Forto
- 12.1.4.1. Company Overview
- 12.1.4.2. Products
- 12.1.4.3. Company Financials
- 12.1.4.4. SWOT Analysis
- 12.1.5 DHL Group
- 12.1.5.1. Company Overview
- 12.1.5.2. Products
- 12.1.5.3. Company Financials
- 12.1.5.4. SWOT Analysis
- 12.1.6 Agility Logistics Pvt Ltd
- 12.1.6.1. Company Overview
- 12.1.6.2. Products
- 12.1.6.3. Company Financials
- 12.1.6.4. SWOT Analysis
- 12.1.7 Expeditors International
- 12.1.7.1. Company Overview
- 12.1.7.2. Products
- 12.1.7.3. Company Financials
- 12.1.7.4. SWOT Analysis
- 12.1.8 InstaFreight
- 12.1.8.1. Company Overview
- 12.1.8.2. Products
- 12.1.8.3. Company Financials
- 12.1.8.4. SWOT Analysis
- 12.1.9 Turvo
- 12.1.9.1. Company Overview
- 12.1.9.2. Products
- 12.1.9.3. Company Financials
- 12.1.9.4. SWOT Analysis
- 12.1.10 iContainers
- 12.1.10.1. Company Overview
- 12.1.10.2. Products
- 12.1.10.3. Company Financials
- 12.1.10.4. SWOT Analysis
- 12.1.11 Twill
- 12.1.11.1. Company Overview
- 12.1.11.2. Products
- 12.1.11.3. Company Financials
- 12.1.11.4. SWOT Analysis
- 12.1.12 NYSHEX
- 12.1.12.1. Company Overview
- 12.1.12.2. Products
- 12.1.12.3. Company Financials
- 12.1.12.4. SWOT Analysis
- 12.1.13 Transporteca
- 12.1.13.1. Company Overview
- 12.1.13.2. Products
- 12.1.13.3. Company Financials
- 12.1.13.4. SWOT Analysis
- 12.1.14 uShip**List Not Exhaustive
- 12.1.14.1. Company Overview
- 12.1.14.2. Products
- 12.1.14.3. Company Financials
- 12.1.14.4. SWOT Analysis
- 12.1.15 Convoy
- 12.1.15.1. Company Overview
- 12.1.15.2. Products
- 12.1.15.3. Company Financials
- 12.1.15.4. SWOT Analysis
- 12.1.16 Kontainers
- 12.1.16.1. Company Overview
- 12.1.16.2. Products
- 12.1.16.3. Company Financials
- 12.1.16.4. SWOT Analysis
- 12.1.1 Flexport
- 12.2. Market Entropy
- 12.2.1 Company's Key Areas Served
- 12.2.2 Recent Developments
- 12.3. Company Market Share Analysis 2025
- 12.3.1 Top 5 Companies Market Share Analysis
- 12.3.2 Top 3 Companies Market Share Analysis
- 12.4. List of Potential Customers
- 13. Research Methodology
List of Figures
- Figure 1: Global US Digital Freight Management Industry Revenue Breakdown (Million, %) by Region 2025 & 2033
- Figure 2: North America US Digital Freight Management Industry Revenue (Million), by Mode of Transportation 2025 & 2033
- Figure 3: North America US Digital Freight Management Industry Revenue Share (%), by Mode of Transportation 2025 & 2033
- Figure 4: North America US Digital Freight Management Industry Revenue (Million), by Firm Type 2025 & 2033
- Figure 5: North America US Digital Freight Management Industry Revenue Share (%), by Firm Type 2025 & 2033
- Figure 6: North America US Digital Freight Management Industry Revenue (Million), by Country 2025 & 2033
- Figure 7: North America US Digital Freight Management Industry Revenue Share (%), by Country 2025 & 2033
- Figure 8: South America US Digital Freight Management Industry Revenue (Million), by Mode of Transportation 2025 & 2033
- Figure 9: South America US Digital Freight Management Industry Revenue Share (%), by Mode of Transportation 2025 & 2033
- Figure 10: South America US Digital Freight Management Industry Revenue (Million), by Firm Type 2025 & 2033
- Figure 11: South America US Digital Freight Management Industry Revenue Share (%), by Firm Type 2025 & 2033
- Figure 12: South America US Digital Freight Management Industry Revenue (Million), by Country 2025 & 2033
- Figure 13: South America US Digital Freight Management Industry Revenue Share (%), by Country 2025 & 2033
- Figure 14: Europe US Digital Freight Management Industry Revenue (Million), by Mode of Transportation 2025 & 2033
- Figure 15: Europe US Digital Freight Management Industry Revenue Share (%), by Mode of Transportation 2025 & 2033
- Figure 16: Europe US Digital Freight Management Industry Revenue (Million), by Firm Type 2025 & 2033
- Figure 17: Europe US Digital Freight Management Industry Revenue Share (%), by Firm Type 2025 & 2033
- Figure 18: Europe US Digital Freight Management Industry Revenue (Million), by Country 2025 & 2033
- Figure 19: Europe US Digital Freight Management Industry Revenue Share (%), by Country 2025 & 2033
- Figure 20: Middle East & Africa US Digital Freight Management Industry Revenue (Million), by Mode of Transportation 2025 & 2033
- Figure 21: Middle East & Africa US Digital Freight Management Industry Revenue Share (%), by Mode of Transportation 2025 & 2033
- Figure 22: Middle East & Africa US Digital Freight Management Industry Revenue (Million), by Firm Type 2025 & 2033
- Figure 23: Middle East & Africa US Digital Freight Management Industry Revenue Share (%), by Firm Type 2025 & 2033
- Figure 24: Middle East & Africa US Digital Freight Management Industry Revenue (Million), by Country 2025 & 2033
- Figure 25: Middle East & Africa US Digital Freight Management Industry Revenue Share (%), by Country 2025 & 2033
- Figure 26: Asia Pacific US Digital Freight Management Industry Revenue (Million), by Mode of Transportation 2025 & 2033
- Figure 27: Asia Pacific US Digital Freight Management Industry Revenue Share (%), by Mode of Transportation 2025 & 2033
- Figure 28: Asia Pacific US Digital Freight Management Industry Revenue (Million), by Firm Type 2025 & 2033
- Figure 29: Asia Pacific US Digital Freight Management Industry Revenue Share (%), by Firm Type 2025 & 2033
- Figure 30: Asia Pacific US Digital Freight Management Industry Revenue (Million), by Country 2025 & 2033
- Figure 31: Asia Pacific US Digital Freight Management Industry Revenue Share (%), by Country 2025 & 2033
List of Tables
- Table 1: Global US Digital Freight Management Industry Revenue Million Forecast, by Mode of Transportation 2020 & 2033
- Table 2: Global US Digital Freight Management Industry Revenue Million Forecast, by Firm Type 2020 & 2033
- Table 3: Global US Digital Freight Management Industry Revenue Million Forecast, by Region 2020 & 2033
- Table 4: Global US Digital Freight Management Industry Revenue Million Forecast, by Mode of Transportation 2020 & 2033
- Table 5: Global US Digital Freight Management Industry Revenue Million Forecast, by Firm Type 2020 & 2033
- Table 6: Global US Digital Freight Management Industry Revenue Million Forecast, by Country 2020 & 2033
- Table 7: United States US Digital Freight Management Industry Revenue (Million) Forecast, by Application 2020 & 2033
- Table 8: Canada US Digital Freight Management Industry Revenue (Million) Forecast, by Application 2020 & 2033
- Table 9: Mexico US Digital Freight Management Industry Revenue (Million) Forecast, by Application 2020 & 2033
- Table 10: Global US Digital Freight Management Industry Revenue Million Forecast, by Mode of Transportation 2020 & 2033
- Table 11: Global US Digital Freight Management Industry Revenue Million Forecast, by Firm Type 2020 & 2033
- Table 12: Global US Digital Freight Management Industry Revenue Million Forecast, by Country 2020 & 2033
- Table 13: Brazil US Digital Freight Management Industry Revenue (Million) Forecast, by Application 2020 & 2033
- Table 14: Argentina US Digital Freight Management Industry Revenue (Million) Forecast, by Application 2020 & 2033
- Table 15: Rest of South America US Digital Freight Management Industry Revenue (Million) Forecast, by Application 2020 & 2033
- Table 16: Global US Digital Freight Management Industry Revenue Million Forecast, by Mode of Transportation 2020 & 2033
- Table 17: Global US Digital Freight Management Industry Revenue Million Forecast, by Firm Type 2020 & 2033
- Table 18: Global US Digital Freight Management Industry Revenue Million Forecast, by Country 2020 & 2033
- Table 19: United Kingdom US Digital Freight Management Industry Revenue (Million) Forecast, by Application 2020 & 2033
- Table 20: Germany US Digital Freight Management Industry Revenue (Million) Forecast, by Application 2020 & 2033
- Table 21: France US Digital Freight Management Industry Revenue (Million) Forecast, by Application 2020 & 2033
- Table 22: Italy US Digital Freight Management Industry Revenue (Million) Forecast, by Application 2020 & 2033
- Table 23: Spain US Digital Freight Management Industry Revenue (Million) Forecast, by Application 2020 & 2033
- Table 24: Russia US Digital Freight Management Industry Revenue (Million) Forecast, by Application 2020 & 2033
- Table 25: Benelux US Digital Freight Management Industry Revenue (Million) Forecast, by Application 2020 & 2033
- Table 26: Nordics US Digital Freight Management Industry Revenue (Million) Forecast, by Application 2020 & 2033
- Table 27: Rest of Europe US Digital Freight Management Industry Revenue (Million) Forecast, by Application 2020 & 2033
- Table 28: Global US Digital Freight Management Industry Revenue Million Forecast, by Mode of Transportation 2020 & 2033
- Table 29: Global US Digital Freight Management Industry Revenue Million Forecast, by Firm Type 2020 & 2033
- Table 30: Global US Digital Freight Management Industry Revenue Million Forecast, by Country 2020 & 2033
- Table 31: Turkey US Digital Freight Management Industry Revenue (Million) Forecast, by Application 2020 & 2033
- Table 32: Israel US Digital Freight Management Industry Revenue (Million) Forecast, by Application 2020 & 2033
- Table 33: GCC US Digital Freight Management Industry Revenue (Million) Forecast, by Application 2020 & 2033
- Table 34: North Africa US Digital Freight Management Industry Revenue (Million) Forecast, by Application 2020 & 2033
- Table 35: South Africa US Digital Freight Management Industry Revenue (Million) Forecast, by Application 2020 & 2033
- Table 36: Rest of Middle East & Africa US Digital Freight Management Industry Revenue (Million) Forecast, by Application 2020 & 2033
- Table 37: Global US Digital Freight Management Industry Revenue Million Forecast, by Mode of Transportation 2020 & 2033
- Table 38: Global US Digital Freight Management Industry Revenue Million Forecast, by Firm Type 2020 & 2033
- Table 39: Global US Digital Freight Management Industry Revenue Million Forecast, by Country 2020 & 2033
- Table 40: China US Digital Freight Management Industry Revenue (Million) Forecast, by Application 2020 & 2033
- Table 41: India US Digital Freight Management Industry Revenue (Million) Forecast, by Application 2020 & 2033
- Table 42: Japan US Digital Freight Management Industry Revenue (Million) Forecast, by Application 2020 & 2033
- Table 43: South Korea US Digital Freight Management Industry Revenue (Million) Forecast, by Application 2020 & 2033
- Table 44: ASEAN US Digital Freight Management Industry Revenue (Million) Forecast, by Application 2020 & 2033
- Table 45: Oceania US Digital Freight Management Industry Revenue (Million) Forecast, by Application 2020 & 2033
- Table 46: Rest of Asia Pacific US Digital Freight Management Industry Revenue (Million) Forecast, by Application 2020 & 2033
Frequently Asked Questions
1. What is the projected Compound Annual Growth Rate (CAGR) of the US Digital Freight Management Industry?
The projected CAGR is approximately 21.72%.
2. Which companies are prominent players in the US Digital Freight Management Industry?
Key companies in the market include Flexport, Kuehne + Nagel International (KN Freight Net), Uber Freight, Forto, DHL Group, Agility Logistics Pvt Ltd, Expeditors International, InstaFreight, Turvo, iContainers, Twill, NYSHEX, Transporteca, uShip**List Not Exhaustive, Convoy, Kontainers.
3. What are the main segments of the US Digital Freight Management Industry?
The market segments include Mode of Transportation, Firm Type.
4. Can you provide details about the market size?
The market size is estimated to be USD 6.89 Million as of 2022.
5. What are some drivers contributing to market growth?
4.; PHARMACEUTICAL INDUSTRY GROWTH4.; RISING FRESH PRODUCE IMPORTS FROM MEXICO4.; INCREASING POPULARITY OF FROZEN FOODS.
6. What are the notable trends driving market growth?
E- Commerce is driving the market.
7. Are there any restraints impacting market growth?
4.; EMISSIONS FROM COLD CHAIN OPERATIONS4.; LABOUR SHORTAGES.
8. Can you provide examples of recent developments in the market?
October 2022: Transplace and Uber Freight just completed their merger. It will bring all lower-tier carriers together under the banner of "the world's largest network demand platform meeting the world's largest supply platform," enabling them to benefit from the technological advancement necessary to participate in the global network platform.
9. What pricing options are available for accessing the report?
Pricing options include single-user, multi-user, and enterprise licenses priced at USD 3800, USD 4500, and USD 5800 respectively.
10. Is the market size provided in terms of value or volume?
The market size is provided in terms of value, measured in Million.
11. Are there any specific market keywords associated with the report?
Yes, the market keyword associated with the report is "US Digital Freight Management Industry," which aids in identifying and referencing the specific market segment covered.
12. How do I determine which pricing option suits my needs best?
The pricing options vary based on user requirements and access needs. Individual users may opt for single-user licenses, while businesses requiring broader access may choose multi-user or enterprise licenses for cost-effective access to the report.
13. Are there any additional resources or data provided in the US Digital Freight Management Industry report?
While the report offers comprehensive insights, it's advisable to review the specific contents or supplementary materials provided to ascertain if additional resources or data are available.
14. How can I stay updated on further developments or reports in the US Digital Freight Management Industry?
To stay informed about further developments, trends, and reports in the US Digital Freight Management Industry, consider subscribing to industry newsletters, following relevant companies and organizations, or regularly checking reputable industry news sources and publications.
Methodology
Step 1 - Identification of Relevant Samples Size from Population Database


Step 2 - Approaches for Defining Global Market Size (Value, Volume* & Price*)

Note*: In applicable scenarios
Step 3 - Data Sources
Primary Research
- Web Analytics
- Survey Reports
- Research Institute
- Latest Research Reports
- Opinion Leaders
Secondary Research
- Annual Reports
- White Paper
- Latest Press Release
- Industry Association
- Paid Database
- Investor Presentations

Step 4 - Data Triangulation
Involves using different sources of information in order to increase the validity of a study
These sources are likely to be stakeholders in a program - participants, other researchers, program staff, other community members, and so on.
Then we put all data in single framework & apply various statistical tools to find out the dynamic on the market.
During the analysis stage, feedback from the stakeholder groups would be compared to determine areas of agreement as well as areas of divergence