

Key Insights
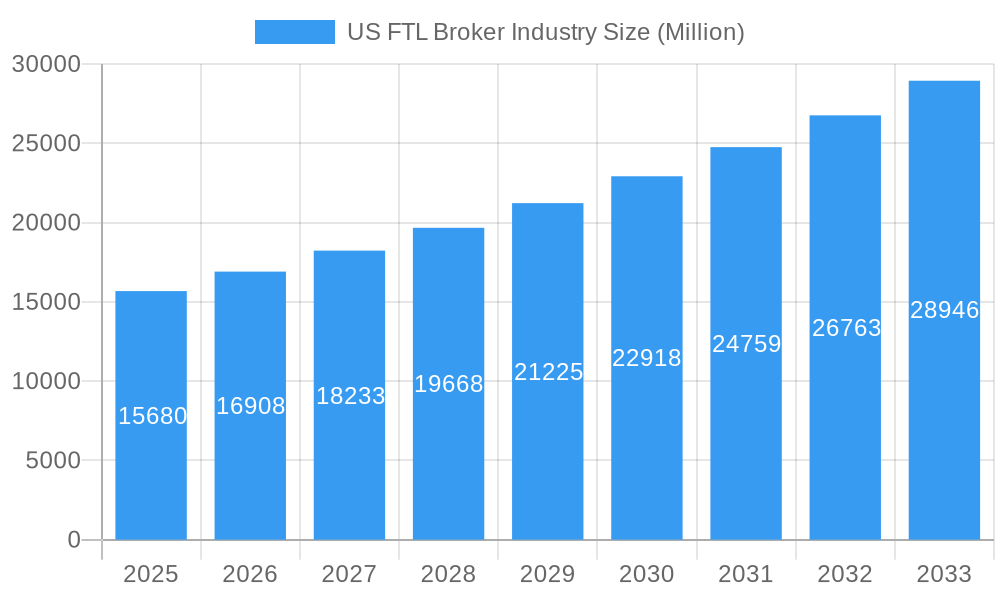
The US full truckload (FTL) brokerage industry, valued at $15.68 billion in 2025, is experiencing robust growth, projected to expand at a compound annual growth rate (CAGR) of 7.86% from 2025 to 2033. This growth is fueled by several key factors. The rise of e-commerce and the increasing demand for efficient and reliable transportation solutions are driving significant demand for FTL brokerage services. Furthermore, technological advancements, such as improved transportation management systems (TMS) and digital freight matching platforms, are enhancing operational efficiency and transparency within the industry. The manufacturing and automotive sector, along with oil and gas, and construction remain significant end-user segments, consistently contributing to the market's expansion. However, the industry faces challenges including fluctuating fuel prices, driver shortages, and increased regulatory compliance costs which can impact profitability and growth trajectory. Despite these headwinds, the industry's strategic adoption of technology and its essential role in the supply chain suggests continued, albeit potentially moderated, growth in the coming years.
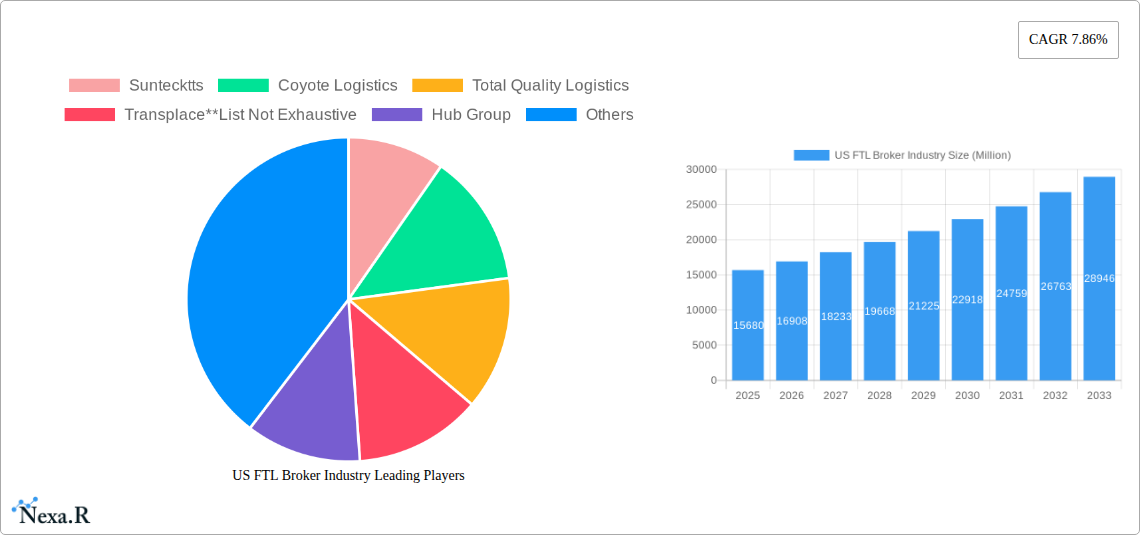
US FTL Broker Industry Market Size (In Billion)
The competitive landscape is characterized by a mix of large, established players like CH Robinson, J.B. Hunt Transport, and XPO Logistics, and smaller, specialized brokers. These companies are constantly vying for market share through strategic acquisitions, technological innovation, and expansion into new geographic markets and service offerings. Regional variations exist, with the Northeast, Southeast, Midwest, Southwest, and West regions of the United States all contributing to the overall market size. Future growth will likely be shaped by the ongoing evolution of supply chain dynamics, technological advancements, and the ability of brokers to adapt to evolving regulatory requirements and macroeconomic conditions. The industry is anticipated to see continued consolidation as larger firms acquire smaller players to enhance their market position and service offerings.
US FTL Broker Industry Company Market Share
US FTL Broker Industry Market Report: 2019-2033
This comprehensive report provides a deep dive into the dynamics, growth trends, and future outlook of the US Full Truckload (FTL) Broker industry. Analyzing the market from 2019 to 2033, with a focus on 2025, this report is an essential resource for industry professionals, investors, and strategic planners. The report covers key segments like Manufacturing & Automotive, Oil & Gas, and more, profiling major players such as Coyote Logistics, CH Robinson, and others. Download now to gain a competitive edge.
US FTL Broker Industry Market Dynamics & Structure
The US FTL Broker market, valued at $xx Million in 2024, is characterized by moderate concentration, with several large players holding significant market share. Technological innovation, primarily in logistics software and data analytics, is a key driver. Stringent regulatory frameworks, including those related to safety and environmental compliance, shape industry practices. Competitive substitutes, such as private fleets and less-than-truckload (LTL) shipping, exert pressure. The market’s end-user demographics are diverse, spanning various sectors. M&A activity has been robust, with several large acquisitions recorded in recent years.
- Market Concentration: Moderately concentrated, with top 5 players holding approximately xx% market share (2024).
- Technological Innovation: Focus on digital freight matching platforms, route optimization software, and predictive analytics.
- Regulatory Framework: Compliance with FMCSA regulations and environmental standards.
- Competitive Substitutes: LTL shipping, private fleets, and intermodal transportation.
- End-User Demographics: Manufacturing & Automotive, Oil & Gas, Mining & Quarrying, Agriculture, Construction, Distributive Trade, and Other.
- M&A Activity: Significant M&A activity in the recent years, with xx major deals recorded between 2019 and 2024.
US FTL Broker Industry Growth Trends & Insights
The US FTL Broker market experienced a CAGR of xx% during 2019-2024, reaching $xx Million in 2024. Growth is driven by increasing e-commerce activity, fluctuating fuel prices, and the need for efficient supply chain management. Technological disruptions, such as the adoption of advanced analytics and automation, are reshaping industry operations. Consumer behavior shifts towards faster delivery times and increased transparency are influencing broker services. The market is projected to continue its growth trajectory, reaching $xx Million by 2033, with a forecasted CAGR of xx% during 2025-2033. Market penetration remains high, with a significant portion of FTL shipments utilizing broker services.
Dominant Regions, Countries, or Segments in US FTL Broker Industry
The Manufacturing and Automotive sector stands as the dominant end-user segment, contributing a substantial percentage of the total market revenue. Its continued expansion is propelled by the resilience of the US manufacturing output and the critical need for agile, just-in-time inventory management strategies. Beyond these, the Oil & Gas and Distributive Trade sectors represent other significant contributors, leveraging FTL brokerage for efficient supply chain operations. Regionally, dominance is concentrated within key manufacturing powerhouses and established logistics corridors across the United States, reflecting a strategic concentration of demand and operational infrastructure.
- Manufacturing & Automotive: Characterized by a consistently high demand for reliable and expedited Full Truckload (FTL) transportation solutions, essential for maintaining production schedules and minimizing costly downtime.
- Oil & Gas: This sector necessitates the secure and timely movement of substantial volumes of goods and materials across extensive geographical distances, often under demanding conditions.
- Distributive Trade: A strong reliance on punctual deliveries to an array of retail locations and pivotal distribution centers underscores the importance of efficient FTL brokerage for maintaining inventory levels and meeting consumer demand.
- Geographic Distribution: The industry's operational footprint is notably concentrated within major industrial heartlands and strategic logistical hubs that span the nation, facilitating optimized transit times and reduced transportation costs.
US FTL Broker Industry Product Landscape
The product landscape consists primarily of digital freight matching platforms, transportation management systems (TMS), and specialized brokerage services catering to niche industries. These platforms integrate advanced technologies such as AI-powered route optimization and real-time tracking, enhancing efficiency and transparency. Key selling propositions include cost optimization, streamlined logistics, and enhanced supply chain visibility. Technological advancements include blockchain integration for enhanced security and improved data management capabilities.
Key Drivers, Barriers & Challenges in US FTL Broker Industry
Key Drivers: Growing e-commerce, increased demand for efficient supply chain management, technological advancements in logistics software, and government initiatives promoting infrastructure development.
Key Challenges: Fluctuating fuel prices, driver shortages, stringent regulatory compliance requirements, and intense competition among brokers. The driver shortage alone accounts for approximately xx% of increased operational costs for the average broker.
Emerging Opportunities in US FTL Broker Industry
The US FTL Broker industry is ripe with emerging opportunities. These include the strategic expansion into currently underserved geographic markets, the development and offering of highly specialized niche FTL services tailored to specific industry needs, and the seamless integration of cutting-edge technologies such as blockchain and the Internet of Things (IoT) to dramatically enhance transparency, traceability, and overall security within the supply chain. Furthermore, a significant growth avenue lies in catering to the escalating demand for sustainable and eco-friendly transportation solutions, aligning with corporate environmental mandates and consumer preferences.
Growth Accelerators in the US FTL Broker Industry
The long-term trajectory of the US FTL Broker industry is set to be significantly propelled by ongoing technological advancements, particularly in the realms of automation, artificial intelligence (AI), and sophisticated data analytics, which promise to optimize operations and enhance efficiency. Strategic and collaborative partnerships between FTL brokers and innovative technology providers will be crucial for unlocking new capabilities and competitive advantages. Moreover, deliberate expansion into new geographic markets and diverse industry sectors will broaden market reach and revenue streams. Crucially, a proactive and dedicated focus on sustainability and the adoption of environmentally responsible transportation options is becoming a key differentiator, attracting a growing segment of environmentally conscious clients and further bolstering market expansion.
Key Players Shaping the US FTL Broker Industry Market
- Suntecktts
- Coyote Logistics (Coyote Logistics)
- Total Quality Logistics (Total Quality Logistics)
- Transplace (Transplace)
- Hub Group
- Landstar System Inc (Landstar System Inc)
- CH Robinson (CH Robinson)
- BNSF Logistics LLC
- XPO Logistics Inc (XPO Logistics Inc)
- Worldwide Express
- Schneider (Schneider)
- Echo Global Logistics (Echo Global Logistics)
- J B Hunt Transport Inc (J B Hunt Transport Inc)
- Kag Logistics Inc
- Globaltranz
Notable Milestones in US FTL Broker Industry Sector
- September 2023: Rhenus acquires ITS Logistics Hungary KFT, expanding its air freight capabilities in Hungary.
- September 2023: Rhenus acquires BLU Logistics, strengthening its LATAM presence and Asia-LATAM trade lane.
In-Depth US FTL Broker Industry Market Outlook
The outlook for the US FTL Broker industry remains robust and optimistic, characterized by sustained growth fueled by a confluence of factors. Continuous technological innovation, the formation of strategic and synergistic partnerships, and aggressive expansion into untapped markets are key drivers. The successful adoption of advanced digital tools and a steadfast commitment to sustainability initiatives will be paramount for achieving and maintaining market leadership. The competitive landscape is expected to be further shaped by strategic mergers, acquisitions, and organic growth strategies, presenting significant opportunities for both established industry giants and agile new entrants. The market is projected to exhibit consistent and substantial expansion through 2033, underpinned by a resilient US economy and the ongoing critical reliance on efficient and dependable logistics networks for commerce.
US FTL Broker Industry Segmentation
-
1. End User
- 1.1. Manufacturing and Automotive
- 1.2. Oil and Gas, Mining, and Quarrying
- 1.3. Agriculture Fishing, and Forestry
- 1.4. Construction
- 1.5. Distributive Trade
- 1.6. Other End Users
US FTL Broker Industry Segmentation By Geography
-
1. North America
- 1.1. United States
- 1.2. Canada
- 1.3. Mexico
-
2. South America
- 2.1. Brazil
- 2.2. Argentina
- 2.3. Rest of South America
-
3. Europe
- 3.1. United Kingdom
- 3.2. Germany
- 3.3. France
- 3.4. Italy
- 3.5. Spain
- 3.6. Russia
- 3.7. Benelux
- 3.8. Nordics
- 3.9. Rest of Europe
-
4. Middle East & Africa
- 4.1. Turkey
- 4.2. Israel
- 4.3. GCC
- 4.4. North Africa
- 4.5. South Africa
- 4.6. Rest of Middle East & Africa
-
5. Asia Pacific
- 5.1. China
- 5.2. India
- 5.3. Japan
- 5.4. South Korea
- 5.5. ASEAN
- 5.6. Oceania
- 5.7. Rest of Asia Pacific
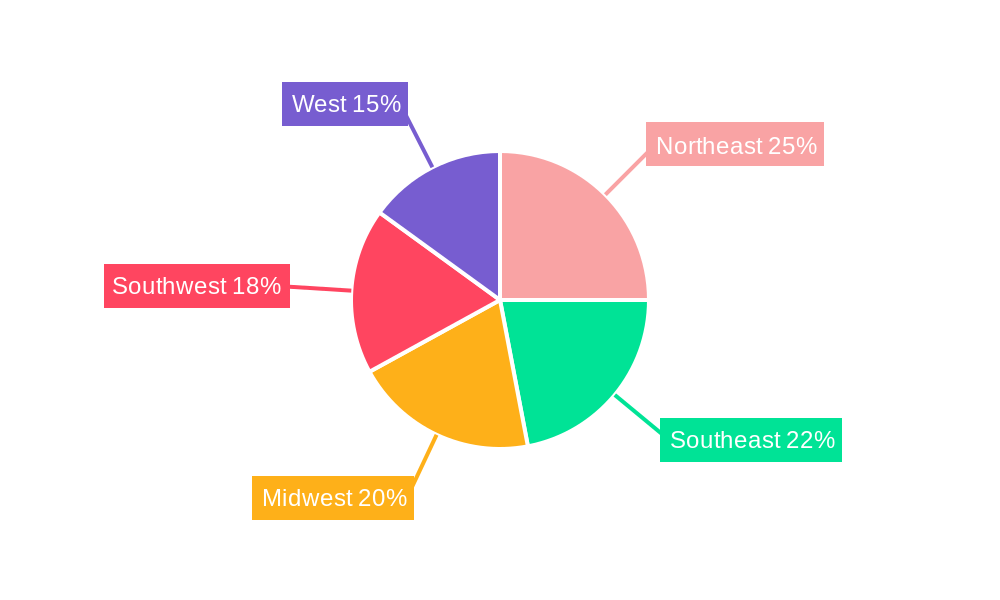
US FTL Broker Industry Regional Market Share
Geographic Coverage of US FTL Broker Industry
US FTL Broker Industry REPORT HIGHLIGHTS
| Aspects | Details |
|---|---|
| Study Period | 2020-2034 |
| Base Year | 2025 |
| Estimated Year | 2026 |
| Forecast Period | 2026-2034 |
| Historical Period | 2020-2025 |
| Growth Rate | CAGR of 7.86% from 2020-2034 |
| Segmentation |
|
Table of Contents
- 1. Introduction
- 1.1. Research Scope
- 1.2. Market Segmentation
- 1.3. Research Objective
- 1.4. Definitions and Assumptions
- 2. Executive Summary
- 2.1. Market Snapshot
- 3. Market Dynamics
- 3.1. Market Drivers
- 3.2. Market Restrains
- 3.3. Market Trends
- 3.4. Market Opportunities
- 4. Market Factor Analysis
- 4.1. Porters Five Forces
- 4.1.1. Bargaining Power of Suppliers
- 4.1.2. Bargaining Power of Buyers
- 4.1.3. Threat of New Entrants
- 4.1.4. Threat of Substitutes
- 4.1.5. Competitive Rivalry
- 4.2. PESTEL analysis
- 4.3. BCG Analysis
- 4.3.1. Stars (High Growth, High Market Share)
- 4.3.2. Cash Cows (Low Growth, High Market Share)
- 4.3.3. Question Mark (High Growth, Low Market Share)
- 4.3.4. Dogs (Low Growth, Low Market Share)
- 4.4. Ansoff Matrix Analysis
- 4.5. Supply Chain Analysis
- 4.6. Regulatory Landscape
- 4.7. Current Market Potential and Opportunity Assessment (TAM–SAM–SOM Framework)
- 4.8. NRP Analyst Note
- 4.1. Porters Five Forces
- 5. Market Analysis, Insights and Forecast 2021-2033
- 5.1. Market Analysis, Insights and Forecast - by End User
- 5.1.1. Manufacturing and Automotive
- 5.1.2. Oil and Gas, Mining, and Quarrying
- 5.1.3. Agriculture Fishing, and Forestry
- 5.1.4. Construction
- 5.1.5. Distributive Trade
- 5.1.6. Other End Users
- 5.2. Market Analysis, Insights and Forecast - by Region
- 5.2.1. North America
- 5.2.2. South America
- 5.2.3. Europe
- 5.2.4. Middle East & Africa
- 5.2.5. Asia Pacific
- 5.1. Market Analysis, Insights and Forecast - by End User
- 6. Global US FTL Broker Industry Analysis, Insights and Forecast, 2021-2033
- 6.1. Market Analysis, Insights and Forecast - by End User
- 6.1.1. Manufacturing and Automotive
- 6.1.2. Oil and Gas, Mining, and Quarrying
- 6.1.3. Agriculture Fishing, and Forestry
- 6.1.4. Construction
- 6.1.5. Distributive Trade
- 6.1.6. Other End Users
- 6.1. Market Analysis, Insights and Forecast - by End User
- 7. North America US FTL Broker Industry Analysis, Insights and Forecast, 2020-2032
- 7.1. Market Analysis, Insights and Forecast - by End User
- 7.1.1. Manufacturing and Automotive
- 7.1.2. Oil and Gas, Mining, and Quarrying
- 7.1.3. Agriculture Fishing, and Forestry
- 7.1.4. Construction
- 7.1.5. Distributive Trade
- 7.1.6. Other End Users
- 7.1. Market Analysis, Insights and Forecast - by End User
- 8. South America US FTL Broker Industry Analysis, Insights and Forecast, 2020-2032
- 8.1. Market Analysis, Insights and Forecast - by End User
- 8.1.1. Manufacturing and Automotive
- 8.1.2. Oil and Gas, Mining, and Quarrying
- 8.1.3. Agriculture Fishing, and Forestry
- 8.1.4. Construction
- 8.1.5. Distributive Trade
- 8.1.6. Other End Users
- 8.1. Market Analysis, Insights and Forecast - by End User
- 9. Europe US FTL Broker Industry Analysis, Insights and Forecast, 2020-2032
- 9.1. Market Analysis, Insights and Forecast - by End User
- 9.1.1. Manufacturing and Automotive
- 9.1.2. Oil and Gas, Mining, and Quarrying
- 9.1.3. Agriculture Fishing, and Forestry
- 9.1.4. Construction
- 9.1.5. Distributive Trade
- 9.1.6. Other End Users
- 9.1. Market Analysis, Insights and Forecast - by End User
- 10. Middle East & Africa US FTL Broker Industry Analysis, Insights and Forecast, 2020-2032
- 10.1. Market Analysis, Insights and Forecast - by End User
- 10.1.1. Manufacturing and Automotive
- 10.1.2. Oil and Gas, Mining, and Quarrying
- 10.1.3. Agriculture Fishing, and Forestry
- 10.1.4. Construction
- 10.1.5. Distributive Trade
- 10.1.6. Other End Users
- 10.1. Market Analysis, Insights and Forecast - by End User
- 11. Asia Pacific US FTL Broker Industry Analysis, Insights and Forecast, 2020-2032
- 11.1. Market Analysis, Insights and Forecast - by End User
- 11.1.1. Manufacturing and Automotive
- 11.1.2. Oil and Gas, Mining, and Quarrying
- 11.1.3. Agriculture Fishing, and Forestry
- 11.1.4. Construction
- 11.1.5. Distributive Trade
- 11.1.6. Other End Users
- 11.1. Market Analysis, Insights and Forecast - by End User
- 12. Competitive Analysis
- 12.1. Company Profiles
- 12.1.1 Suntecktts
- 12.1.1.1. Company Overview
- 12.1.1.2. Products
- 12.1.1.3. Company Financials
- 12.1.1.4. SWOT Analysis
- 12.1.2 Coyote Logistics
- 12.1.2.1. Company Overview
- 12.1.2.2. Products
- 12.1.2.3. Company Financials
- 12.1.2.4. SWOT Analysis
- 12.1.3 Total Quality Logistics
- 12.1.3.1. Company Overview
- 12.1.3.2. Products
- 12.1.3.3. Company Financials
- 12.1.3.4. SWOT Analysis
- 12.1.4 Transplace**List Not Exhaustive
- 12.1.4.1. Company Overview
- 12.1.4.2. Products
- 12.1.4.3. Company Financials
- 12.1.4.4. SWOT Analysis
- 12.1.5 Hub Group
- 12.1.5.1. Company Overview
- 12.1.5.2. Products
- 12.1.5.3. Company Financials
- 12.1.5.4. SWOT Analysis
- 12.1.6 Landstar System Inc
- 12.1.6.1. Company Overview
- 12.1.6.2. Products
- 12.1.6.3. Company Financials
- 12.1.6.4. SWOT Analysis
- 12.1.7 CH Robinson
- 12.1.7.1. Company Overview
- 12.1.7.2. Products
- 12.1.7.3. Company Financials
- 12.1.7.4. SWOT Analysis
- 12.1.8 BNSF Logistics LLC
- 12.1.8.1. Company Overview
- 12.1.8.2. Products
- 12.1.8.3. Company Financials
- 12.1.8.4. SWOT Analysis
- 12.1.9 XPO Logistics Inc
- 12.1.9.1. Company Overview
- 12.1.9.2. Products
- 12.1.9.3. Company Financials
- 12.1.9.4. SWOT Analysis
- 12.1.10 Worldwide Express
- 12.1.10.1. Company Overview
- 12.1.10.2. Products
- 12.1.10.3. Company Financials
- 12.1.10.4. SWOT Analysis
- 12.1.11 Schneider
- 12.1.11.1. Company Overview
- 12.1.11.2. Products
- 12.1.11.3. Company Financials
- 12.1.11.4. SWOT Analysis
- 12.1.12 Echo Global Logistics
- 12.1.12.1. Company Overview
- 12.1.12.2. Products
- 12.1.12.3. Company Financials
- 12.1.12.4. SWOT Analysis
- 12.1.13 J B Hunt Transport Inc
- 12.1.13.1. Company Overview
- 12.1.13.2. Products
- 12.1.13.3. Company Financials
- 12.1.13.4. SWOT Analysis
- 12.1.14 Kag Logistics Inc
- 12.1.14.1. Company Overview
- 12.1.14.2. Products
- 12.1.14.3. Company Financials
- 12.1.14.4. SWOT Analysis
- 12.1.15 Globaltranz
- 12.1.15.1. Company Overview
- 12.1.15.2. Products
- 12.1.15.3. Company Financials
- 12.1.15.4. SWOT Analysis
- 12.1.1 Suntecktts
- 12.2. Market Entropy
- 12.2.1 Company's Key Areas Served
- 12.2.2 Recent Developments
- 12.3. Company Market Share Analysis 2025
- 12.3.1 Top 5 Companies Market Share Analysis
- 12.3.2 Top 3 Companies Market Share Analysis
- 12.4. List of Potential Customers
- 13. Research Methodology
List of Figures
- Figure 1: Global US FTL Broker Industry Revenue Breakdown (Million, %) by Region 2025 & 2033
- Figure 2: North America US FTL Broker Industry Revenue (Million), by End User 2025 & 2033
- Figure 3: North America US FTL Broker Industry Revenue Share (%), by End User 2025 & 2033
- Figure 4: North America US FTL Broker Industry Revenue (Million), by Country 2025 & 2033
- Figure 5: North America US FTL Broker Industry Revenue Share (%), by Country 2025 & 2033
- Figure 6: South America US FTL Broker Industry Revenue (Million), by End User 2025 & 2033
- Figure 7: South America US FTL Broker Industry Revenue Share (%), by End User 2025 & 2033
- Figure 8: South America US FTL Broker Industry Revenue (Million), by Country 2025 & 2033
- Figure 9: South America US FTL Broker Industry Revenue Share (%), by Country 2025 & 2033
- Figure 10: Europe US FTL Broker Industry Revenue (Million), by End User 2025 & 2033
- Figure 11: Europe US FTL Broker Industry Revenue Share (%), by End User 2025 & 2033
- Figure 12: Europe US FTL Broker Industry Revenue (Million), by Country 2025 & 2033
- Figure 13: Europe US FTL Broker Industry Revenue Share (%), by Country 2025 & 2033
- Figure 14: Middle East & Africa US FTL Broker Industry Revenue (Million), by End User 2025 & 2033
- Figure 15: Middle East & Africa US FTL Broker Industry Revenue Share (%), by End User 2025 & 2033
- Figure 16: Middle East & Africa US FTL Broker Industry Revenue (Million), by Country 2025 & 2033
- Figure 17: Middle East & Africa US FTL Broker Industry Revenue Share (%), by Country 2025 & 2033
- Figure 18: Asia Pacific US FTL Broker Industry Revenue (Million), by End User 2025 & 2033
- Figure 19: Asia Pacific US FTL Broker Industry Revenue Share (%), by End User 2025 & 2033
- Figure 20: Asia Pacific US FTL Broker Industry Revenue (Million), by Country 2025 & 2033
- Figure 21: Asia Pacific US FTL Broker Industry Revenue Share (%), by Country 2025 & 2033
List of Tables
- Table 1: Global US FTL Broker Industry Revenue Million Forecast, by End User 2020 & 2033
- Table 2: Global US FTL Broker Industry Revenue Million Forecast, by Region 2020 & 2033
- Table 3: Global US FTL Broker Industry Revenue Million Forecast, by End User 2020 & 2033
- Table 4: Global US FTL Broker Industry Revenue Million Forecast, by Country 2020 & 2033
- Table 5: United States US FTL Broker Industry Revenue (Million) Forecast, by Application 2020 & 2033
- Table 6: Canada US FTL Broker Industry Revenue (Million) Forecast, by Application 2020 & 2033
- Table 7: Mexico US FTL Broker Industry Revenue (Million) Forecast, by Application 2020 & 2033
- Table 8: Global US FTL Broker Industry Revenue Million Forecast, by End User 2020 & 2033
- Table 9: Global US FTL Broker Industry Revenue Million Forecast, by Country 2020 & 2033
- Table 10: Brazil US FTL Broker Industry Revenue (Million) Forecast, by Application 2020 & 2033
- Table 11: Argentina US FTL Broker Industry Revenue (Million) Forecast, by Application 2020 & 2033
- Table 12: Rest of South America US FTL Broker Industry Revenue (Million) Forecast, by Application 2020 & 2033
- Table 13: Global US FTL Broker Industry Revenue Million Forecast, by End User 2020 & 2033
- Table 14: Global US FTL Broker Industry Revenue Million Forecast, by Country 2020 & 2033
- Table 15: United Kingdom US FTL Broker Industry Revenue (Million) Forecast, by Application 2020 & 2033
- Table 16: Germany US FTL Broker Industry Revenue (Million) Forecast, by Application 2020 & 2033
- Table 17: France US FTL Broker Industry Revenue (Million) Forecast, by Application 2020 & 2033
- Table 18: Italy US FTL Broker Industry Revenue (Million) Forecast, by Application 2020 & 2033
- Table 19: Spain US FTL Broker Industry Revenue (Million) Forecast, by Application 2020 & 2033
- Table 20: Russia US FTL Broker Industry Revenue (Million) Forecast, by Application 2020 & 2033
- Table 21: Benelux US FTL Broker Industry Revenue (Million) Forecast, by Application 2020 & 2033
- Table 22: Nordics US FTL Broker Industry Revenue (Million) Forecast, by Application 2020 & 2033
- Table 23: Rest of Europe US FTL Broker Industry Revenue (Million) Forecast, by Application 2020 & 2033
- Table 24: Global US FTL Broker Industry Revenue Million Forecast, by End User 2020 & 2033
- Table 25: Global US FTL Broker Industry Revenue Million Forecast, by Country 2020 & 2033
- Table 26: Turkey US FTL Broker Industry Revenue (Million) Forecast, by Application 2020 & 2033
- Table 27: Israel US FTL Broker Industry Revenue (Million) Forecast, by Application 2020 & 2033
- Table 28: GCC US FTL Broker Industry Revenue (Million) Forecast, by Application 2020 & 2033
- Table 29: North Africa US FTL Broker Industry Revenue (Million) Forecast, by Application 2020 & 2033
- Table 30: South Africa US FTL Broker Industry Revenue (Million) Forecast, by Application 2020 & 2033
- Table 31: Rest of Middle East & Africa US FTL Broker Industry Revenue (Million) Forecast, by Application 2020 & 2033
- Table 32: Global US FTL Broker Industry Revenue Million Forecast, by End User 2020 & 2033
- Table 33: Global US FTL Broker Industry Revenue Million Forecast, by Country 2020 & 2033
- Table 34: China US FTL Broker Industry Revenue (Million) Forecast, by Application 2020 & 2033
- Table 35: India US FTL Broker Industry Revenue (Million) Forecast, by Application 2020 & 2033
- Table 36: Japan US FTL Broker Industry Revenue (Million) Forecast, by Application 2020 & 2033
- Table 37: South Korea US FTL Broker Industry Revenue (Million) Forecast, by Application 2020 & 2033
- Table 38: ASEAN US FTL Broker Industry Revenue (Million) Forecast, by Application 2020 & 2033
- Table 39: Oceania US FTL Broker Industry Revenue (Million) Forecast, by Application 2020 & 2033
- Table 40: Rest of Asia Pacific US FTL Broker Industry Revenue (Million) Forecast, by Application 2020 & 2033
Frequently Asked Questions
1. What is the projected Compound Annual Growth Rate (CAGR) of the US FTL Broker Industry?
The projected CAGR is approximately 7.86%.
2. Which companies are prominent players in the US FTL Broker Industry?
Key companies in the market include Suntecktts, Coyote Logistics, Total Quality Logistics, Transplace**List Not Exhaustive, Hub Group, Landstar System Inc, CH Robinson, BNSF Logistics LLC, XPO Logistics Inc, Worldwide Express, Schneider, Echo Global Logistics, J B Hunt Transport Inc, Kag Logistics Inc, Globaltranz.
3. What are the main segments of the US FTL Broker Industry?
The market segments include End User.
4. Can you provide details about the market size?
The market size is estimated to be USD 15.68 Million as of 2022.
5. What are some drivers contributing to market growth?
4.; Increasing demand for efficient transportation4.; Growing eCommerce industry.
6. What are the notable trends driving market growth?
Fluctuating Fuel prices Hampering the Growth of the Market.
7. Are there any restraints impacting market growth?
4.; Intense competition affecting the market4.; Fluctuating fuel prices.
8. Can you provide examples of recent developments in the market?
Sept 2023: Rhenus continues its growth trajectory with the strategic acquisition of the Hungarian freight forwarder ITS Logistics Hungary KFT. This move will enable them to better serve their customer's needs, particularly in relation to air freight services, while also expanding their reach in the Hungarian market.
9. What pricing options are available for accessing the report?
Pricing options include single-user, multi-user, and enterprise licenses priced at USD 3800, USD 4500, and USD 5800 respectively.
10. Is the market size provided in terms of value or volume?
The market size is provided in terms of value, measured in Million.
11. Are there any specific market keywords associated with the report?
Yes, the market keyword associated with the report is "US FTL Broker Industry," which aids in identifying and referencing the specific market segment covered.
12. How do I determine which pricing option suits my needs best?
The pricing options vary based on user requirements and access needs. Individual users may opt for single-user licenses, while businesses requiring broader access may choose multi-user or enterprise licenses for cost-effective access to the report.
13. Are there any additional resources or data provided in the US FTL Broker Industry report?
While the report offers comprehensive insights, it's advisable to review the specific contents or supplementary materials provided to ascertain if additional resources or data are available.
14. How can I stay updated on further developments or reports in the US FTL Broker Industry?
To stay informed about further developments, trends, and reports in the US FTL Broker Industry, consider subscribing to industry newsletters, following relevant companies and organizations, or regularly checking reputable industry news sources and publications.
Methodology
Step 1 - Identification of Relevant Samples Size from Population Database


Step 2 - Approaches for Defining Global Market Size (Value, Volume* & Price*)

Note*: In applicable scenarios
Step 3 - Data Sources
Primary Research
- Web Analytics
- Survey Reports
- Research Institute
- Latest Research Reports
- Opinion Leaders
Secondary Research
- Annual Reports
- White Paper
- Latest Press Release
- Industry Association
- Paid Database
- Investor Presentations

Step 4 - Data Triangulation
Involves using different sources of information in order to increase the validity of a study
These sources are likely to be stakeholders in a program - participants, other researchers, program staff, other community members, and so on.
Then we put all data in single framework & apply various statistical tools to find out the dynamic on the market.
During the analysis stage, feedback from the stakeholder groups would be compared to determine areas of agreement as well as areas of divergence