

Key Insights
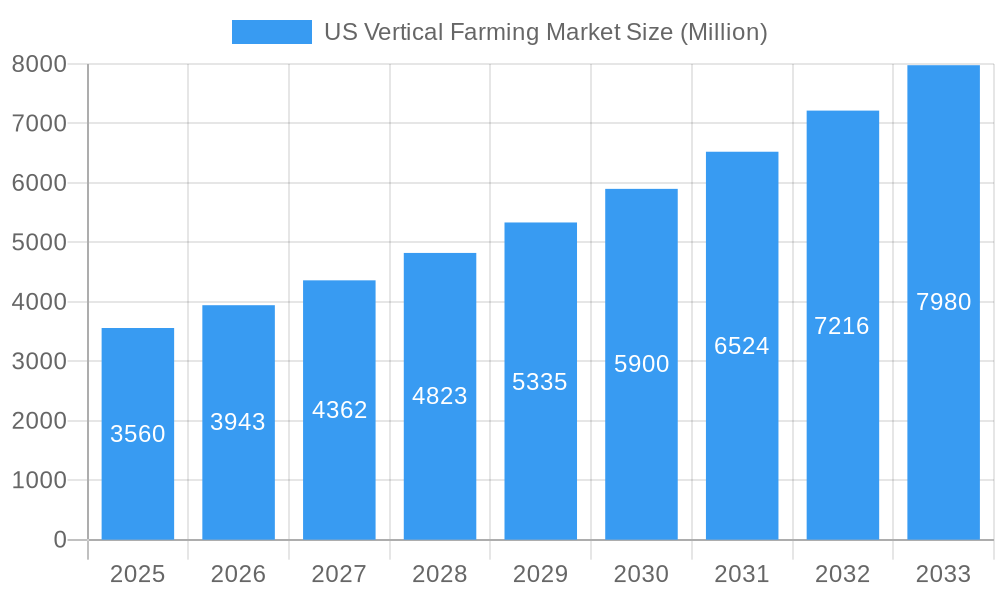
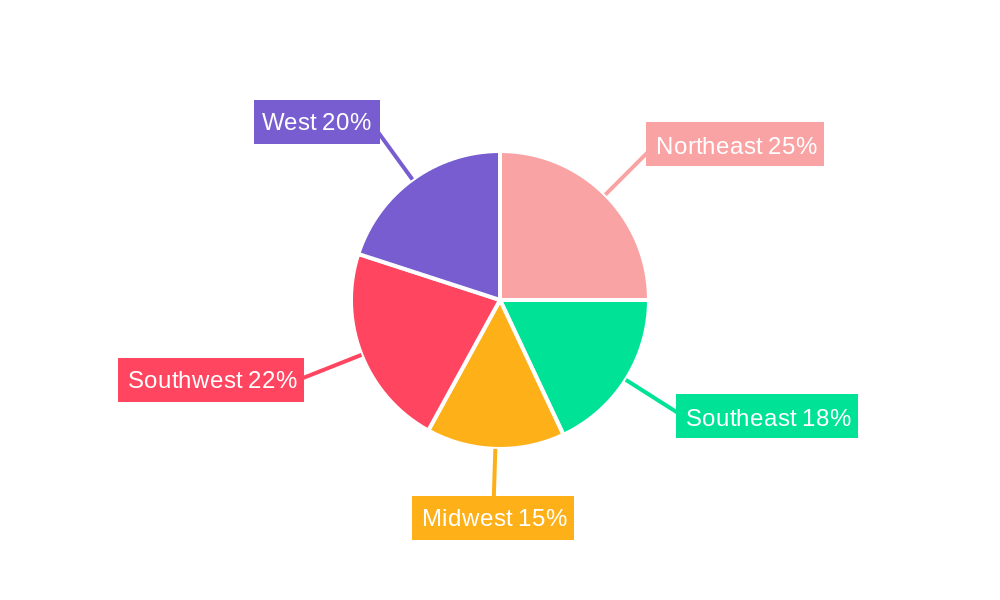
The US vertical farming market is experiencing robust growth, projected to reach $3.56 billion in 2025 and maintain a Compound Annual Growth Rate (CAGR) of 10.80% from 2025 to 2033. This expansion is driven by several key factors. Increasing urbanization and a growing demand for locally sourced, fresh produce are fueling consumer preference for vertical farms' ability to reduce food miles and enhance product quality. Furthermore, technological advancements in hydroponics, aeroponics, and aquaponics are continuously improving efficiency and yields, making vertical farming a more economically viable option. The ability to control environmental factors like temperature, light, and humidity allows for year-round production, independent of weather conditions, leading to increased food security and reduced reliance on traditional agricultural practices. Different vertical farm structures, including building-based and shipping container models, cater to diverse needs and scalability requirements across the various US regions (Northeast, Southeast, Midwest, Southwest, and West). The market is segmented by crop type, including fruits and vegetables, herbs and microgreens, and flowers and ornamentals, each with its own growth trajectory and contributing to the overall market's dynamism. The presence of established players like Bowery Farming Inc, Plenty Unlimited Inc, and Aero Farms indicates a high level of investor confidence and technological maturity within the sector.
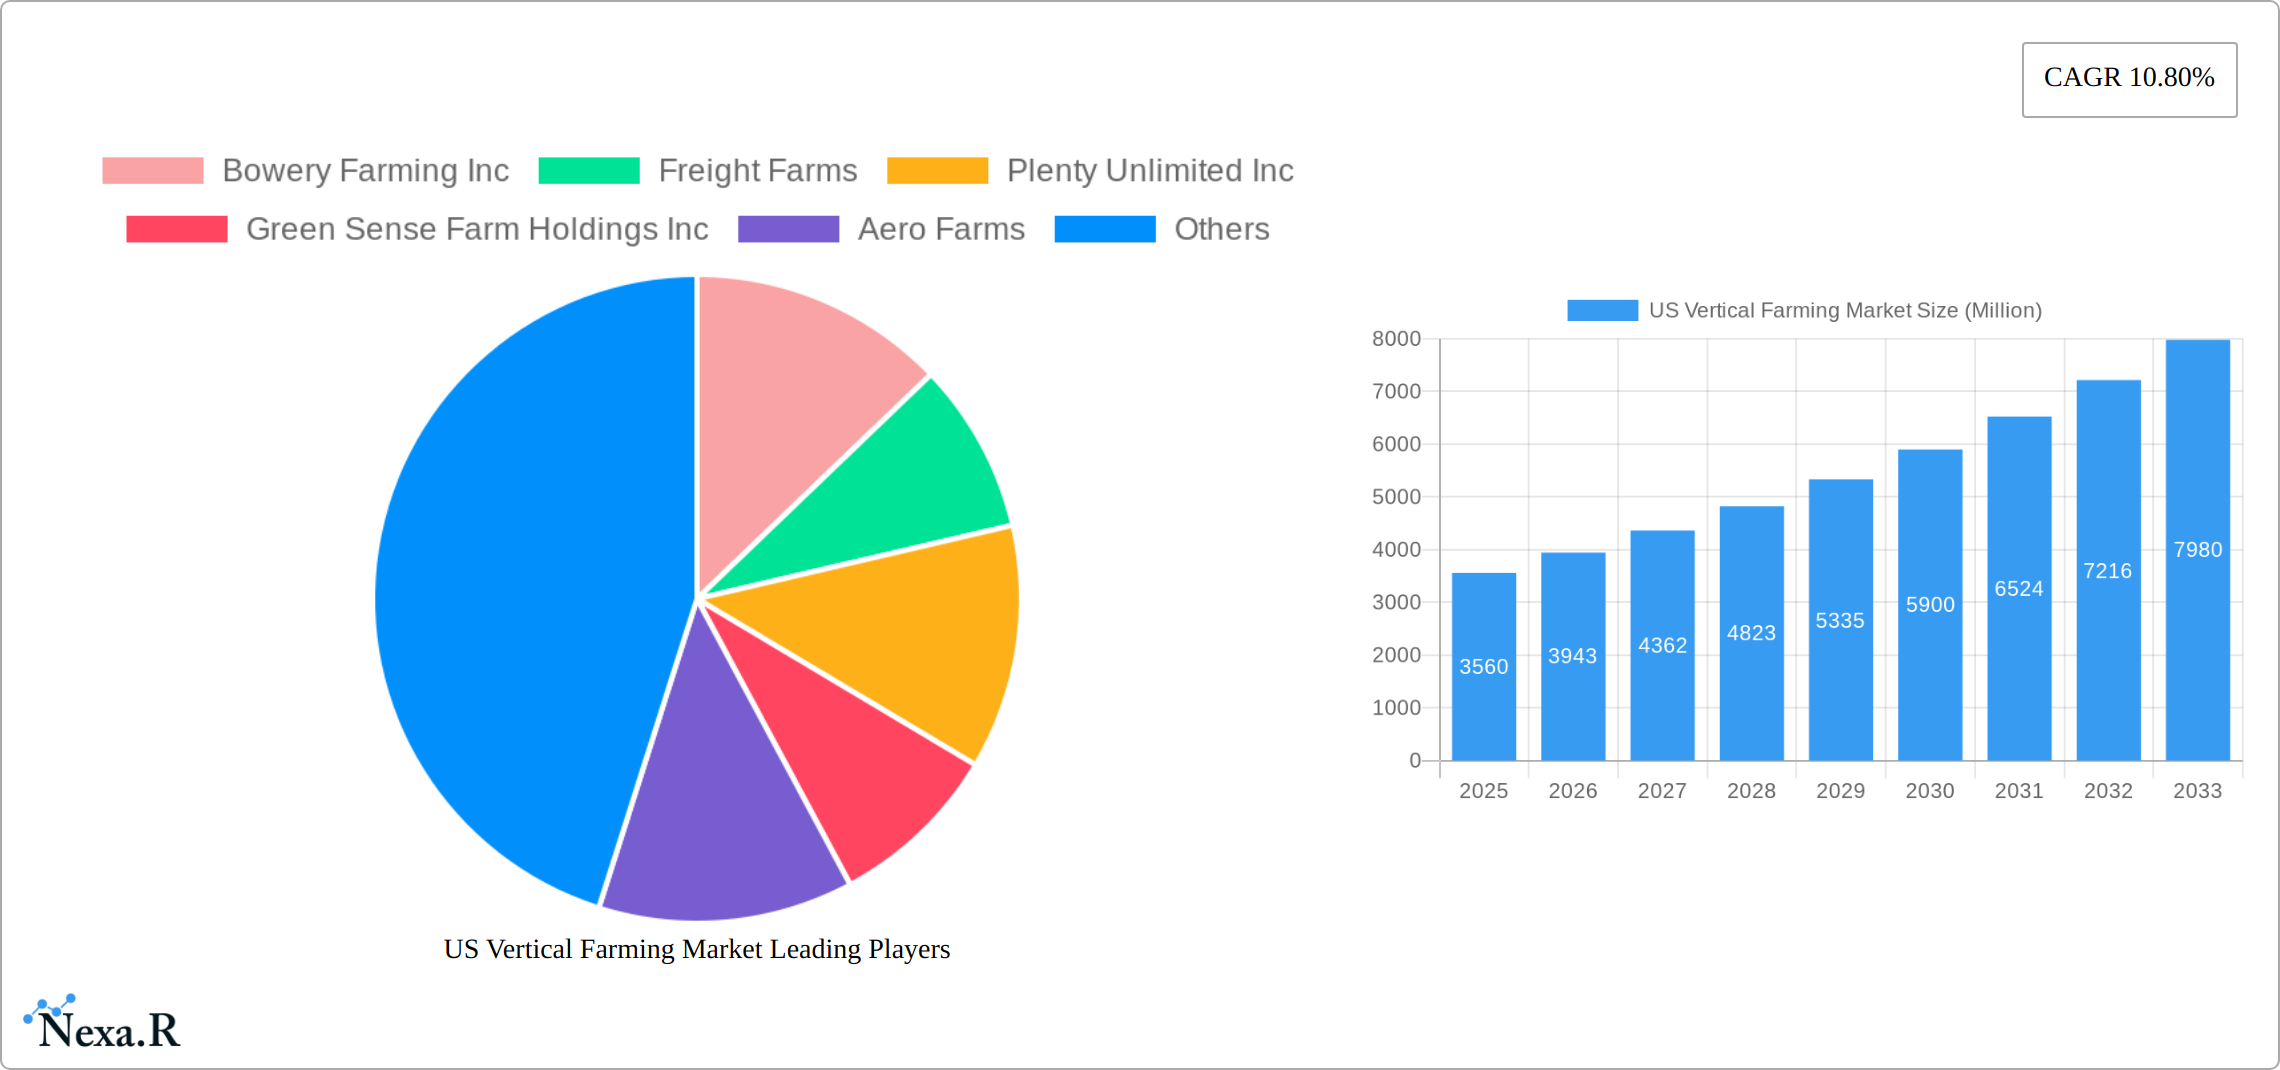
US Vertical Farming Market Market Size (In Billion)
The market segmentation reveals distinct opportunities. Fruits and vegetables currently dominate, but herbs and microgreens are showing particularly strong growth potential due to increasing consumer interest in healthy eating. The choice between building-based and shipping container vertical farms is influenced by factors like initial investment, scalability needs, and location constraints. While building-based vertical farms offer larger-scale operations, shipping container farms provide greater flexibility and mobility, making them attractive for smaller enterprises and urban settings. The geographic distribution of vertical farms across the US is likely to reflect population density and consumer demand, with densely populated areas in the Northeast and West potentially witnessing higher concentration of operations. Continued innovation in automation and data analytics within vertical farming operations will be crucial for enhancing efficiency and competitiveness. The market's future growth hinges on addressing challenges such as high initial capital investment and energy consumption, although ongoing technological advancements are continuously mitigating these concerns.
US Vertical Farming Market Company Market Share
US Vertical Farming Market: A Comprehensive Report (2019-2033)
This comprehensive report provides an in-depth analysis of the US vertical farming market, encompassing market dynamics, growth trends, regional analysis, product landscape, key players, and future outlook. The study period covers 2019-2033, with a base year of 2025 and a forecast period of 2025-2033. This report is essential for industry professionals, investors, and stakeholders seeking to understand and capitalize on the burgeoning opportunities within this dynamic sector. The report analyzes key segments including Aeroponics, Hydroponics, and Aquaponics growth mechanisms, as well as Building-based and Shipping Container vertical farm structures and various crop types.
US Vertical Farming Market Dynamics & Structure
The US vertical farming market is experiencing rapid growth driven by technological advancements, increasing consumer demand for locally sourced produce, and the need for sustainable food production solutions. The market is characterized by a moderately fragmented structure with several key players vying for market share. Market concentration is expected to increase slightly in the coming years as larger companies consolidate their position through mergers and acquisitions (M&A). The report details xx M&A deals from the historical period (2019-2024) and projects xx deals for the forecast period (2025-2033).
- Market Concentration: Moderately fragmented, with a projected increase in consolidation. Key players hold approximately xx% of the market share in 2025.
- Technological Innovation: Significant advancements in areas such as LED lighting, automation, and data analytics are driving efficiency improvements and yield increases. Barriers to entry include high capital costs and specialized technical expertise.
- Regulatory Frameworks: Vary by state and locality, presenting both opportunities and challenges for market expansion. Regulatory clarity and consistent standards are essential for further growth.
- Competitive Product Substitutes: Traditional agricultural practices remain a major competitor, however, vertical farming offers advantages in terms of sustainability, consistency, and year-round production.
- End-User Demographics: Demand is growing across diverse consumer segments, including restaurants, retailers, and food processors. The increasing demand for fresh, locally grown produce is fueling market expansion.
- M&A Trends: Consolidation is expected to continue, with larger companies acquiring smaller firms to expand their market reach and gain access to innovative technologies.
US Vertical Farming Market Growth Trends & Insights
The US vertical farming market is witnessing exponential growth, fueled by rising consumer demand for fresh, healthy produce and the need for sustainable and resilient food systems. The market size experienced a CAGR of xx% during the historical period (2019-2024) and is projected to reach USD xx million in 2025, with a projected CAGR of xx% during the forecast period (2025-2033). Market penetration is currently at xx% and is expected to increase to xx% by 2033. This growth is further accelerated by technological advancements, improving production efficiency, and reduced reliance on land and water resources. Consumer preference for locally sourced and sustainably produced food is a key driver. The adoption rate is increasing steadily as more businesses realize the benefits of this technology. Technological disruptions, such as AI-powered automation and advanced sensor technologies, are also contributing significantly to the growth.
Dominant Regions, Countries, or Segments in US Vertical Farming Market
The US vertical farming market is experiencing robust growth, with California and other West Coast states leading the charge. This regional dominance stems from a confluence of factors: a favorable climate conducive to year-round production, well-established infrastructure facilitating logistics and distribution, and a high concentration of technologically advanced businesses and consumers receptive to innovative food production methods. Currently, building-based vertical farms constitute the largest market segment, followed by shipping container farms, which are gaining traction due to their inherent scalability, mobility, and lower initial capital investment requirements.
- Growth Mechanisms: Hydroponics currently commands the largest market share, leveraging its established efficacy and efficiency. Aeroponics and Aquaponics, however, are experiencing rapid growth, driven by advancements in technology and increasing recognition of their potential for sustainable and high-yield crop production.
- Farm Structures: While building-based vertical farms remain dominant due to their larger scale and production capacity, the market is witnessing a significant rise in shipping container farms. Their adaptability, lower setup costs, and ease of relocation make them an attractive option for both established players and new entrants.
- Crop Types: Leafy greens, fruits, and vegetables comprise the most significant market segment, followed by herbs and microgreens. However, the market is diversifying, with flowers, ornamentals, and other specialty crops exhibiting substantial growth potential, driven by increasing consumer demand for unique and high-value produce.
- Key Market Drivers: The US vertical farming market is propelled by several key factors: a growing consumer preference for locally sourced, fresh produce; supportive government policies, including tax incentives and research funding dedicated to promoting sustainable agriculture; and continuous advancements in technology that are improving efficiency, reducing costs, and enhancing overall production capabilities.
US Vertical Farming Market Product Landscape
Vertical farming technology is rapidly evolving, with innovations focused on enhancing yield, improving efficiency, and reducing production costs. Key product innovations include advanced LED lighting systems, automated harvesting robots, and sophisticated environmental control systems. These advancements lead to higher crop yields, improved product quality, and reduced resource consumption. Unique selling propositions include year-round production, reduced reliance on pesticides and herbicides, and minimized water usage.
Key Drivers, Barriers & Challenges in US Vertical Farming Market
Key Drivers:
- High consumer demand for locally sourced, fresh produce.
- Growing concerns about food security and sustainability.
- Technological advancements reducing production costs and improving yields.
- Government support and incentives promoting vertical farming adoption.
Challenges:
- High initial capital investment costs.
- Complex technical expertise requirements.
- Energy consumption and associated costs.
- Regulatory uncertainties and varying regulations across states. This results in an estimated xx% reduction in market growth annually.
Emerging Opportunities in US Vertical Farming Market
Emerging opportunities include expansion into new crop types (e.g., medicinal plants, specialty mushrooms), development of customized vertical farming systems for specific crops and climates, and integration with smart city initiatives. The focus on providing fresh produce to underserved communities presents a major opportunity for expansion and social impact. The increasing consumer preference for sustainable and ethically produced food further enhances the market potential.
Growth Accelerators in the US Vertical Farming Market Industry
Several key factors are accelerating growth within the US vertical farming industry. Significant advancements in automation technologies, including AI-powered systems for optimizing environmental controls and resource management, are dramatically reducing operational costs and boosting production efficiency. The integration of sophisticated LED lighting solutions further enhances yield and quality while minimizing energy consumption. Furthermore, strategic partnerships between vertical farming companies and major retailers are establishing robust distribution channels, ensuring consistent product availability and reaching a broader consumer base. Expansion into new geographic markets and diversification of crop production will unlock substantial growth potential, catering to evolving consumer preferences and expanding market opportunities.
Key Players Shaping the US Vertical Farming Market Market
- Bowery Farming Inc
- Freight Farms
- Plenty Unlimited Inc
- Green Sense Farm Holdings Inc
- Aero Farms
- Altius Farm
- Green Spirit Farms
Notable Milestones in US Vertical Farming Market Sector
- August 2023: Plenty Unlimited Inc. commences construction on a USD 300 million vertical farming campus, poised to become the world's largest upon completion, signifying a substantial investment in the sector and its future potential.
- February 2022: Aero Farms announces a collaborative tomato research partnership with the Foundation for Food and Agriculture Research (FFAR) and the University of Florida, focusing on developing high-yielding, flavorful tomato varieties optimized for vertical farming environments.
- January 2022: Plenty and Walmart announce a long-term strategic partnership aimed at supplying fresh produce to Walmart consumers year-round, demonstrating the growing integration of vertical farming into mainstream food supply chains.
In-Depth US Vertical Farming Market Market Outlook
The US vertical farming market is poised for continued robust growth, driven by increasing consumer demand, technological innovation, and supportive government policies. The focus on sustainable food production and the potential for year-round crop yields will drive further market expansion. Strategic partnerships and investments will continue to shape the market landscape, paving the way for new technologies and innovative applications. The market is predicted to reach USD xx million by 2033, presenting significant opportunities for investors and industry participants alike.
US Vertical Farming Market Segmentation
- 1. Production Analysis
- 2. Consumption Analysis
- 3. Import Market Analysis (Value & Volume)
- 4. Export Market Analysis (Value & Volume)
- 5. Price Trend Analysis
US Vertical Farming Market Segmentation By Geography
-
1. North America
- 1.1. United States
- 1.2. Canada
- 1.3. Mexico
-
2. South America
- 2.1. Brazil
- 2.2. Argentina
- 2.3. Rest of South America
-
3. Europe
- 3.1. United Kingdom
- 3.2. Germany
- 3.3. France
- 3.4. Italy
- 3.5. Spain
- 3.6. Russia
- 3.7. Benelux
- 3.8. Nordics
- 3.9. Rest of Europe
-
4. Middle East & Africa
- 4.1. Turkey
- 4.2. Israel
- 4.3. GCC
- 4.4. North Africa
- 4.5. South Africa
- 4.6. Rest of Middle East & Africa
-
5. Asia Pacific
- 5.1. China
- 5.2. India
- 5.3. Japan
- 5.4. South Korea
- 5.5. ASEAN
- 5.6. Oceania
- 5.7. Rest of Asia Pacific
US Vertical Farming Market Regional Market Share
Geographic Coverage of US Vertical Farming Market
US Vertical Farming Market REPORT HIGHLIGHTS
| Aspects | Details |
|---|---|
| Study Period | 2020-2034 |
| Base Year | 2025 |
| Estimated Year | 2026 |
| Forecast Period | 2026-2034 |
| Historical Period | 2020-2025 |
| Growth Rate | CAGR of 10.80% from 2020-2034 |
| Segmentation |
|
Table of Contents
- 1. Introduction
- 1.1. Research Scope
- 1.2. Market Segmentation
- 1.3. Research Objective
- 1.4. Definitions and Assumptions
- 2. Executive Summary
- 2.1. Market Snapshot
- 3. Market Dynamics
- 3.1. Market Drivers
- 3.2. Market Restrains
- 3.3. Market Trends
- 3.4. Market Opportunities
- 4. Market Factor Analysis
- 4.1. Porters Five Forces
- 4.1.1. Bargaining Power of Suppliers
- 4.1.2. Bargaining Power of Buyers
- 4.1.3. Threat of New Entrants
- 4.1.4. Threat of Substitutes
- 4.1.5. Competitive Rivalry
- 4.2. PESTEL analysis
- 4.3. BCG Analysis
- 4.3.1. Stars (High Growth, High Market Share)
- 4.3.2. Cash Cows (Low Growth, High Market Share)
- 4.3.3. Question Mark (High Growth, Low Market Share)
- 4.3.4. Dogs (Low Growth, Low Market Share)
- 4.4. Ansoff Matrix Analysis
- 4.5. Supply Chain Analysis
- 4.6. Regulatory Landscape
- 4.7. Current Market Potential and Opportunity Assessment (TAM–SAM–SOM Framework)
- 4.8. NRP Analyst Note
- 4.1. Porters Five Forces
- 5. Market Analysis, Insights and Forecast 2021-2033
- 5.1. Market Analysis, Insights and Forecast - by Production Analysis
- 5.2. Market Analysis, Insights and Forecast - by Consumption Analysis
- 5.3. Market Analysis, Insights and Forecast - by Import Market Analysis (Value & Volume)
- 5.4. Market Analysis, Insights and Forecast - by Export Market Analysis (Value & Volume)
- 5.5. Market Analysis, Insights and Forecast - by Price Trend Analysis
- 5.6. Market Analysis, Insights and Forecast - by Region
- 5.6.1. North America
- 5.6.2. South America
- 5.6.3. Europe
- 5.6.4. Middle East & Africa
- 5.6.5. Asia Pacific
- 6. Global US Vertical Farming Market Analysis, Insights and Forecast, 2021-2033
- 6.1. Market Analysis, Insights and Forecast - by Production Analysis
- 6.2. Market Analysis, Insights and Forecast - by Consumption Analysis
- 6.3. Market Analysis, Insights and Forecast - by Import Market Analysis (Value & Volume)
- 6.4. Market Analysis, Insights and Forecast - by Export Market Analysis (Value & Volume)
- 6.5. Market Analysis, Insights and Forecast - by Price Trend Analysis
- 7. North America US Vertical Farming Market Analysis, Insights and Forecast, 2020-2032
- 7.1. Market Analysis, Insights and Forecast - by Production Analysis
- 7.2. Market Analysis, Insights and Forecast - by Consumption Analysis
- 7.3. Market Analysis, Insights and Forecast - by Import Market Analysis (Value & Volume)
- 7.4. Market Analysis, Insights and Forecast - by Export Market Analysis (Value & Volume)
- 7.5. Market Analysis, Insights and Forecast - by Price Trend Analysis
- 8. South America US Vertical Farming Market Analysis, Insights and Forecast, 2020-2032
- 8.1. Market Analysis, Insights and Forecast - by Production Analysis
- 8.2. Market Analysis, Insights and Forecast - by Consumption Analysis
- 8.3. Market Analysis, Insights and Forecast - by Import Market Analysis (Value & Volume)
- 8.4. Market Analysis, Insights and Forecast - by Export Market Analysis (Value & Volume)
- 8.5. Market Analysis, Insights and Forecast - by Price Trend Analysis
- 9. Europe US Vertical Farming Market Analysis, Insights and Forecast, 2020-2032
- 9.1. Market Analysis, Insights and Forecast - by Production Analysis
- 9.2. Market Analysis, Insights and Forecast - by Consumption Analysis
- 9.3. Market Analysis, Insights and Forecast - by Import Market Analysis (Value & Volume)
- 9.4. Market Analysis, Insights and Forecast - by Export Market Analysis (Value & Volume)
- 9.5. Market Analysis, Insights and Forecast - by Price Trend Analysis
- 10. Middle East & Africa US Vertical Farming Market Analysis, Insights and Forecast, 2020-2032
- 10.1. Market Analysis, Insights and Forecast - by Production Analysis
- 10.2. Market Analysis, Insights and Forecast - by Consumption Analysis
- 10.3. Market Analysis, Insights and Forecast - by Import Market Analysis (Value & Volume)
- 10.4. Market Analysis, Insights and Forecast - by Export Market Analysis (Value & Volume)
- 10.5. Market Analysis, Insights and Forecast - by Price Trend Analysis
- 11. Asia Pacific US Vertical Farming Market Analysis, Insights and Forecast, 2020-2032
- 11.1. Market Analysis, Insights and Forecast - by Production Analysis
- 11.2. Market Analysis, Insights and Forecast - by Consumption Analysis
- 11.3. Market Analysis, Insights and Forecast - by Import Market Analysis (Value & Volume)
- 11.4. Market Analysis, Insights and Forecast - by Export Market Analysis (Value & Volume)
- 11.5. Market Analysis, Insights and Forecast - by Price Trend Analysis
- 12. Competitive Analysis
- 12.1. Company Profiles
- 12.1.1 Bowery Farming Inc
- 12.1.1.1. Company Overview
- 12.1.1.2. Products
- 12.1.1.3. Company Financials
- 12.1.1.4. SWOT Analysis
- 12.1.2 Freight Farms
- 12.1.2.1. Company Overview
- 12.1.2.2. Products
- 12.1.2.3. Company Financials
- 12.1.2.4. SWOT Analysis
- 12.1.3 Plenty Unlimited Inc
- 12.1.3.1. Company Overview
- 12.1.3.2. Products
- 12.1.3.3. Company Financials
- 12.1.3.4. SWOT Analysis
- 12.1.4 Green Sense Farm Holdings Inc
- 12.1.4.1. Company Overview
- 12.1.4.2. Products
- 12.1.4.3. Company Financials
- 12.1.4.4. SWOT Analysis
- 12.1.5 Aero Farms
- 12.1.5.1. Company Overview
- 12.1.5.2. Products
- 12.1.5.3. Company Financials
- 12.1.5.4. SWOT Analysis
- 12.1.6 Altius Farm
- 12.1.6.1. Company Overview
- 12.1.6.2. Products
- 12.1.6.3. Company Financials
- 12.1.6.4. SWOT Analysis
- 12.1.7 Green Spirit Farms
- 12.1.7.1. Company Overview
- 12.1.7.2. Products
- 12.1.7.3. Company Financials
- 12.1.7.4. SWOT Analysis
- 12.1.1 Bowery Farming Inc
- 12.2. Market Entropy
- 12.2.1 Company's Key Areas Served
- 12.2.2 Recent Developments
- 12.3. Company Market Share Analysis 2025
- 12.3.1 Top 5 Companies Market Share Analysis
- 12.3.2 Top 3 Companies Market Share Analysis
- 12.4. List of Potential Customers
- 13. Research Methodology
List of Figures
- Figure 1: Global US Vertical Farming Market Revenue Breakdown (Million, %) by Region 2025 & 2033
- Figure 2: North America US Vertical Farming Market Revenue (Million), by Production Analysis 2025 & 2033
- Figure 3: North America US Vertical Farming Market Revenue Share (%), by Production Analysis 2025 & 2033
- Figure 4: North America US Vertical Farming Market Revenue (Million), by Consumption Analysis 2025 & 2033
- Figure 5: North America US Vertical Farming Market Revenue Share (%), by Consumption Analysis 2025 & 2033
- Figure 6: North America US Vertical Farming Market Revenue (Million), by Import Market Analysis (Value & Volume) 2025 & 2033
- Figure 7: North America US Vertical Farming Market Revenue Share (%), by Import Market Analysis (Value & Volume) 2025 & 2033
- Figure 8: North America US Vertical Farming Market Revenue (Million), by Export Market Analysis (Value & Volume) 2025 & 2033
- Figure 9: North America US Vertical Farming Market Revenue Share (%), by Export Market Analysis (Value & Volume) 2025 & 2033
- Figure 10: North America US Vertical Farming Market Revenue (Million), by Price Trend Analysis 2025 & 2033
- Figure 11: North America US Vertical Farming Market Revenue Share (%), by Price Trend Analysis 2025 & 2033
- Figure 12: North America US Vertical Farming Market Revenue (Million), by Country 2025 & 2033
- Figure 13: North America US Vertical Farming Market Revenue Share (%), by Country 2025 & 2033
- Figure 14: South America US Vertical Farming Market Revenue (Million), by Production Analysis 2025 & 2033
- Figure 15: South America US Vertical Farming Market Revenue Share (%), by Production Analysis 2025 & 2033
- Figure 16: South America US Vertical Farming Market Revenue (Million), by Consumption Analysis 2025 & 2033
- Figure 17: South America US Vertical Farming Market Revenue Share (%), by Consumption Analysis 2025 & 2033
- Figure 18: South America US Vertical Farming Market Revenue (Million), by Import Market Analysis (Value & Volume) 2025 & 2033
- Figure 19: South America US Vertical Farming Market Revenue Share (%), by Import Market Analysis (Value & Volume) 2025 & 2033
- Figure 20: South America US Vertical Farming Market Revenue (Million), by Export Market Analysis (Value & Volume) 2025 & 2033
- Figure 21: South America US Vertical Farming Market Revenue Share (%), by Export Market Analysis (Value & Volume) 2025 & 2033
- Figure 22: South America US Vertical Farming Market Revenue (Million), by Price Trend Analysis 2025 & 2033
- Figure 23: South America US Vertical Farming Market Revenue Share (%), by Price Trend Analysis 2025 & 2033
- Figure 24: South America US Vertical Farming Market Revenue (Million), by Country 2025 & 2033
- Figure 25: South America US Vertical Farming Market Revenue Share (%), by Country 2025 & 2033
- Figure 26: Europe US Vertical Farming Market Revenue (Million), by Production Analysis 2025 & 2033
- Figure 27: Europe US Vertical Farming Market Revenue Share (%), by Production Analysis 2025 & 2033
- Figure 28: Europe US Vertical Farming Market Revenue (Million), by Consumption Analysis 2025 & 2033
- Figure 29: Europe US Vertical Farming Market Revenue Share (%), by Consumption Analysis 2025 & 2033
- Figure 30: Europe US Vertical Farming Market Revenue (Million), by Import Market Analysis (Value & Volume) 2025 & 2033
- Figure 31: Europe US Vertical Farming Market Revenue Share (%), by Import Market Analysis (Value & Volume) 2025 & 2033
- Figure 32: Europe US Vertical Farming Market Revenue (Million), by Export Market Analysis (Value & Volume) 2025 & 2033
- Figure 33: Europe US Vertical Farming Market Revenue Share (%), by Export Market Analysis (Value & Volume) 2025 & 2033
- Figure 34: Europe US Vertical Farming Market Revenue (Million), by Price Trend Analysis 2025 & 2033
- Figure 35: Europe US Vertical Farming Market Revenue Share (%), by Price Trend Analysis 2025 & 2033
- Figure 36: Europe US Vertical Farming Market Revenue (Million), by Country 2025 & 2033
- Figure 37: Europe US Vertical Farming Market Revenue Share (%), by Country 2025 & 2033
- Figure 38: Middle East & Africa US Vertical Farming Market Revenue (Million), by Production Analysis 2025 & 2033
- Figure 39: Middle East & Africa US Vertical Farming Market Revenue Share (%), by Production Analysis 2025 & 2033
- Figure 40: Middle East & Africa US Vertical Farming Market Revenue (Million), by Consumption Analysis 2025 & 2033
- Figure 41: Middle East & Africa US Vertical Farming Market Revenue Share (%), by Consumption Analysis 2025 & 2033
- Figure 42: Middle East & Africa US Vertical Farming Market Revenue (Million), by Import Market Analysis (Value & Volume) 2025 & 2033
- Figure 43: Middle East & Africa US Vertical Farming Market Revenue Share (%), by Import Market Analysis (Value & Volume) 2025 & 2033
- Figure 44: Middle East & Africa US Vertical Farming Market Revenue (Million), by Export Market Analysis (Value & Volume) 2025 & 2033
- Figure 45: Middle East & Africa US Vertical Farming Market Revenue Share (%), by Export Market Analysis (Value & Volume) 2025 & 2033
- Figure 46: Middle East & Africa US Vertical Farming Market Revenue (Million), by Price Trend Analysis 2025 & 2033
- Figure 47: Middle East & Africa US Vertical Farming Market Revenue Share (%), by Price Trend Analysis 2025 & 2033
- Figure 48: Middle East & Africa US Vertical Farming Market Revenue (Million), by Country 2025 & 2033
- Figure 49: Middle East & Africa US Vertical Farming Market Revenue Share (%), by Country 2025 & 2033
- Figure 50: Asia Pacific US Vertical Farming Market Revenue (Million), by Production Analysis 2025 & 2033
- Figure 51: Asia Pacific US Vertical Farming Market Revenue Share (%), by Production Analysis 2025 & 2033
- Figure 52: Asia Pacific US Vertical Farming Market Revenue (Million), by Consumption Analysis 2025 & 2033
- Figure 53: Asia Pacific US Vertical Farming Market Revenue Share (%), by Consumption Analysis 2025 & 2033
- Figure 54: Asia Pacific US Vertical Farming Market Revenue (Million), by Import Market Analysis (Value & Volume) 2025 & 2033
- Figure 55: Asia Pacific US Vertical Farming Market Revenue Share (%), by Import Market Analysis (Value & Volume) 2025 & 2033
- Figure 56: Asia Pacific US Vertical Farming Market Revenue (Million), by Export Market Analysis (Value & Volume) 2025 & 2033
- Figure 57: Asia Pacific US Vertical Farming Market Revenue Share (%), by Export Market Analysis (Value & Volume) 2025 & 2033
- Figure 58: Asia Pacific US Vertical Farming Market Revenue (Million), by Price Trend Analysis 2025 & 2033
- Figure 59: Asia Pacific US Vertical Farming Market Revenue Share (%), by Price Trend Analysis 2025 & 2033
- Figure 60: Asia Pacific US Vertical Farming Market Revenue (Million), by Country 2025 & 2033
- Figure 61: Asia Pacific US Vertical Farming Market Revenue Share (%), by Country 2025 & 2033
List of Tables
- Table 1: Global US Vertical Farming Market Revenue Million Forecast, by Production Analysis 2020 & 2033
- Table 2: Global US Vertical Farming Market Revenue Million Forecast, by Consumption Analysis 2020 & 2033
- Table 3: Global US Vertical Farming Market Revenue Million Forecast, by Import Market Analysis (Value & Volume) 2020 & 2033
- Table 4: Global US Vertical Farming Market Revenue Million Forecast, by Export Market Analysis (Value & Volume) 2020 & 2033
- Table 5: Global US Vertical Farming Market Revenue Million Forecast, by Price Trend Analysis 2020 & 2033
- Table 6: Global US Vertical Farming Market Revenue Million Forecast, by Region 2020 & 2033
- Table 7: Global US Vertical Farming Market Revenue Million Forecast, by Production Analysis 2020 & 2033
- Table 8: Global US Vertical Farming Market Revenue Million Forecast, by Consumption Analysis 2020 & 2033
- Table 9: Global US Vertical Farming Market Revenue Million Forecast, by Import Market Analysis (Value & Volume) 2020 & 2033
- Table 10: Global US Vertical Farming Market Revenue Million Forecast, by Export Market Analysis (Value & Volume) 2020 & 2033
- Table 11: Global US Vertical Farming Market Revenue Million Forecast, by Price Trend Analysis 2020 & 2033
- Table 12: Global US Vertical Farming Market Revenue Million Forecast, by Country 2020 & 2033
- Table 13: United States US Vertical Farming Market Revenue (Million) Forecast, by Application 2020 & 2033
- Table 14: Canada US Vertical Farming Market Revenue (Million) Forecast, by Application 2020 & 2033
- Table 15: Mexico US Vertical Farming Market Revenue (Million) Forecast, by Application 2020 & 2033
- Table 16: Global US Vertical Farming Market Revenue Million Forecast, by Production Analysis 2020 & 2033
- Table 17: Global US Vertical Farming Market Revenue Million Forecast, by Consumption Analysis 2020 & 2033
- Table 18: Global US Vertical Farming Market Revenue Million Forecast, by Import Market Analysis (Value & Volume) 2020 & 2033
- Table 19: Global US Vertical Farming Market Revenue Million Forecast, by Export Market Analysis (Value & Volume) 2020 & 2033
- Table 20: Global US Vertical Farming Market Revenue Million Forecast, by Price Trend Analysis 2020 & 2033
- Table 21: Global US Vertical Farming Market Revenue Million Forecast, by Country 2020 & 2033
- Table 22: Brazil US Vertical Farming Market Revenue (Million) Forecast, by Application 2020 & 2033
- Table 23: Argentina US Vertical Farming Market Revenue (Million) Forecast, by Application 2020 & 2033
- Table 24: Rest of South America US Vertical Farming Market Revenue (Million) Forecast, by Application 2020 & 2033
- Table 25: Global US Vertical Farming Market Revenue Million Forecast, by Production Analysis 2020 & 2033
- Table 26: Global US Vertical Farming Market Revenue Million Forecast, by Consumption Analysis 2020 & 2033
- Table 27: Global US Vertical Farming Market Revenue Million Forecast, by Import Market Analysis (Value & Volume) 2020 & 2033
- Table 28: Global US Vertical Farming Market Revenue Million Forecast, by Export Market Analysis (Value & Volume) 2020 & 2033
- Table 29: Global US Vertical Farming Market Revenue Million Forecast, by Price Trend Analysis 2020 & 2033
- Table 30: Global US Vertical Farming Market Revenue Million Forecast, by Country 2020 & 2033
- Table 31: United Kingdom US Vertical Farming Market Revenue (Million) Forecast, by Application 2020 & 2033
- Table 32: Germany US Vertical Farming Market Revenue (Million) Forecast, by Application 2020 & 2033
- Table 33: France US Vertical Farming Market Revenue (Million) Forecast, by Application 2020 & 2033
- Table 34: Italy US Vertical Farming Market Revenue (Million) Forecast, by Application 2020 & 2033
- Table 35: Spain US Vertical Farming Market Revenue (Million) Forecast, by Application 2020 & 2033
- Table 36: Russia US Vertical Farming Market Revenue (Million) Forecast, by Application 2020 & 2033
- Table 37: Benelux US Vertical Farming Market Revenue (Million) Forecast, by Application 2020 & 2033
- Table 38: Nordics US Vertical Farming Market Revenue (Million) Forecast, by Application 2020 & 2033
- Table 39: Rest of Europe US Vertical Farming Market Revenue (Million) Forecast, by Application 2020 & 2033
- Table 40: Global US Vertical Farming Market Revenue Million Forecast, by Production Analysis 2020 & 2033
- Table 41: Global US Vertical Farming Market Revenue Million Forecast, by Consumption Analysis 2020 & 2033
- Table 42: Global US Vertical Farming Market Revenue Million Forecast, by Import Market Analysis (Value & Volume) 2020 & 2033
- Table 43: Global US Vertical Farming Market Revenue Million Forecast, by Export Market Analysis (Value & Volume) 2020 & 2033
- Table 44: Global US Vertical Farming Market Revenue Million Forecast, by Price Trend Analysis 2020 & 2033
- Table 45: Global US Vertical Farming Market Revenue Million Forecast, by Country 2020 & 2033
- Table 46: Turkey US Vertical Farming Market Revenue (Million) Forecast, by Application 2020 & 2033
- Table 47: Israel US Vertical Farming Market Revenue (Million) Forecast, by Application 2020 & 2033
- Table 48: GCC US Vertical Farming Market Revenue (Million) Forecast, by Application 2020 & 2033
- Table 49: North Africa US Vertical Farming Market Revenue (Million) Forecast, by Application 2020 & 2033
- Table 50: South Africa US Vertical Farming Market Revenue (Million) Forecast, by Application 2020 & 2033
- Table 51: Rest of Middle East & Africa US Vertical Farming Market Revenue (Million) Forecast, by Application 2020 & 2033
- Table 52: Global US Vertical Farming Market Revenue Million Forecast, by Production Analysis 2020 & 2033
- Table 53: Global US Vertical Farming Market Revenue Million Forecast, by Consumption Analysis 2020 & 2033
- Table 54: Global US Vertical Farming Market Revenue Million Forecast, by Import Market Analysis (Value & Volume) 2020 & 2033
- Table 55: Global US Vertical Farming Market Revenue Million Forecast, by Export Market Analysis (Value & Volume) 2020 & 2033
- Table 56: Global US Vertical Farming Market Revenue Million Forecast, by Price Trend Analysis 2020 & 2033
- Table 57: Global US Vertical Farming Market Revenue Million Forecast, by Country 2020 & 2033
- Table 58: China US Vertical Farming Market Revenue (Million) Forecast, by Application 2020 & 2033
- Table 59: India US Vertical Farming Market Revenue (Million) Forecast, by Application 2020 & 2033
- Table 60: Japan US Vertical Farming Market Revenue (Million) Forecast, by Application 2020 & 2033
- Table 61: South Korea US Vertical Farming Market Revenue (Million) Forecast, by Application 2020 & 2033
- Table 62: ASEAN US Vertical Farming Market Revenue (Million) Forecast, by Application 2020 & 2033
- Table 63: Oceania US Vertical Farming Market Revenue (Million) Forecast, by Application 2020 & 2033
- Table 64: Rest of Asia Pacific US Vertical Farming Market Revenue (Million) Forecast, by Application 2020 & 2033
Frequently Asked Questions
1. What is the projected Compound Annual Growth Rate (CAGR) of the US Vertical Farming Market?
The projected CAGR is approximately 10.80%.
2. Which companies are prominent players in the US Vertical Farming Market?
Key companies in the market include Bowery Farming Inc, Freight Farms, Plenty Unlimited Inc, Green Sense Farm Holdings Inc, Aero Farms, Altius Farm, Green Spirit Farms.
3. What are the main segments of the US Vertical Farming Market?
The market segments include Production Analysis, Consumption Analysis, Import Market Analysis (Value & Volume), Export Market Analysis (Value & Volume), Price Trend Analysis.
4. Can you provide details about the market size?
The market size is estimated to be USD 3.56 Million as of 2022.
5. What are some drivers contributing to market growth?
Seed Treatment As A Solution To Enhance Yield; Growing Awareness For Seed Treatment Among The Farmers; Rising Trend Of Organic Farming.
6. What are the notable trends driving market growth?
The Hydroponics Segment Dominates the Market.
7. Are there any restraints impacting market growth?
Limitations Across Farm-Level Seed Treatment; Rising Environmental Concerns.
8. Can you provide examples of recent developments in the market?
August 2023: Plenty Unlimited Inc., a San Francisco-based company, began construction on a vertical indoor farming campus that, when completed, is likely to be the largest such operation in the world. The campus, to be developed in phases totaling USD 300 million, will sit on 120 acres in the Meadowville Technology Park.
9. What pricing options are available for accessing the report?
Pricing options include single-user, multi-user, and enterprise licenses priced at USD 3800, USD 4500, and USD 5800 respectively.
10. Is the market size provided in terms of value or volume?
The market size is provided in terms of value, measured in Million.
11. Are there any specific market keywords associated with the report?
Yes, the market keyword associated with the report is "US Vertical Farming Market," which aids in identifying and referencing the specific market segment covered.
12. How do I determine which pricing option suits my needs best?
The pricing options vary based on user requirements and access needs. Individual users may opt for single-user licenses, while businesses requiring broader access may choose multi-user or enterprise licenses for cost-effective access to the report.
13. Are there any additional resources or data provided in the US Vertical Farming Market report?
While the report offers comprehensive insights, it's advisable to review the specific contents or supplementary materials provided to ascertain if additional resources or data are available.
14. How can I stay updated on further developments or reports in the US Vertical Farming Market?
To stay informed about further developments, trends, and reports in the US Vertical Farming Market, consider subscribing to industry newsletters, following relevant companies and organizations, or regularly checking reputable industry news sources and publications.
Methodology
Step 1 - Identification of Relevant Samples Size from Population Database


Step 2 - Approaches for Defining Global Market Size (Value, Volume* & Price*)

Note*: In applicable scenarios
Step 3 - Data Sources
Primary Research
- Web Analytics
- Survey Reports
- Research Institute
- Latest Research Reports
- Opinion Leaders
Secondary Research
- Annual Reports
- White Paper
- Latest Press Release
- Industry Association
- Paid Database
- Investor Presentations

Step 4 - Data Triangulation
Involves using different sources of information in order to increase the validity of a study
These sources are likely to be stakeholders in a program - participants, other researchers, program staff, other community members, and so on.
Then we put all data in single framework & apply various statistical tools to find out the dynamic on the market.
During the analysis stage, feedback from the stakeholder groups would be compared to determine areas of agreement as well as areas of divergence