

Key Insights
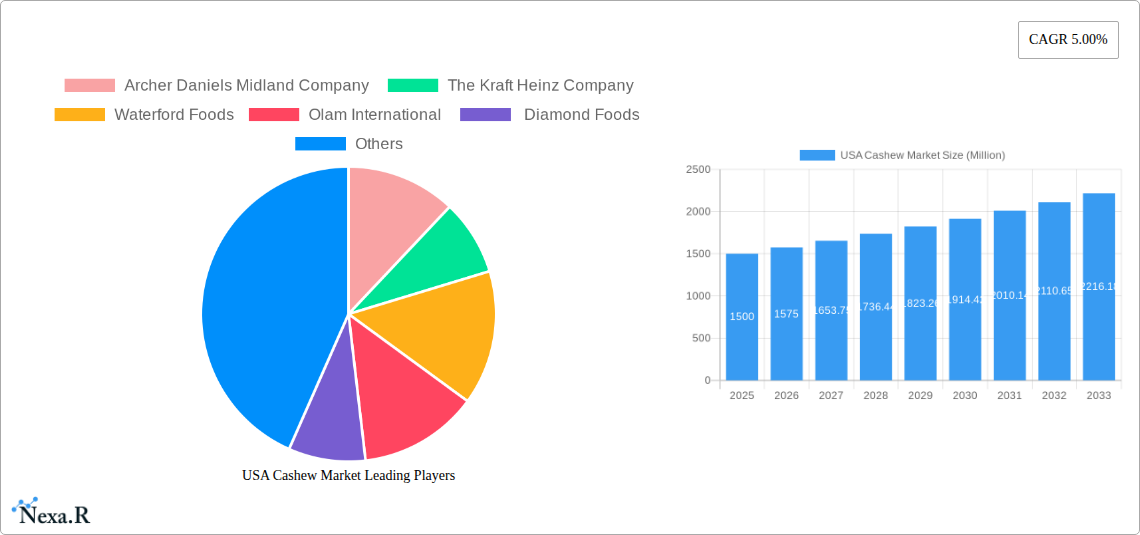
The US cashew market, a significant segment of the global cashew industry, is experiencing robust growth, projected to maintain a Compound Annual Growth Rate (CAGR) of 5% from 2025 to 2033. This expansion is fueled by several key drivers. Increasing consumer demand for healthy snacks, coupled with the rising popularity of plant-based diets and veganism, significantly boosts cashew consumption. Cashews' versatility – used in confectionery, baked goods, and as a standalone snack – contributes to this broad appeal. Furthermore, the growing awareness of cashews' nutritional benefits, including their high protein and healthy fat content, further drives market growth. The market is segmented by product type, including raw cashews, roasted cashews, salted cashews, cashew cream, and cashew butter, each catering to distinct consumer preferences and culinary applications. Major players like Archer Daniels Midland Company, The Kraft Heinz Company, and Diamond Foods are actively shaping the market through product innovation, strategic partnerships, and expanding distribution networks. While pricing fluctuations and potential supply chain disruptions present challenges, the overall market outlook remains positive, indicating sustained growth prospects throughout the forecast period.
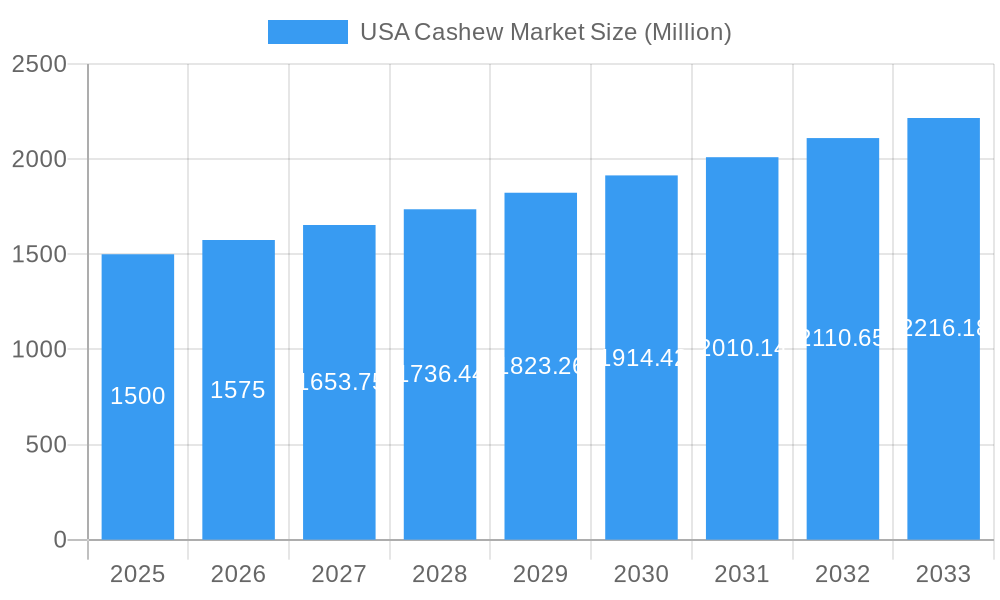
USA Cashew Market Market Size (In Billion)
The North American region, particularly the United States, holds a dominant share of the US cashew market due to high per capita consumption and established distribution channels. Market growth is further supported by the increasing adoption of convenient and ready-to-eat cashew products. This trend is particularly evident in the rise of cashew-based butter and cream, mirroring the broader market trend towards convenient and healthy snack options. The competitive landscape is characterized by both large multinational corporations and smaller specialized producers. Competition focuses on product differentiation, brand building, and innovative packaging to capture market share within specific segments. Successful strategies often involve targeted marketing campaigns emphasizing health benefits and convenience to reach health-conscious consumers. While challenges exist, including potential price volatility linked to raw cashew prices and global supply chains, the positive growth trajectory suggests a bright future for the US cashew market.
USA Cashew Market Company Market Share
USA Cashew Market: A Comprehensive Report (2019-2033)
This comprehensive report provides an in-depth analysis of the USA cashew market, encompassing market dynamics, growth trends, dominant segments, product landscape, key players, and future outlook. The study period covers 2019-2033, with 2025 as the base and estimated year, and a forecast period of 2025-2033. This report is invaluable for industry professionals, investors, and stakeholders seeking a complete understanding of this dynamic market. The report delves into both the parent market (nut and snack market) and the child market (cashew market) to provide a holistic perspective. The market size is valued at xx Million in 2025 and is projected to reach xx Million by 2033.
USA Cashew Market Market Dynamics & Structure
This section analyzes the competitive landscape, technological advancements, regulatory environment, and market trends shaping the USA cashew market. The market exhibits a moderately concentrated structure with key players holding significant market share. Technological innovations, particularly in processing and packaging, are driving efficiency and product diversification. Stringent food safety regulations and labeling requirements influence market operations. The rise of plant-based diets and health consciousness fuels demand for cashews and cashew-based products, while competitive substitutes like almonds and peanuts pose challenges. M&A activity in the sector remains moderate, with a focus on expanding product portfolios and geographical reach.
- Market Concentration: Moderately concentrated, with top 5 players holding approximately xx% market share in 2025.
- Technological Innovation: Focus on automation, improved processing techniques, and sustainable packaging solutions.
- Regulatory Framework: Adherence to FDA regulations regarding food safety and labeling is crucial.
- Competitive Substitutes: Almonds, peanuts, and other nuts compete for consumer preference.
- End-User Demographics: Growing demand from health-conscious consumers and those following plant-based diets.
- M&A Trends: Moderate activity, primarily focused on expansion and diversification.
USA Cashew Market Growth Trends & Insights
The USA cashew market demonstrates robust growth, driven by increasing health awareness, shifting consumer preferences towards plant-based foods, and the versatility of cashews in diverse food applications. The market experienced a CAGR of xx% during the historical period (2019-2024) and is projected to maintain a CAGR of xx% during the forecast period (2025-2033). Market penetration of cashew-based products, particularly cashew milk and butter, is steadily increasing. Technological advancements in processing and manufacturing contribute to efficiency and product innovation. Consumer behavior shifts towards convenient and healthy snacks further fuel market expansion. Factors such as fluctuating raw material prices and potential supply chain disruptions present challenges to consistent growth. Detailed segmentation by product type allows for a granular understanding of growth within specific categories.
Dominant Regions, Countries, or Segments in USA Cashew Market
The Western region of the USA currently dominates the cashew market, driven by high consumer demand, strong retail infrastructure, and a concentrated population with higher disposable incomes. California, in particular, plays a significant role due to its established food processing and distribution networks. Among product types, roasted cashews hold the largest market share, followed by raw cashews and cashew butter. Growth in the cashew butter segment is particularly noteworthy, propelled by its versatility in various food applications and increasing consumer awareness of its nutritional benefits.
- Key Drivers for Western Region Dominance: High consumer spending, well-developed retail infrastructure, and strong demand for healthy snacks.
- Roasted Cashews: Largest market share driven by consumer preference for convenience and ready-to-eat options.
- Cashew Butter: Fastest-growing segment, driven by increasing health consciousness and versatility in food applications.
USA Cashew Market Product Landscape
The USA cashew market offers a diverse range of products, including raw cashews, roasted cashews, salted cashews, cashew cream, and cashew butter. Innovation focuses on developing organic, gluten-free, and allergen-free options to cater to specific dietary needs. Value-added products like cashew milk and cashew cheese are gaining popularity, driven by the growing demand for plant-based alternatives. Technological advancements in processing and packaging enhance product quality, shelf life, and convenience. The market also sees growth in flavored and seasoned cashews, aiming to satisfy diverse taste preferences.
Key Drivers, Barriers & Challenges in USA Cashew Market
Key Drivers:
- Increasing consumer demand for healthy snacks and plant-based alternatives.
- Growth in the food service industry and use of cashews in various culinary applications.
- Innovation in product development, including new flavors, formats, and value-added products.
Key Challenges & Restraints:
- Fluctuating raw material prices and supply chain disruptions impacting profitability and product availability.
- Competition from other nuts and snack food categories.
- Stringent regulations and labeling requirements adding operational complexities.
Emerging Opportunities in USA Cashew Market
- Expanding into niche markets with specialized cashew products (e.g., organic, vegan, keto-friendly).
- Developing innovative applications for cashews in functional foods and health supplements.
- Leveraging online channels and e-commerce platforms to enhance product reach and accessibility.
Growth Accelerators in the USA Cashew Market Industry
Strategic partnerships between cashew processors and food manufacturers are driving innovation and market expansion. Technological breakthroughs in processing and packaging enhance product quality and efficiency, contributing to cost savings and improved product offerings. The increasing adoption of sustainable sourcing practices and fair trade initiatives adds value and appeals to ethically conscious consumers.
Key Players Shaping the USA Cashew Market Market
Notable Milestones in USA Cashew Market Sector
- February 2023: Launch of USDA-organic certified cold-pressed cashew milk and blue cold-pressed juice by Clean Juice. This signifies the growing demand for organic and healthy cashew-based beverages.
- September 2020: Z Natural Foods launched a dairy-free Cashew Milk Powder, expanding the market for convenient plant-based milk alternatives.
- February 2020: USDA launched a USD 38 million project to enhance the African cashew value chain, potentially impacting the supply and cost of cashews in the US market.
In-Depth USA Cashew Market Market Outlook
The future of the USA cashew market looks promising, with sustained growth driven by increasing consumer preference for healthy and convenient snacks. Further innovation in product development, coupled with strategic partnerships and sustainable sourcing initiatives, will shape the market landscape. The expanding plant-based food segment offers significant opportunities for cashew-based products. The market is poised for continued expansion, with significant growth potential in the coming years.
USA Cashew Market Segmentation
- 1. Production Analysis (Volume)
- 2. Consumption Analysis (Value and Volume)
- 3. Import Analysis (Value and Volume)
- 4. Export Analysis (Value and Volume)
- 5. Price Trend Analysis
- 6. Production Analysis (Volume)
- 7. Consumption Analysis (Value and Volume)
- 8. Import Analysis (Value and Volume)
- 9. Export Analysis (Value and Volume)
- 10. Price Trend Analysis
USA Cashew Market Segmentation By Geography
-
1. North America
- 1.1. United States
- 1.2. Canada
- 1.3. Mexico
-
2. South America
- 2.1. Brazil
- 2.2. Argentina
- 2.3. Rest of South America
-
3. Europe
- 3.1. United Kingdom
- 3.2. Germany
- 3.3. France
- 3.4. Italy
- 3.5. Spain
- 3.6. Russia
- 3.7. Benelux
- 3.8. Nordics
- 3.9. Rest of Europe
-
4. Middle East & Africa
- 4.1. Turkey
- 4.2. Israel
- 4.3. GCC
- 4.4. North Africa
- 4.5. South Africa
- 4.6. Rest of Middle East & Africa
-
5. Asia Pacific
- 5.1. China
- 5.2. India
- 5.3. Japan
- 5.4. South Korea
- 5.5. ASEAN
- 5.6. Oceania
- 5.7. Rest of Asia Pacific
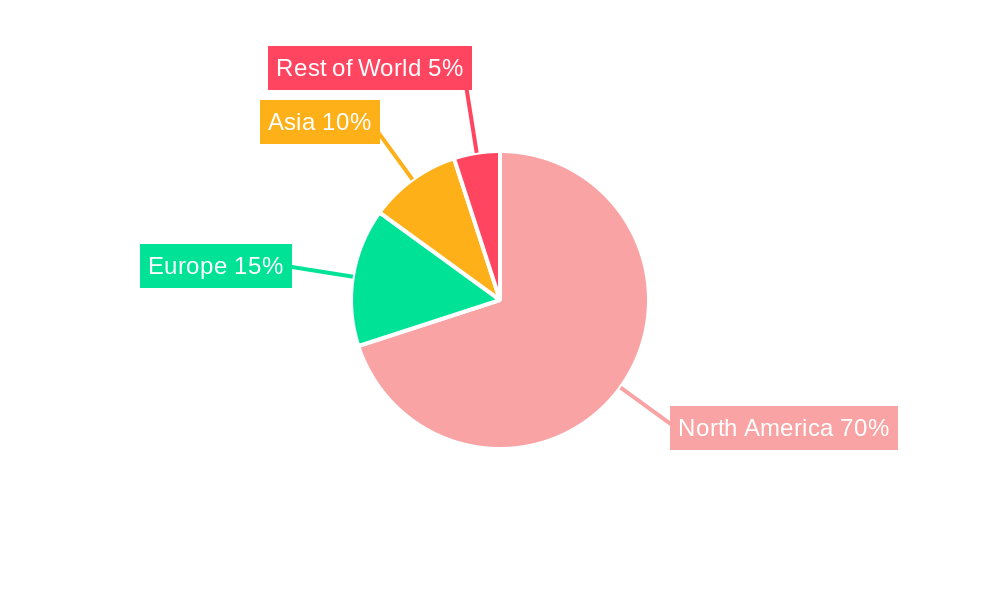
USA Cashew Market Regional Market Share
Geographic Coverage of USA Cashew Market
USA Cashew Market REPORT HIGHLIGHTS
| Aspects | Details |
|---|---|
| Study Period | 2020-2034 |
| Base Year | 2025 |
| Estimated Year | 2026 |
| Forecast Period | 2026-2034 |
| Historical Period | 2020-2025 |
| Growth Rate | CAGR of 5.00% from 2020-2034 |
| Segmentation |
|
Table of Contents
- 1. Introduction
- 1.1. Research Scope
- 1.2. Market Segmentation
- 1.3. Research Methodology
- 1.4. Definitions and Assumptions
- 2. Executive Summary
- 2.1. Introduction
- 3. Market Dynamics
- 3.1. Introduction
- 3.2. Market Drivers
- 3.2.1. Rising Consumption of Cashew Nuts in the Country; Favorable Government Initiatives
- 3.3. Market Restrains
- 3.3.1. Hazardous Climatic Condition Hinders Cashew Production; Stringent Regulations Related to Food Quality Standards
- 3.4. Market Trends
- 3.4.1. Health Benefits of Cashew Nuts Increases Consumption
- 4. Market Factor Analysis
- 4.1. Porters Five Forces
- 4.2. Supply/Value Chain
- 4.3. PESTEL analysis
- 4.4. Market Entropy
- 4.5. Patent/Trademark Analysis
- 5. Global USA Cashew Market Analysis, Insights and Forecast, 2020-2032
- 5.1. Market Analysis, Insights and Forecast - by Production Analysis (Volume)
- 5.2. Market Analysis, Insights and Forecast - by Consumption Analysis (Value and Volume)
- 5.3. Market Analysis, Insights and Forecast - by Import Analysis (Value and Volume)
- 5.4. Market Analysis, Insights and Forecast - by Export Analysis (Value and Volume)
- 5.5. Market Analysis, Insights and Forecast - by Price Trend Analysis
- 5.6. Market Analysis, Insights and Forecast - by Production Analysis (Volume)
- 5.7. Market Analysis, Insights and Forecast - by Consumption Analysis (Value and Volume)
- 5.8. Market Analysis, Insights and Forecast - by Import Analysis (Value and Volume)
- 5.9. Market Analysis, Insights and Forecast - by Export Analysis (Value and Volume)
- 5.10. Market Analysis, Insights and Forecast - by Price Trend Analysis
- 5.11. Market Analysis, Insights and Forecast - by Region
- 5.11.1. North America
- 5.11.2. South America
- 5.11.3. Europe
- 5.11.4. Middle East & Africa
- 5.11.5. Asia Pacific
- 5.1. Market Analysis, Insights and Forecast - by Production Analysis (Volume)
- 6. North America USA Cashew Market Analysis, Insights and Forecast, 2020-2032
- 6.1. Market Analysis, Insights and Forecast - by Production Analysis (Volume)
- 6.2. Market Analysis, Insights and Forecast - by Consumption Analysis (Value and Volume)
- 6.3. Market Analysis, Insights and Forecast - by Import Analysis (Value and Volume)
- 6.4. Market Analysis, Insights and Forecast - by Export Analysis (Value and Volume)
- 6.5. Market Analysis, Insights and Forecast - by Price Trend Analysis
- 6.6. Market Analysis, Insights and Forecast - by Production Analysis (Volume)
- 6.7. Market Analysis, Insights and Forecast - by Consumption Analysis (Value and Volume)
- 6.8. Market Analysis, Insights and Forecast - by Import Analysis (Value and Volume)
- 6.9. Market Analysis, Insights and Forecast - by Export Analysis (Value and Volume)
- 6.10. Market Analysis, Insights and Forecast - by Price Trend Analysis
- 6.1. Market Analysis, Insights and Forecast - by Production Analysis (Volume)
- 7. South America USA Cashew Market Analysis, Insights and Forecast, 2020-2032
- 7.1. Market Analysis, Insights and Forecast - by Production Analysis (Volume)
- 7.2. Market Analysis, Insights and Forecast - by Consumption Analysis (Value and Volume)
- 7.3. Market Analysis, Insights and Forecast - by Import Analysis (Value and Volume)
- 7.4. Market Analysis, Insights and Forecast - by Export Analysis (Value and Volume)
- 7.5. Market Analysis, Insights and Forecast - by Price Trend Analysis
- 7.6. Market Analysis, Insights and Forecast - by Production Analysis (Volume)
- 7.7. Market Analysis, Insights and Forecast - by Consumption Analysis (Value and Volume)
- 7.8. Market Analysis, Insights and Forecast - by Import Analysis (Value and Volume)
- 7.9. Market Analysis, Insights and Forecast - by Export Analysis (Value and Volume)
- 7.10. Market Analysis, Insights and Forecast - by Price Trend Analysis
- 7.1. Market Analysis, Insights and Forecast - by Production Analysis (Volume)
- 8. Europe USA Cashew Market Analysis, Insights and Forecast, 2020-2032
- 8.1. Market Analysis, Insights and Forecast - by Production Analysis (Volume)
- 8.2. Market Analysis, Insights and Forecast - by Consumption Analysis (Value and Volume)
- 8.3. Market Analysis, Insights and Forecast - by Import Analysis (Value and Volume)
- 8.4. Market Analysis, Insights and Forecast - by Export Analysis (Value and Volume)
- 8.5. Market Analysis, Insights and Forecast - by Price Trend Analysis
- 8.6. Market Analysis, Insights and Forecast - by Production Analysis (Volume)
- 8.7. Market Analysis, Insights and Forecast - by Consumption Analysis (Value and Volume)
- 8.8. Market Analysis, Insights and Forecast - by Import Analysis (Value and Volume)
- 8.9. Market Analysis, Insights and Forecast - by Export Analysis (Value and Volume)
- 8.10. Market Analysis, Insights and Forecast - by Price Trend Analysis
- 8.1. Market Analysis, Insights and Forecast - by Production Analysis (Volume)
- 9. Middle East & Africa USA Cashew Market Analysis, Insights and Forecast, 2020-2032
- 9.1. Market Analysis, Insights and Forecast - by Production Analysis (Volume)
- 9.2. Market Analysis, Insights and Forecast - by Consumption Analysis (Value and Volume)
- 9.3. Market Analysis, Insights and Forecast - by Import Analysis (Value and Volume)
- 9.4. Market Analysis, Insights and Forecast - by Export Analysis (Value and Volume)
- 9.5. Market Analysis, Insights and Forecast - by Price Trend Analysis
- 9.6. Market Analysis, Insights and Forecast - by Production Analysis (Volume)
- 9.7. Market Analysis, Insights and Forecast - by Consumption Analysis (Value and Volume)
- 9.8. Market Analysis, Insights and Forecast - by Import Analysis (Value and Volume)
- 9.9. Market Analysis, Insights and Forecast - by Export Analysis (Value and Volume)
- 9.10. Market Analysis, Insights and Forecast - by Price Trend Analysis
- 9.1. Market Analysis, Insights and Forecast - by Production Analysis (Volume)
- 10. Asia Pacific USA Cashew Market Analysis, Insights and Forecast, 2020-2032
- 10.1. Market Analysis, Insights and Forecast - by Production Analysis (Volume)
- 10.2. Market Analysis, Insights and Forecast - by Consumption Analysis (Value and Volume)
- 10.3. Market Analysis, Insights and Forecast - by Import Analysis (Value and Volume)
- 10.4. Market Analysis, Insights and Forecast - by Export Analysis (Value and Volume)
- 10.5. Market Analysis, Insights and Forecast - by Price Trend Analysis
- 10.6. Market Analysis, Insights and Forecast - by Production Analysis (Volume)
- 10.7. Market Analysis, Insights and Forecast - by Consumption Analysis (Value and Volume)
- 10.8. Market Analysis, Insights and Forecast - by Import Analysis (Value and Volume)
- 10.9. Market Analysis, Insights and Forecast - by Export Analysis (Value and Volume)
- 10.10. Market Analysis, Insights and Forecast - by Price Trend Analysis
- 10.1. Market Analysis, Insights and Forecast - by Production Analysis (Volume)
- 11. Competitive Analysis
- 11.1. Global Market Share Analysis 2025
- 11.2. Company Profiles
- 11.2.1 Archer Daniels Midland Company
- 11.2.1.1. Overview
- 11.2.1.2. Products
- 11.2.1.3. SWOT Analysis
- 11.2.1.4. Recent Developments
- 11.2.1.5. Financials (Based on Availability)
- 11.2.2 The Kraft Heinz Company
- 11.2.2.1. Overview
- 11.2.2.2. Products
- 11.2.2.3. SWOT Analysis
- 11.2.2.4. Recent Developments
- 11.2.2.5. Financials (Based on Availability)
- 11.2.3 Waterford Foods
- 11.2.3.1. Overview
- 11.2.3.2. Products
- 11.2.3.3. SWOT Analysis
- 11.2.3.4. Recent Developments
- 11.2.3.5. Financials (Based on Availability)
- 11.2.4 Olam International
- 11.2.4.1. Overview
- 11.2.4.2. Products
- 11.2.4.3. SWOT Analysis
- 11.2.4.4. Recent Developments
- 11.2.4.5. Financials (Based on Availability)
- 11.2.5 Diamond Foods
- 11.2.5.1. Overview
- 11.2.5.2. Products
- 11.2.5.3. SWOT Analysis
- 11.2.5.4. Recent Developments
- 11.2.5.5. Financials (Based on Availability)
- 11.2.1 Archer Daniels Midland Company
List of Figures
- Figure 1: Global USA Cashew Market Revenue Breakdown (Million, %) by Region 2025 & 2033
- Figure 2: Global USA Cashew Market Volume Breakdown (Kiloton, %) by Region 2025 & 2033
- Figure 3: North America USA Cashew Market Revenue (Million), by Production Analysis (Volume) 2025 & 2033
- Figure 4: North America USA Cashew Market Volume (Kiloton), by Production Analysis (Volume) 2025 & 2033
- Figure 5: North America USA Cashew Market Revenue Share (%), by Production Analysis (Volume) 2025 & 2033
- Figure 6: North America USA Cashew Market Volume Share (%), by Production Analysis (Volume) 2025 & 2033
- Figure 7: North America USA Cashew Market Revenue (Million), by Consumption Analysis (Value and Volume) 2025 & 2033
- Figure 8: North America USA Cashew Market Volume (Kiloton), by Consumption Analysis (Value and Volume) 2025 & 2033
- Figure 9: North America USA Cashew Market Revenue Share (%), by Consumption Analysis (Value and Volume) 2025 & 2033
- Figure 10: North America USA Cashew Market Volume Share (%), by Consumption Analysis (Value and Volume) 2025 & 2033
- Figure 11: North America USA Cashew Market Revenue (Million), by Import Analysis (Value and Volume) 2025 & 2033
- Figure 12: North America USA Cashew Market Volume (Kiloton), by Import Analysis (Value and Volume) 2025 & 2033
- Figure 13: North America USA Cashew Market Revenue Share (%), by Import Analysis (Value and Volume) 2025 & 2033
- Figure 14: North America USA Cashew Market Volume Share (%), by Import Analysis (Value and Volume) 2025 & 2033
- Figure 15: North America USA Cashew Market Revenue (Million), by Export Analysis (Value and Volume) 2025 & 2033
- Figure 16: North America USA Cashew Market Volume (Kiloton), by Export Analysis (Value and Volume) 2025 & 2033
- Figure 17: North America USA Cashew Market Revenue Share (%), by Export Analysis (Value and Volume) 2025 & 2033
- Figure 18: North America USA Cashew Market Volume Share (%), by Export Analysis (Value and Volume) 2025 & 2033
- Figure 19: North America USA Cashew Market Revenue (Million), by Price Trend Analysis 2025 & 2033
- Figure 20: North America USA Cashew Market Volume (Kiloton), by Price Trend Analysis 2025 & 2033
- Figure 21: North America USA Cashew Market Revenue Share (%), by Price Trend Analysis 2025 & 2033
- Figure 22: North America USA Cashew Market Volume Share (%), by Price Trend Analysis 2025 & 2033
- Figure 23: North America USA Cashew Market Revenue (Million), by Production Analysis (Volume) 2025 & 2033
- Figure 24: North America USA Cashew Market Volume (Kiloton), by Production Analysis (Volume) 2025 & 2033
- Figure 25: North America USA Cashew Market Revenue Share (%), by Production Analysis (Volume) 2025 & 2033
- Figure 26: North America USA Cashew Market Volume Share (%), by Production Analysis (Volume) 2025 & 2033
- Figure 27: North America USA Cashew Market Revenue (Million), by Consumption Analysis (Value and Volume) 2025 & 2033
- Figure 28: North America USA Cashew Market Volume (Kiloton), by Consumption Analysis (Value and Volume) 2025 & 2033
- Figure 29: North America USA Cashew Market Revenue Share (%), by Consumption Analysis (Value and Volume) 2025 & 2033
- Figure 30: North America USA Cashew Market Volume Share (%), by Consumption Analysis (Value and Volume) 2025 & 2033
- Figure 31: North America USA Cashew Market Revenue (Million), by Import Analysis (Value and Volume) 2025 & 2033
- Figure 32: North America USA Cashew Market Volume (Kiloton), by Import Analysis (Value and Volume) 2025 & 2033
- Figure 33: North America USA Cashew Market Revenue Share (%), by Import Analysis (Value and Volume) 2025 & 2033
- Figure 34: North America USA Cashew Market Volume Share (%), by Import Analysis (Value and Volume) 2025 & 2033
- Figure 35: North America USA Cashew Market Revenue (Million), by Export Analysis (Value and Volume) 2025 & 2033
- Figure 36: North America USA Cashew Market Volume (Kiloton), by Export Analysis (Value and Volume) 2025 & 2033
- Figure 37: North America USA Cashew Market Revenue Share (%), by Export Analysis (Value and Volume) 2025 & 2033
- Figure 38: North America USA Cashew Market Volume Share (%), by Export Analysis (Value and Volume) 2025 & 2033
- Figure 39: North America USA Cashew Market Revenue (Million), by Price Trend Analysis 2025 & 2033
- Figure 40: North America USA Cashew Market Volume (Kiloton), by Price Trend Analysis 2025 & 2033
- Figure 41: North America USA Cashew Market Revenue Share (%), by Price Trend Analysis 2025 & 2033
- Figure 42: North America USA Cashew Market Volume Share (%), by Price Trend Analysis 2025 & 2033
- Figure 43: North America USA Cashew Market Revenue (Million), by Country 2025 & 2033
- Figure 44: North America USA Cashew Market Volume (Kiloton), by Country 2025 & 2033
- Figure 45: North America USA Cashew Market Revenue Share (%), by Country 2025 & 2033
- Figure 46: North America USA Cashew Market Volume Share (%), by Country 2025 & 2033
- Figure 47: South America USA Cashew Market Revenue (Million), by Production Analysis (Volume) 2025 & 2033
- Figure 48: South America USA Cashew Market Volume (Kiloton), by Production Analysis (Volume) 2025 & 2033
- Figure 49: South America USA Cashew Market Revenue Share (%), by Production Analysis (Volume) 2025 & 2033
- Figure 50: South America USA Cashew Market Volume Share (%), by Production Analysis (Volume) 2025 & 2033
- Figure 51: South America USA Cashew Market Revenue (Million), by Consumption Analysis (Value and Volume) 2025 & 2033
- Figure 52: South America USA Cashew Market Volume (Kiloton), by Consumption Analysis (Value and Volume) 2025 & 2033
- Figure 53: South America USA Cashew Market Revenue Share (%), by Consumption Analysis (Value and Volume) 2025 & 2033
- Figure 54: South America USA Cashew Market Volume Share (%), by Consumption Analysis (Value and Volume) 2025 & 2033
- Figure 55: South America USA Cashew Market Revenue (Million), by Import Analysis (Value and Volume) 2025 & 2033
- Figure 56: South America USA Cashew Market Volume (Kiloton), by Import Analysis (Value and Volume) 2025 & 2033
- Figure 57: South America USA Cashew Market Revenue Share (%), by Import Analysis (Value and Volume) 2025 & 2033
- Figure 58: South America USA Cashew Market Volume Share (%), by Import Analysis (Value and Volume) 2025 & 2033
- Figure 59: South America USA Cashew Market Revenue (Million), by Export Analysis (Value and Volume) 2025 & 2033
- Figure 60: South America USA Cashew Market Volume (Kiloton), by Export Analysis (Value and Volume) 2025 & 2033
- Figure 61: South America USA Cashew Market Revenue Share (%), by Export Analysis (Value and Volume) 2025 & 2033
- Figure 62: South America USA Cashew Market Volume Share (%), by Export Analysis (Value and Volume) 2025 & 2033
- Figure 63: South America USA Cashew Market Revenue (Million), by Price Trend Analysis 2025 & 2033
- Figure 64: South America USA Cashew Market Volume (Kiloton), by Price Trend Analysis 2025 & 2033
- Figure 65: South America USA Cashew Market Revenue Share (%), by Price Trend Analysis 2025 & 2033
- Figure 66: South America USA Cashew Market Volume Share (%), by Price Trend Analysis 2025 & 2033
- Figure 67: South America USA Cashew Market Revenue (Million), by Production Analysis (Volume) 2025 & 2033
- Figure 68: South America USA Cashew Market Volume (Kiloton), by Production Analysis (Volume) 2025 & 2033
- Figure 69: South America USA Cashew Market Revenue Share (%), by Production Analysis (Volume) 2025 & 2033
- Figure 70: South America USA Cashew Market Volume Share (%), by Production Analysis (Volume) 2025 & 2033
- Figure 71: South America USA Cashew Market Revenue (Million), by Consumption Analysis (Value and Volume) 2025 & 2033
- Figure 72: South America USA Cashew Market Volume (Kiloton), by Consumption Analysis (Value and Volume) 2025 & 2033
- Figure 73: South America USA Cashew Market Revenue Share (%), by Consumption Analysis (Value and Volume) 2025 & 2033
- Figure 74: South America USA Cashew Market Volume Share (%), by Consumption Analysis (Value and Volume) 2025 & 2033
- Figure 75: South America USA Cashew Market Revenue (Million), by Import Analysis (Value and Volume) 2025 & 2033
- Figure 76: South America USA Cashew Market Volume (Kiloton), by Import Analysis (Value and Volume) 2025 & 2033
- Figure 77: South America USA Cashew Market Revenue Share (%), by Import Analysis (Value and Volume) 2025 & 2033
- Figure 78: South America USA Cashew Market Volume Share (%), by Import Analysis (Value and Volume) 2025 & 2033
- Figure 79: South America USA Cashew Market Revenue (Million), by Export Analysis (Value and Volume) 2025 & 2033
- Figure 80: South America USA Cashew Market Volume (Kiloton), by Export Analysis (Value and Volume) 2025 & 2033
- Figure 81: South America USA Cashew Market Revenue Share (%), by Export Analysis (Value and Volume) 2025 & 2033
- Figure 82: South America USA Cashew Market Volume Share (%), by Export Analysis (Value and Volume) 2025 & 2033
- Figure 83: South America USA Cashew Market Revenue (Million), by Price Trend Analysis 2025 & 2033
- Figure 84: South America USA Cashew Market Volume (Kiloton), by Price Trend Analysis 2025 & 2033
- Figure 85: South America USA Cashew Market Revenue Share (%), by Price Trend Analysis 2025 & 2033
- Figure 86: South America USA Cashew Market Volume Share (%), by Price Trend Analysis 2025 & 2033
- Figure 87: South America USA Cashew Market Revenue (Million), by Country 2025 & 2033
- Figure 88: South America USA Cashew Market Volume (Kiloton), by Country 2025 & 2033
- Figure 89: South America USA Cashew Market Revenue Share (%), by Country 2025 & 2033
- Figure 90: South America USA Cashew Market Volume Share (%), by Country 2025 & 2033
- Figure 91: Europe USA Cashew Market Revenue (Million), by Production Analysis (Volume) 2025 & 2033
- Figure 92: Europe USA Cashew Market Volume (Kiloton), by Production Analysis (Volume) 2025 & 2033
- Figure 93: Europe USA Cashew Market Revenue Share (%), by Production Analysis (Volume) 2025 & 2033
- Figure 94: Europe USA Cashew Market Volume Share (%), by Production Analysis (Volume) 2025 & 2033
- Figure 95: Europe USA Cashew Market Revenue (Million), by Consumption Analysis (Value and Volume) 2025 & 2033
- Figure 96: Europe USA Cashew Market Volume (Kiloton), by Consumption Analysis (Value and Volume) 2025 & 2033
- Figure 97: Europe USA Cashew Market Revenue Share (%), by Consumption Analysis (Value and Volume) 2025 & 2033
- Figure 98: Europe USA Cashew Market Volume Share (%), by Consumption Analysis (Value and Volume) 2025 & 2033
- Figure 99: Europe USA Cashew Market Revenue (Million), by Import Analysis (Value and Volume) 2025 & 2033
- Figure 100: Europe USA Cashew Market Volume (Kiloton), by Import Analysis (Value and Volume) 2025 & 2033
- Figure 101: Europe USA Cashew Market Revenue Share (%), by Import Analysis (Value and Volume) 2025 & 2033
- Figure 102: Europe USA Cashew Market Volume Share (%), by Import Analysis (Value and Volume) 2025 & 2033
- Figure 103: Europe USA Cashew Market Revenue (Million), by Export Analysis (Value and Volume) 2025 & 2033
- Figure 104: Europe USA Cashew Market Volume (Kiloton), by Export Analysis (Value and Volume) 2025 & 2033
- Figure 105: Europe USA Cashew Market Revenue Share (%), by Export Analysis (Value and Volume) 2025 & 2033
- Figure 106: Europe USA Cashew Market Volume Share (%), by Export Analysis (Value and Volume) 2025 & 2033
- Figure 107: Europe USA Cashew Market Revenue (Million), by Price Trend Analysis 2025 & 2033
- Figure 108: Europe USA Cashew Market Volume (Kiloton), by Price Trend Analysis 2025 & 2033
- Figure 109: Europe USA Cashew Market Revenue Share (%), by Price Trend Analysis 2025 & 2033
- Figure 110: Europe USA Cashew Market Volume Share (%), by Price Trend Analysis 2025 & 2033
- Figure 111: Europe USA Cashew Market Revenue (Million), by Production Analysis (Volume) 2025 & 2033
- Figure 112: Europe USA Cashew Market Volume (Kiloton), by Production Analysis (Volume) 2025 & 2033
- Figure 113: Europe USA Cashew Market Revenue Share (%), by Production Analysis (Volume) 2025 & 2033
- Figure 114: Europe USA Cashew Market Volume Share (%), by Production Analysis (Volume) 2025 & 2033
- Figure 115: Europe USA Cashew Market Revenue (Million), by Consumption Analysis (Value and Volume) 2025 & 2033
- Figure 116: Europe USA Cashew Market Volume (Kiloton), by Consumption Analysis (Value and Volume) 2025 & 2033
- Figure 117: Europe USA Cashew Market Revenue Share (%), by Consumption Analysis (Value and Volume) 2025 & 2033
- Figure 118: Europe USA Cashew Market Volume Share (%), by Consumption Analysis (Value and Volume) 2025 & 2033
- Figure 119: Europe USA Cashew Market Revenue (Million), by Import Analysis (Value and Volume) 2025 & 2033
- Figure 120: Europe USA Cashew Market Volume (Kiloton), by Import Analysis (Value and Volume) 2025 & 2033
- Figure 121: Europe USA Cashew Market Revenue Share (%), by Import Analysis (Value and Volume) 2025 & 2033
- Figure 122: Europe USA Cashew Market Volume Share (%), by Import Analysis (Value and Volume) 2025 & 2033
- Figure 123: Europe USA Cashew Market Revenue (Million), by Export Analysis (Value and Volume) 2025 & 2033
- Figure 124: Europe USA Cashew Market Volume (Kiloton), by Export Analysis (Value and Volume) 2025 & 2033
- Figure 125: Europe USA Cashew Market Revenue Share (%), by Export Analysis (Value and Volume) 2025 & 2033
- Figure 126: Europe USA Cashew Market Volume Share (%), by Export Analysis (Value and Volume) 2025 & 2033
- Figure 127: Europe USA Cashew Market Revenue (Million), by Price Trend Analysis 2025 & 2033
- Figure 128: Europe USA Cashew Market Volume (Kiloton), by Price Trend Analysis 2025 & 2033
- Figure 129: Europe USA Cashew Market Revenue Share (%), by Price Trend Analysis 2025 & 2033
- Figure 130: Europe USA Cashew Market Volume Share (%), by Price Trend Analysis 2025 & 2033
- Figure 131: Europe USA Cashew Market Revenue (Million), by Country 2025 & 2033
- Figure 132: Europe USA Cashew Market Volume (Kiloton), by Country 2025 & 2033
- Figure 133: Europe USA Cashew Market Revenue Share (%), by Country 2025 & 2033
- Figure 134: Europe USA Cashew Market Volume Share (%), by Country 2025 & 2033
- Figure 135: Middle East & Africa USA Cashew Market Revenue (Million), by Production Analysis (Volume) 2025 & 2033
- Figure 136: Middle East & Africa USA Cashew Market Volume (Kiloton), by Production Analysis (Volume) 2025 & 2033
- Figure 137: Middle East & Africa USA Cashew Market Revenue Share (%), by Production Analysis (Volume) 2025 & 2033
- Figure 138: Middle East & Africa USA Cashew Market Volume Share (%), by Production Analysis (Volume) 2025 & 2033
- Figure 139: Middle East & Africa USA Cashew Market Revenue (Million), by Consumption Analysis (Value and Volume) 2025 & 2033
- Figure 140: Middle East & Africa USA Cashew Market Volume (Kiloton), by Consumption Analysis (Value and Volume) 2025 & 2033
- Figure 141: Middle East & Africa USA Cashew Market Revenue Share (%), by Consumption Analysis (Value and Volume) 2025 & 2033
- Figure 142: Middle East & Africa USA Cashew Market Volume Share (%), by Consumption Analysis (Value and Volume) 2025 & 2033
- Figure 143: Middle East & Africa USA Cashew Market Revenue (Million), by Import Analysis (Value and Volume) 2025 & 2033
- Figure 144: Middle East & Africa USA Cashew Market Volume (Kiloton), by Import Analysis (Value and Volume) 2025 & 2033
- Figure 145: Middle East & Africa USA Cashew Market Revenue Share (%), by Import Analysis (Value and Volume) 2025 & 2033
- Figure 146: Middle East & Africa USA Cashew Market Volume Share (%), by Import Analysis (Value and Volume) 2025 & 2033
- Figure 147: Middle East & Africa USA Cashew Market Revenue (Million), by Export Analysis (Value and Volume) 2025 & 2033
- Figure 148: Middle East & Africa USA Cashew Market Volume (Kiloton), by Export Analysis (Value and Volume) 2025 & 2033
- Figure 149: Middle East & Africa USA Cashew Market Revenue Share (%), by Export Analysis (Value and Volume) 2025 & 2033
- Figure 150: Middle East & Africa USA Cashew Market Volume Share (%), by Export Analysis (Value and Volume) 2025 & 2033
- Figure 151: Middle East & Africa USA Cashew Market Revenue (Million), by Price Trend Analysis 2025 & 2033
- Figure 152: Middle East & Africa USA Cashew Market Volume (Kiloton), by Price Trend Analysis 2025 & 2033
- Figure 153: Middle East & Africa USA Cashew Market Revenue Share (%), by Price Trend Analysis 2025 & 2033
- Figure 154: Middle East & Africa USA Cashew Market Volume Share (%), by Price Trend Analysis 2025 & 2033
- Figure 155: Middle East & Africa USA Cashew Market Revenue (Million), by Production Analysis (Volume) 2025 & 2033
- Figure 156: Middle East & Africa USA Cashew Market Volume (Kiloton), by Production Analysis (Volume) 2025 & 2033
- Figure 157: Middle East & Africa USA Cashew Market Revenue Share (%), by Production Analysis (Volume) 2025 & 2033
- Figure 158: Middle East & Africa USA Cashew Market Volume Share (%), by Production Analysis (Volume) 2025 & 2033
- Figure 159: Middle East & Africa USA Cashew Market Revenue (Million), by Consumption Analysis (Value and Volume) 2025 & 2033
- Figure 160: Middle East & Africa USA Cashew Market Volume (Kiloton), by Consumption Analysis (Value and Volume) 2025 & 2033
- Figure 161: Middle East & Africa USA Cashew Market Revenue Share (%), by Consumption Analysis (Value and Volume) 2025 & 2033
- Figure 162: Middle East & Africa USA Cashew Market Volume Share (%), by Consumption Analysis (Value and Volume) 2025 & 2033
- Figure 163: Middle East & Africa USA Cashew Market Revenue (Million), by Import Analysis (Value and Volume) 2025 & 2033
- Figure 164: Middle East & Africa USA Cashew Market Volume (Kiloton), by Import Analysis (Value and Volume) 2025 & 2033
- Figure 165: Middle East & Africa USA Cashew Market Revenue Share (%), by Import Analysis (Value and Volume) 2025 & 2033
- Figure 166: Middle East & Africa USA Cashew Market Volume Share (%), by Import Analysis (Value and Volume) 2025 & 2033
- Figure 167: Middle East & Africa USA Cashew Market Revenue (Million), by Export Analysis (Value and Volume) 2025 & 2033
- Figure 168: Middle East & Africa USA Cashew Market Volume (Kiloton), by Export Analysis (Value and Volume) 2025 & 2033
- Figure 169: Middle East & Africa USA Cashew Market Revenue Share (%), by Export Analysis (Value and Volume) 2025 & 2033
- Figure 170: Middle East & Africa USA Cashew Market Volume Share (%), by Export Analysis (Value and Volume) 2025 & 2033
- Figure 171: Middle East & Africa USA Cashew Market Revenue (Million), by Price Trend Analysis 2025 & 2033
- Figure 172: Middle East & Africa USA Cashew Market Volume (Kiloton), by Price Trend Analysis 2025 & 2033
- Figure 173: Middle East & Africa USA Cashew Market Revenue Share (%), by Price Trend Analysis 2025 & 2033
- Figure 174: Middle East & Africa USA Cashew Market Volume Share (%), by Price Trend Analysis 2025 & 2033
- Figure 175: Middle East & Africa USA Cashew Market Revenue (Million), by Country 2025 & 2033
- Figure 176: Middle East & Africa USA Cashew Market Volume (Kiloton), by Country 2025 & 2033
- Figure 177: Middle East & Africa USA Cashew Market Revenue Share (%), by Country 2025 & 2033
- Figure 178: Middle East & Africa USA Cashew Market Volume Share (%), by Country 2025 & 2033
- Figure 179: Asia Pacific USA Cashew Market Revenue (Million), by Production Analysis (Volume) 2025 & 2033
- Figure 180: Asia Pacific USA Cashew Market Volume (Kiloton), by Production Analysis (Volume) 2025 & 2033
- Figure 181: Asia Pacific USA Cashew Market Revenue Share (%), by Production Analysis (Volume) 2025 & 2033
- Figure 182: Asia Pacific USA Cashew Market Volume Share (%), by Production Analysis (Volume) 2025 & 2033
- Figure 183: Asia Pacific USA Cashew Market Revenue (Million), by Consumption Analysis (Value and Volume) 2025 & 2033
- Figure 184: Asia Pacific USA Cashew Market Volume (Kiloton), by Consumption Analysis (Value and Volume) 2025 & 2033
- Figure 185: Asia Pacific USA Cashew Market Revenue Share (%), by Consumption Analysis (Value and Volume) 2025 & 2033
- Figure 186: Asia Pacific USA Cashew Market Volume Share (%), by Consumption Analysis (Value and Volume) 2025 & 2033
- Figure 187: Asia Pacific USA Cashew Market Revenue (Million), by Import Analysis (Value and Volume) 2025 & 2033
- Figure 188: Asia Pacific USA Cashew Market Volume (Kiloton), by Import Analysis (Value and Volume) 2025 & 2033
- Figure 189: Asia Pacific USA Cashew Market Revenue Share (%), by Import Analysis (Value and Volume) 2025 & 2033
- Figure 190: Asia Pacific USA Cashew Market Volume Share (%), by Import Analysis (Value and Volume) 2025 & 2033
- Figure 191: Asia Pacific USA Cashew Market Revenue (Million), by Export Analysis (Value and Volume) 2025 & 2033
- Figure 192: Asia Pacific USA Cashew Market Volume (Kiloton), by Export Analysis (Value and Volume) 2025 & 2033
- Figure 193: Asia Pacific USA Cashew Market Revenue Share (%), by Export Analysis (Value and Volume) 2025 & 2033
- Figure 194: Asia Pacific USA Cashew Market Volume Share (%), by Export Analysis (Value and Volume) 2025 & 2033
- Figure 195: Asia Pacific USA Cashew Market Revenue (Million), by Price Trend Analysis 2025 & 2033
- Figure 196: Asia Pacific USA Cashew Market Volume (Kiloton), by Price Trend Analysis 2025 & 2033
- Figure 197: Asia Pacific USA Cashew Market Revenue Share (%), by Price Trend Analysis 2025 & 2033
- Figure 198: Asia Pacific USA Cashew Market Volume Share (%), by Price Trend Analysis 2025 & 2033
- Figure 199: Asia Pacific USA Cashew Market Revenue (Million), by Production Analysis (Volume) 2025 & 2033
- Figure 200: Asia Pacific USA Cashew Market Volume (Kiloton), by Production Analysis (Volume) 2025 & 2033
- Figure 201: Asia Pacific USA Cashew Market Revenue Share (%), by Production Analysis (Volume) 2025 & 2033
- Figure 202: Asia Pacific USA Cashew Market Volume Share (%), by Production Analysis (Volume) 2025 & 2033
- Figure 203: Asia Pacific USA Cashew Market Revenue (Million), by Consumption Analysis (Value and Volume) 2025 & 2033
- Figure 204: Asia Pacific USA Cashew Market Volume (Kiloton), by Consumption Analysis (Value and Volume) 2025 & 2033
- Figure 205: Asia Pacific USA Cashew Market Revenue Share (%), by Consumption Analysis (Value and Volume) 2025 & 2033
- Figure 206: Asia Pacific USA Cashew Market Volume Share (%), by Consumption Analysis (Value and Volume) 2025 & 2033
- Figure 207: Asia Pacific USA Cashew Market Revenue (Million), by Import Analysis (Value and Volume) 2025 & 2033
- Figure 208: Asia Pacific USA Cashew Market Volume (Kiloton), by Import Analysis (Value and Volume) 2025 & 2033
- Figure 209: Asia Pacific USA Cashew Market Revenue Share (%), by Import Analysis (Value and Volume) 2025 & 2033
- Figure 210: Asia Pacific USA Cashew Market Volume Share (%), by Import Analysis (Value and Volume) 2025 & 2033
- Figure 211: Asia Pacific USA Cashew Market Revenue (Million), by Export Analysis (Value and Volume) 2025 & 2033
- Figure 212: Asia Pacific USA Cashew Market Volume (Kiloton), by Export Analysis (Value and Volume) 2025 & 2033
- Figure 213: Asia Pacific USA Cashew Market Revenue Share (%), by Export Analysis (Value and Volume) 2025 & 2033
- Figure 214: Asia Pacific USA Cashew Market Volume Share (%), by Export Analysis (Value and Volume) 2025 & 2033
- Figure 215: Asia Pacific USA Cashew Market Revenue (Million), by Price Trend Analysis 2025 & 2033
- Figure 216: Asia Pacific USA Cashew Market Volume (Kiloton), by Price Trend Analysis 2025 & 2033
- Figure 217: Asia Pacific USA Cashew Market Revenue Share (%), by Price Trend Analysis 2025 & 2033
- Figure 218: Asia Pacific USA Cashew Market Volume Share (%), by Price Trend Analysis 2025 & 2033
- Figure 219: Asia Pacific USA Cashew Market Revenue (Million), by Country 2025 & 2033
- Figure 220: Asia Pacific USA Cashew Market Volume (Kiloton), by Country 2025 & 2033
- Figure 221: Asia Pacific USA Cashew Market Revenue Share (%), by Country 2025 & 2033
- Figure 222: Asia Pacific USA Cashew Market Volume Share (%), by Country 2025 & 2033
List of Tables
- Table 1: Global USA Cashew Market Revenue Million Forecast, by Production Analysis (Volume) 2020 & 2033
- Table 2: Global USA Cashew Market Volume Kiloton Forecast, by Production Analysis (Volume) 2020 & 2033
- Table 3: Global USA Cashew Market Revenue Million Forecast, by Consumption Analysis (Value and Volume) 2020 & 2033
- Table 4: Global USA Cashew Market Volume Kiloton Forecast, by Consumption Analysis (Value and Volume) 2020 & 2033
- Table 5: Global USA Cashew Market Revenue Million Forecast, by Import Analysis (Value and Volume) 2020 & 2033
- Table 6: Global USA Cashew Market Volume Kiloton Forecast, by Import Analysis (Value and Volume) 2020 & 2033
- Table 7: Global USA Cashew Market Revenue Million Forecast, by Export Analysis (Value and Volume) 2020 & 2033
- Table 8: Global USA Cashew Market Volume Kiloton Forecast, by Export Analysis (Value and Volume) 2020 & 2033
- Table 9: Global USA Cashew Market Revenue Million Forecast, by Price Trend Analysis 2020 & 2033
- Table 10: Global USA Cashew Market Volume Kiloton Forecast, by Price Trend Analysis 2020 & 2033
- Table 11: Global USA Cashew Market Revenue Million Forecast, by Production Analysis (Volume) 2020 & 2033
- Table 12: Global USA Cashew Market Volume Kiloton Forecast, by Production Analysis (Volume) 2020 & 2033
- Table 13: Global USA Cashew Market Revenue Million Forecast, by Consumption Analysis (Value and Volume) 2020 & 2033
- Table 14: Global USA Cashew Market Volume Kiloton Forecast, by Consumption Analysis (Value and Volume) 2020 & 2033
- Table 15: Global USA Cashew Market Revenue Million Forecast, by Import Analysis (Value and Volume) 2020 & 2033
- Table 16: Global USA Cashew Market Volume Kiloton Forecast, by Import Analysis (Value and Volume) 2020 & 2033
- Table 17: Global USA Cashew Market Revenue Million Forecast, by Export Analysis (Value and Volume) 2020 & 2033
- Table 18: Global USA Cashew Market Volume Kiloton Forecast, by Export Analysis (Value and Volume) 2020 & 2033
- Table 19: Global USA Cashew Market Revenue Million Forecast, by Price Trend Analysis 2020 & 2033
- Table 20: Global USA Cashew Market Volume Kiloton Forecast, by Price Trend Analysis 2020 & 2033
- Table 21: Global USA Cashew Market Revenue Million Forecast, by Region 2020 & 2033
- Table 22: Global USA Cashew Market Volume Kiloton Forecast, by Region 2020 & 2033
- Table 23: Global USA Cashew Market Revenue Million Forecast, by Production Analysis (Volume) 2020 & 2033
- Table 24: Global USA Cashew Market Volume Kiloton Forecast, by Production Analysis (Volume) 2020 & 2033
- Table 25: Global USA Cashew Market Revenue Million Forecast, by Consumption Analysis (Value and Volume) 2020 & 2033
- Table 26: Global USA Cashew Market Volume Kiloton Forecast, by Consumption Analysis (Value and Volume) 2020 & 2033
- Table 27: Global USA Cashew Market Revenue Million Forecast, by Import Analysis (Value and Volume) 2020 & 2033
- Table 28: Global USA Cashew Market Volume Kiloton Forecast, by Import Analysis (Value and Volume) 2020 & 2033
- Table 29: Global USA Cashew Market Revenue Million Forecast, by Export Analysis (Value and Volume) 2020 & 2033
- Table 30: Global USA Cashew Market Volume Kiloton Forecast, by Export Analysis (Value and Volume) 2020 & 2033
- Table 31: Global USA Cashew Market Revenue Million Forecast, by Price Trend Analysis 2020 & 2033
- Table 32: Global USA Cashew Market Volume Kiloton Forecast, by Price Trend Analysis 2020 & 2033
- Table 33: Global USA Cashew Market Revenue Million Forecast, by Production Analysis (Volume) 2020 & 2033
- Table 34: Global USA Cashew Market Volume Kiloton Forecast, by Production Analysis (Volume) 2020 & 2033
- Table 35: Global USA Cashew Market Revenue Million Forecast, by Consumption Analysis (Value and Volume) 2020 & 2033
- Table 36: Global USA Cashew Market Volume Kiloton Forecast, by Consumption Analysis (Value and Volume) 2020 & 2033
- Table 37: Global USA Cashew Market Revenue Million Forecast, by Import Analysis (Value and Volume) 2020 & 2033
- Table 38: Global USA Cashew Market Volume Kiloton Forecast, by Import Analysis (Value and Volume) 2020 & 2033
- Table 39: Global USA Cashew Market Revenue Million Forecast, by Export Analysis (Value and Volume) 2020 & 2033
- Table 40: Global USA Cashew Market Volume Kiloton Forecast, by Export Analysis (Value and Volume) 2020 & 2033
- Table 41: Global USA Cashew Market Revenue Million Forecast, by Price Trend Analysis 2020 & 2033
- Table 42: Global USA Cashew Market Volume Kiloton Forecast, by Price Trend Analysis 2020 & 2033
- Table 43: Global USA Cashew Market Revenue Million Forecast, by Country 2020 & 2033
- Table 44: Global USA Cashew Market Volume Kiloton Forecast, by Country 2020 & 2033
- Table 45: United States USA Cashew Market Revenue (Million) Forecast, by Application 2020 & 2033
- Table 46: United States USA Cashew Market Volume (Kiloton) Forecast, by Application 2020 & 2033
- Table 47: Canada USA Cashew Market Revenue (Million) Forecast, by Application 2020 & 2033
- Table 48: Canada USA Cashew Market Volume (Kiloton) Forecast, by Application 2020 & 2033
- Table 49: Mexico USA Cashew Market Revenue (Million) Forecast, by Application 2020 & 2033
- Table 50: Mexico USA Cashew Market Volume (Kiloton) Forecast, by Application 2020 & 2033
- Table 51: Global USA Cashew Market Revenue Million Forecast, by Production Analysis (Volume) 2020 & 2033
- Table 52: Global USA Cashew Market Volume Kiloton Forecast, by Production Analysis (Volume) 2020 & 2033
- Table 53: Global USA Cashew Market Revenue Million Forecast, by Consumption Analysis (Value and Volume) 2020 & 2033
- Table 54: Global USA Cashew Market Volume Kiloton Forecast, by Consumption Analysis (Value and Volume) 2020 & 2033
- Table 55: Global USA Cashew Market Revenue Million Forecast, by Import Analysis (Value and Volume) 2020 & 2033
- Table 56: Global USA Cashew Market Volume Kiloton Forecast, by Import Analysis (Value and Volume) 2020 & 2033
- Table 57: Global USA Cashew Market Revenue Million Forecast, by Export Analysis (Value and Volume) 2020 & 2033
- Table 58: Global USA Cashew Market Volume Kiloton Forecast, by Export Analysis (Value and Volume) 2020 & 2033
- Table 59: Global USA Cashew Market Revenue Million Forecast, by Price Trend Analysis 2020 & 2033
- Table 60: Global USA Cashew Market Volume Kiloton Forecast, by Price Trend Analysis 2020 & 2033
- Table 61: Global USA Cashew Market Revenue Million Forecast, by Production Analysis (Volume) 2020 & 2033
- Table 62: Global USA Cashew Market Volume Kiloton Forecast, by Production Analysis (Volume) 2020 & 2033
- Table 63: Global USA Cashew Market Revenue Million Forecast, by Consumption Analysis (Value and Volume) 2020 & 2033
- Table 64: Global USA Cashew Market Volume Kiloton Forecast, by Consumption Analysis (Value and Volume) 2020 & 2033
- Table 65: Global USA Cashew Market Revenue Million Forecast, by Import Analysis (Value and Volume) 2020 & 2033
- Table 66: Global USA Cashew Market Volume Kiloton Forecast, by Import Analysis (Value and Volume) 2020 & 2033
- Table 67: Global USA Cashew Market Revenue Million Forecast, by Export Analysis (Value and Volume) 2020 & 2033
- Table 68: Global USA Cashew Market Volume Kiloton Forecast, by Export Analysis (Value and Volume) 2020 & 2033
- Table 69: Global USA Cashew Market Revenue Million Forecast, by Price Trend Analysis 2020 & 2033
- Table 70: Global USA Cashew Market Volume Kiloton Forecast, by Price Trend Analysis 2020 & 2033
- Table 71: Global USA Cashew Market Revenue Million Forecast, by Country 2020 & 2033
- Table 72: Global USA Cashew Market Volume Kiloton Forecast, by Country 2020 & 2033
- Table 73: Brazil USA Cashew Market Revenue (Million) Forecast, by Application 2020 & 2033
- Table 74: Brazil USA Cashew Market Volume (Kiloton) Forecast, by Application 2020 & 2033
- Table 75: Argentina USA Cashew Market Revenue (Million) Forecast, by Application 2020 & 2033
- Table 76: Argentina USA Cashew Market Volume (Kiloton) Forecast, by Application 2020 & 2033
- Table 77: Rest of South America USA Cashew Market Revenue (Million) Forecast, by Application 2020 & 2033
- Table 78: Rest of South America USA Cashew Market Volume (Kiloton) Forecast, by Application 2020 & 2033
- Table 79: Global USA Cashew Market Revenue Million Forecast, by Production Analysis (Volume) 2020 & 2033
- Table 80: Global USA Cashew Market Volume Kiloton Forecast, by Production Analysis (Volume) 2020 & 2033
- Table 81: Global USA Cashew Market Revenue Million Forecast, by Consumption Analysis (Value and Volume) 2020 & 2033
- Table 82: Global USA Cashew Market Volume Kiloton Forecast, by Consumption Analysis (Value and Volume) 2020 & 2033
- Table 83: Global USA Cashew Market Revenue Million Forecast, by Import Analysis (Value and Volume) 2020 & 2033
- Table 84: Global USA Cashew Market Volume Kiloton Forecast, by Import Analysis (Value and Volume) 2020 & 2033
- Table 85: Global USA Cashew Market Revenue Million Forecast, by Export Analysis (Value and Volume) 2020 & 2033
- Table 86: Global USA Cashew Market Volume Kiloton Forecast, by Export Analysis (Value and Volume) 2020 & 2033
- Table 87: Global USA Cashew Market Revenue Million Forecast, by Price Trend Analysis 2020 & 2033
- Table 88: Global USA Cashew Market Volume Kiloton Forecast, by Price Trend Analysis 2020 & 2033
- Table 89: Global USA Cashew Market Revenue Million Forecast, by Production Analysis (Volume) 2020 & 2033
- Table 90: Global USA Cashew Market Volume Kiloton Forecast, by Production Analysis (Volume) 2020 & 2033
- Table 91: Global USA Cashew Market Revenue Million Forecast, by Consumption Analysis (Value and Volume) 2020 & 2033
- Table 92: Global USA Cashew Market Volume Kiloton Forecast, by Consumption Analysis (Value and Volume) 2020 & 2033
- Table 93: Global USA Cashew Market Revenue Million Forecast, by Import Analysis (Value and Volume) 2020 & 2033
- Table 94: Global USA Cashew Market Volume Kiloton Forecast, by Import Analysis (Value and Volume) 2020 & 2033
- Table 95: Global USA Cashew Market Revenue Million Forecast, by Export Analysis (Value and Volume) 2020 & 2033
- Table 96: Global USA Cashew Market Volume Kiloton Forecast, by Export Analysis (Value and Volume) 2020 & 2033
- Table 97: Global USA Cashew Market Revenue Million Forecast, by Price Trend Analysis 2020 & 2033
- Table 98: Global USA Cashew Market Volume Kiloton Forecast, by Price Trend Analysis 2020 & 2033
- Table 99: Global USA Cashew Market Revenue Million Forecast, by Country 2020 & 2033
- Table 100: Global USA Cashew Market Volume Kiloton Forecast, by Country 2020 & 2033
- Table 101: United Kingdom USA Cashew Market Revenue (Million) Forecast, by Application 2020 & 2033
- Table 102: United Kingdom USA Cashew Market Volume (Kiloton) Forecast, by Application 2020 & 2033
- Table 103: Germany USA Cashew Market Revenue (Million) Forecast, by Application 2020 & 2033
- Table 104: Germany USA Cashew Market Volume (Kiloton) Forecast, by Application 2020 & 2033
- Table 105: France USA Cashew Market Revenue (Million) Forecast, by Application 2020 & 2033
- Table 106: France USA Cashew Market Volume (Kiloton) Forecast, by Application 2020 & 2033
- Table 107: Italy USA Cashew Market Revenue (Million) Forecast, by Application 2020 & 2033
- Table 108: Italy USA Cashew Market Volume (Kiloton) Forecast, by Application 2020 & 2033
- Table 109: Spain USA Cashew Market Revenue (Million) Forecast, by Application 2020 & 2033
- Table 110: Spain USA Cashew Market Volume (Kiloton) Forecast, by Application 2020 & 2033
- Table 111: Russia USA Cashew Market Revenue (Million) Forecast, by Application 2020 & 2033
- Table 112: Russia USA Cashew Market Volume (Kiloton) Forecast, by Application 2020 & 2033
- Table 113: Benelux USA Cashew Market Revenue (Million) Forecast, by Application 2020 & 2033
- Table 114: Benelux USA Cashew Market Volume (Kiloton) Forecast, by Application 2020 & 2033
- Table 115: Nordics USA Cashew Market Revenue (Million) Forecast, by Application 2020 & 2033
- Table 116: Nordics USA Cashew Market Volume (Kiloton) Forecast, by Application 2020 & 2033
- Table 117: Rest of Europe USA Cashew Market Revenue (Million) Forecast, by Application 2020 & 2033
- Table 118: Rest of Europe USA Cashew Market Volume (Kiloton) Forecast, by Application 2020 & 2033
- Table 119: Global USA Cashew Market Revenue Million Forecast, by Production Analysis (Volume) 2020 & 2033
- Table 120: Global USA Cashew Market Volume Kiloton Forecast, by Production Analysis (Volume) 2020 & 2033
- Table 121: Global USA Cashew Market Revenue Million Forecast, by Consumption Analysis (Value and Volume) 2020 & 2033
- Table 122: Global USA Cashew Market Volume Kiloton Forecast, by Consumption Analysis (Value and Volume) 2020 & 2033
- Table 123: Global USA Cashew Market Revenue Million Forecast, by Import Analysis (Value and Volume) 2020 & 2033
- Table 124: Global USA Cashew Market Volume Kiloton Forecast, by Import Analysis (Value and Volume) 2020 & 2033
- Table 125: Global USA Cashew Market Revenue Million Forecast, by Export Analysis (Value and Volume) 2020 & 2033
- Table 126: Global USA Cashew Market Volume Kiloton Forecast, by Export Analysis (Value and Volume) 2020 & 2033
- Table 127: Global USA Cashew Market Revenue Million Forecast, by Price Trend Analysis 2020 & 2033
- Table 128: Global USA Cashew Market Volume Kiloton Forecast, by Price Trend Analysis 2020 & 2033
- Table 129: Global USA Cashew Market Revenue Million Forecast, by Production Analysis (Volume) 2020 & 2033
- Table 130: Global USA Cashew Market Volume Kiloton Forecast, by Production Analysis (Volume) 2020 & 2033
- Table 131: Global USA Cashew Market Revenue Million Forecast, by Consumption Analysis (Value and Volume) 2020 & 2033
- Table 132: Global USA Cashew Market Volume Kiloton Forecast, by Consumption Analysis (Value and Volume) 2020 & 2033
- Table 133: Global USA Cashew Market Revenue Million Forecast, by Import Analysis (Value and Volume) 2020 & 2033
- Table 134: Global USA Cashew Market Volume Kiloton Forecast, by Import Analysis (Value and Volume) 2020 & 2033
- Table 135: Global USA Cashew Market Revenue Million Forecast, by Export Analysis (Value and Volume) 2020 & 2033
- Table 136: Global USA Cashew Market Volume Kiloton Forecast, by Export Analysis (Value and Volume) 2020 & 2033
- Table 137: Global USA Cashew Market Revenue Million Forecast, by Price Trend Analysis 2020 & 2033
- Table 138: Global USA Cashew Market Volume Kiloton Forecast, by Price Trend Analysis 2020 & 2033
- Table 139: Global USA Cashew Market Revenue Million Forecast, by Country 2020 & 2033
- Table 140: Global USA Cashew Market Volume Kiloton Forecast, by Country 2020 & 2033
- Table 141: Turkey USA Cashew Market Revenue (Million) Forecast, by Application 2020 & 2033
- Table 142: Turkey USA Cashew Market Volume (Kiloton) Forecast, by Application 2020 & 2033
- Table 143: Israel USA Cashew Market Revenue (Million) Forecast, by Application 2020 & 2033
- Table 144: Israel USA Cashew Market Volume (Kiloton) Forecast, by Application 2020 & 2033
- Table 145: GCC USA Cashew Market Revenue (Million) Forecast, by Application 2020 & 2033
- Table 146: GCC USA Cashew Market Volume (Kiloton) Forecast, by Application 2020 & 2033
- Table 147: North Africa USA Cashew Market Revenue (Million) Forecast, by Application 2020 & 2033
- Table 148: North Africa USA Cashew Market Volume (Kiloton) Forecast, by Application 2020 & 2033
- Table 149: South Africa USA Cashew Market Revenue (Million) Forecast, by Application 2020 & 2033
- Table 150: South Africa USA Cashew Market Volume (Kiloton) Forecast, by Application 2020 & 2033
- Table 151: Rest of Middle East & Africa USA Cashew Market Revenue (Million) Forecast, by Application 2020 & 2033
- Table 152: Rest of Middle East & Africa USA Cashew Market Volume (Kiloton) Forecast, by Application 2020 & 2033
- Table 153: Global USA Cashew Market Revenue Million Forecast, by Production Analysis (Volume) 2020 & 2033
- Table 154: Global USA Cashew Market Volume Kiloton Forecast, by Production Analysis (Volume) 2020 & 2033
- Table 155: Global USA Cashew Market Revenue Million Forecast, by Consumption Analysis (Value and Volume) 2020 & 2033
- Table 156: Global USA Cashew Market Volume Kiloton Forecast, by Consumption Analysis (Value and Volume) 2020 & 2033
- Table 157: Global USA Cashew Market Revenue Million Forecast, by Import Analysis (Value and Volume) 2020 & 2033
- Table 158: Global USA Cashew Market Volume Kiloton Forecast, by Import Analysis (Value and Volume) 2020 & 2033
- Table 159: Global USA Cashew Market Revenue Million Forecast, by Export Analysis (Value and Volume) 2020 & 2033
- Table 160: Global USA Cashew Market Volume Kiloton Forecast, by Export Analysis (Value and Volume) 2020 & 2033
- Table 161: Global USA Cashew Market Revenue Million Forecast, by Price Trend Analysis 2020 & 2033
- Table 162: Global USA Cashew Market Volume Kiloton Forecast, by Price Trend Analysis 2020 & 2033
- Table 163: Global USA Cashew Market Revenue Million Forecast, by Production Analysis (Volume) 2020 & 2033
- Table 164: Global USA Cashew Market Volume Kiloton Forecast, by Production Analysis (Volume) 2020 & 2033
- Table 165: Global USA Cashew Market Revenue Million Forecast, by Consumption Analysis (Value and Volume) 2020 & 2033
- Table 166: Global USA Cashew Market Volume Kiloton Forecast, by Consumption Analysis (Value and Volume) 2020 & 2033
- Table 167: Global USA Cashew Market Revenue Million Forecast, by Import Analysis (Value and Volume) 2020 & 2033
- Table 168: Global USA Cashew Market Volume Kiloton Forecast, by Import Analysis (Value and Volume) 2020 & 2033
- Table 169: Global USA Cashew Market Revenue Million Forecast, by Export Analysis (Value and Volume) 2020 & 2033
- Table 170: Global USA Cashew Market Volume Kiloton Forecast, by Export Analysis (Value and Volume) 2020 & 2033
- Table 171: Global USA Cashew Market Revenue Million Forecast, by Price Trend Analysis 2020 & 2033
- Table 172: Global USA Cashew Market Volume Kiloton Forecast, by Price Trend Analysis 2020 & 2033
- Table 173: Global USA Cashew Market Revenue Million Forecast, by Country 2020 & 2033
- Table 174: Global USA Cashew Market Volume Kiloton Forecast, by Country 2020 & 2033
- Table 175: China USA Cashew Market Revenue (Million) Forecast, by Application 2020 & 2033
- Table 176: China USA Cashew Market Volume (Kiloton) Forecast, by Application 2020 & 2033
- Table 177: India USA Cashew Market Revenue (Million) Forecast, by Application 2020 & 2033
- Table 178: India USA Cashew Market Volume (Kiloton) Forecast, by Application 2020 & 2033
- Table 179: Japan USA Cashew Market Revenue (Million) Forecast, by Application 2020 & 2033
- Table 180: Japan USA Cashew Market Volume (Kiloton) Forecast, by Application 2020 & 2033
- Table 181: South Korea USA Cashew Market Revenue (Million) Forecast, by Application 2020 & 2033
- Table 182: South Korea USA Cashew Market Volume (Kiloton) Forecast, by Application 2020 & 2033
- Table 183: ASEAN USA Cashew Market Revenue (Million) Forecast, by Application 2020 & 2033
- Table 184: ASEAN USA Cashew Market Volume (Kiloton) Forecast, by Application 2020 & 2033
- Table 185: Oceania USA Cashew Market Revenue (Million) Forecast, by Application 2020 & 2033
- Table 186: Oceania USA Cashew Market Volume (Kiloton) Forecast, by Application 2020 & 2033
- Table 187: Rest of Asia Pacific USA Cashew Market Revenue (Million) Forecast, by Application 2020 & 2033
- Table 188: Rest of Asia Pacific USA Cashew Market Volume (Kiloton) Forecast, by Application 2020 & 2033
Frequently Asked Questions
1. What is the projected Compound Annual Growth Rate (CAGR) of the USA Cashew Market?
The projected CAGR is approximately 5.00%.
2. Which companies are prominent players in the USA Cashew Market?
Key companies in the market include Archer Daniels Midland Company , The Kraft Heinz Company, Waterford Foods, Olam International , Diamond Foods .
3. What are the main segments of the USA Cashew Market?
The market segments include Production Analysis (Volume), Consumption Analysis (Value and Volume), Import Analysis (Value and Volume), Export Analysis (Value and Volume), Price Trend Analysis, Production Analysis (Volume), Consumption Analysis (Value and Volume), Import Analysis (Value and Volume), Export Analysis (Value and Volume), Price Trend Analysis.
4. Can you provide details about the market size?
The market size is estimated to be USD XXX Million as of 2022.
5. What are some drivers contributing to market growth?
Rising Consumption of Cashew Nuts in the Country; Favorable Government Initiatives.
6. What are the notable trends driving market growth?
Health Benefits of Cashew Nuts Increases Consumption.
7. Are there any restraints impacting market growth?
Hazardous Climatic Condition Hinders Cashew Production; Stringent Regulations Related to Food Quality Standards.
8. Can you provide examples of recent developments in the market?
February 2023: New Organic Cashew Milk and Blue Cold-Pressed Juice were launched under the brand Clean Juice, which is a USDA-organic certified cold-pressed cashew milk.
9. What pricing options are available for accessing the report?
Pricing options include single-user, multi-user, and enterprise licenses priced at USD 3800, USD 4500, and USD 5800 respectively.
10. Is the market size provided in terms of value or volume?
The market size is provided in terms of value, measured in Million and volume, measured in Kiloton.
11. Are there any specific market keywords associated with the report?
Yes, the market keyword associated with the report is "USA Cashew Market," which aids in identifying and referencing the specific market segment covered.
12. How do I determine which pricing option suits my needs best?
The pricing options vary based on user requirements and access needs. Individual users may opt for single-user licenses, while businesses requiring broader access may choose multi-user or enterprise licenses for cost-effective access to the report.
13. Are there any additional resources or data provided in the USA Cashew Market report?
While the report offers comprehensive insights, it's advisable to review the specific contents or supplementary materials provided to ascertain if additional resources or data are available.
14. How can I stay updated on further developments or reports in the USA Cashew Market?
To stay informed about further developments, trends, and reports in the USA Cashew Market, consider subscribing to industry newsletters, following relevant companies and organizations, or regularly checking reputable industry news sources and publications.
Methodology
Step 1 - Identification of Relevant Samples Size from Population Database


Step 2 - Approaches for Defining Global Market Size (Value, Volume* & Price*)

Note*: In applicable scenarios
Step 3 - Data Sources
Primary Research
- Web Analytics
- Survey Reports
- Research Institute
- Latest Research Reports
- Opinion Leaders
Secondary Research
- Annual Reports
- White Paper
- Latest Press Release
- Industry Association
- Paid Database
- Investor Presentations

Step 4 - Data Triangulation
Involves using different sources of information in order to increase the validity of a study
These sources are likely to be stakeholders in a program - participants, other researchers, program staff, other community members, and so on.
Then we put all data in single framework & apply various statistical tools to find out the dynamic on the market.
During the analysis stage, feedback from the stakeholder groups would be compared to determine areas of agreement as well as areas of divergence