

Key Insights
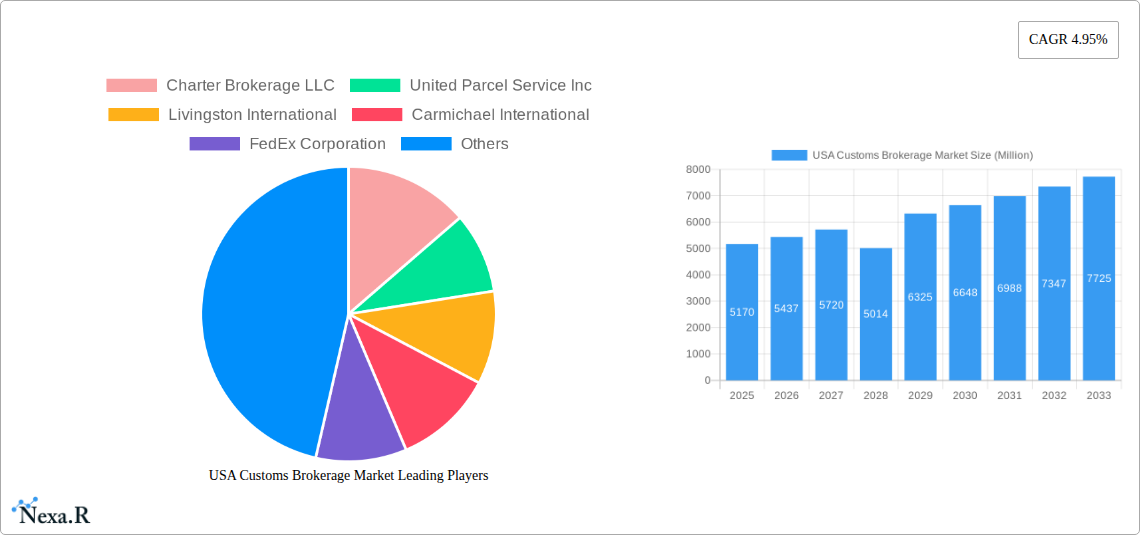
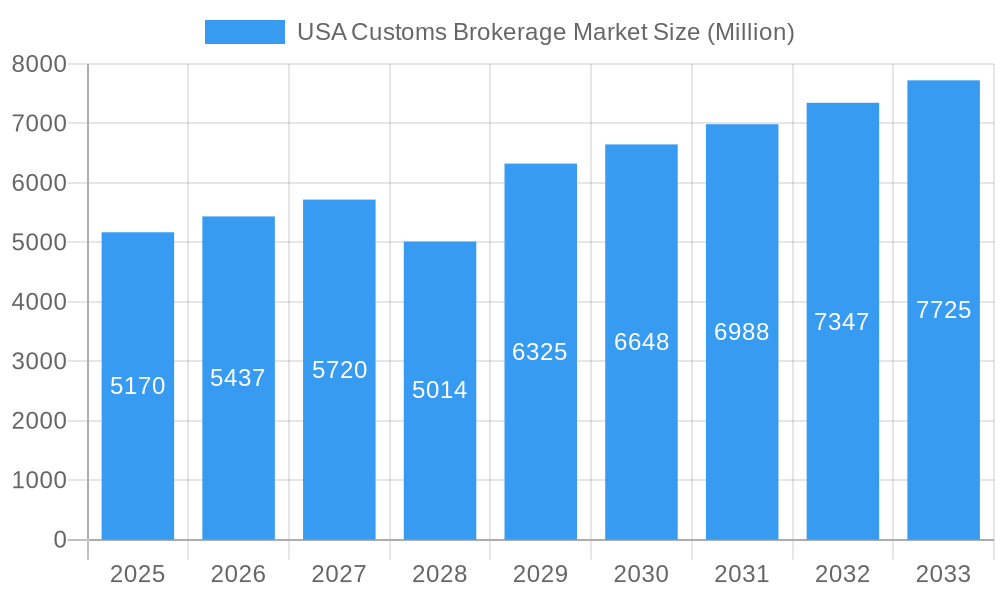
The US Customs Brokerage market, valued at $5.17 billion in 2025, is projected to experience robust growth, exhibiting a Compound Annual Growth Rate (CAGR) of 4.95% from 2025 to 2033. This expansion is fueled by several key factors. The increasing volume of international trade, particularly e-commerce, necessitates efficient customs clearance processes, driving demand for brokerage services. Furthermore, the growing complexity of trade regulations and compliance requirements across various industries, such as manufacturing, healthcare, and technology, creates a need for specialized expertise offered by customs brokers. The market also benefits from the expanding logistics sector and the ongoing shift toward global supply chains, necessitating seamless cross-border movement of goods. While potential restraints like economic downturns and fluctuating exchange rates exist, the overall market outlook remains positive, driven by strong underlying growth trends in global trade and the persistent need for professional customs brokerage expertise.
USA Customs Brokerage Market Market Size (In Billion)
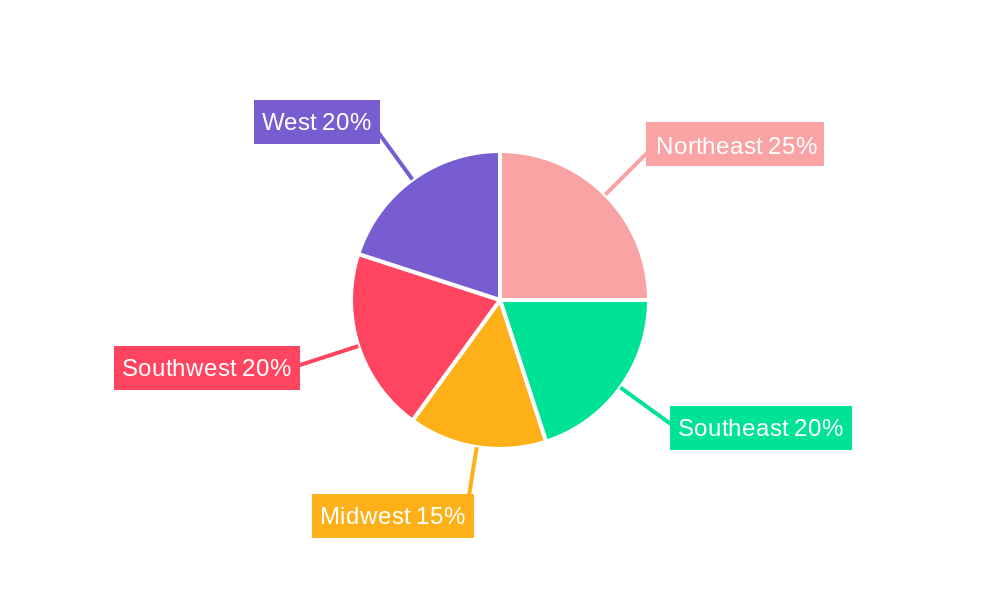
The US market is geographically diverse, with significant activity across all regions – Northeast, Southeast, Midwest, Southwest, and West. However, regions with major ports and high concentrations of import/export businesses will likely experience higher growth. Key players such as FedEx, UPS, DHL, and numerous specialized brokerage firms compete in this market, offering a spectrum of services, from basic customs clearance to comprehensive supply chain management solutions. The market is segmented by mode of transport (sea, air, land), with sea freight likely dominating due to the high volume of goods transported via maritime routes. The competitive landscape is characterized by both large multinational corporations and smaller, specialized brokerage firms catering to niche industries or specific import/export needs. Technological advancements, such as automation and digital platforms for customs clearance, are further shaping market dynamics and driving efficiency improvements.
USA Customs Brokerage Market Company Market Share
USA Customs Brokerage Market: A Comprehensive Report (2019-2033)
This comprehensive report provides an in-depth analysis of the USA Customs Brokerage Market, offering invaluable insights for industry professionals, investors, and strategic planners. The market, valued at $XX million in 2025, is projected to experience significant growth, reaching $XX million by 2033, exhibiting a CAGR of XX% during the forecast period (2025-2033). This report covers the historical period (2019-2024), with 2025 serving as the base year. The analysis encompasses key market segments (By Mode of Transport: Sea, Air, Cross-border Land Transport), dominant players, and emerging trends.
USA Customs Brokerage Market Dynamics & Structure
The USA Customs Brokerage Market is characterized by a moderately concentrated structure, with a few large players and numerous smaller, specialized firms. Market share is distributed among key players such as FedEx Corporation, United Parcel Service Inc, Deutsche Post DHL group, Expeditors International, and Livingston International, alongside numerous smaller, regional brokers. Technological innovation, driven by advancements in software, automation, and data analytics, is reshaping the industry. Stringent regulatory frameworks, including compliance with CBP regulations, pose significant challenges and shape operational practices. The market also faces competition from alternative solutions such as self-service customs clearance platforms and increasing automation by larger companies. End-users span various industries, with significant demand from manufacturing, retail, and e-commerce sectors. M&A activity is robust, as evidenced by recent acquisitions like Kuehne+Nagel's acquisition of Farrow and Rock-It Global’s acquisition of Dell Will.
- Market Concentration: Moderately concentrated, with top 5 players holding approximately XX% market share (2025).
- Technological Innovation: Increasing adoption of AI, blockchain, and automation for enhanced efficiency and compliance.
- Regulatory Framework: Stringent compliance requirements driving demand for specialized services.
- Competitive Substitutes: Emergence of self-service platforms and in-house customs capabilities in larger organizations.
- M&A Activity: Significant consolidation through acquisitions, aiming for expanded service offerings and geographic reach. XX major M&A deals in the past 5 years.
- Innovation Barriers: High initial investment costs for technology upgrades and compliance expertise.
USA Customs Brokerage Market Growth Trends & Insights
The US Customs Brokerage Market has experienced steady growth throughout the historical period (2019-2024), fueled by increasing global trade volumes, the expansion of e-commerce, and the growing complexity of customs regulations. The market size evolution reflects a steady rise in the demand for specialized customs brokerage services. This growth is further enhanced by the growing need for efficient supply chain management in response to heightened global supply chain disruptions and the increasing focus on international trade security. Technology-driven disruptions are streamlining processes and improving transparency across the supply chain, resulting in higher adoption rates among businesses of all sizes. Consumer behavior, influenced by factors like increasing preference for fast delivery and transparent shipping processes, drives demand for efficient and reliable customs brokerage services.
- Market Size (2019): $XX Million
- Market Size (2024): $XX Million
- Market Size (2025): $XX Million (Estimated)
- Market Size (2033): $XX Million (Projected)
- CAGR (2025-2033): XX%
- Market Penetration: XX% in 2025, projected to reach XX% by 2033.
Dominant Regions, Countries, or Segments in USA Customs Brokerage Market
The Sea segment currently dominates the US Customs Brokerage Market, driven by the high volume of imported and exported goods through major seaports. This dominance is further reinforced by the established infrastructure of major seaports, the extensive network of associated logistics providers, and the significant economic activity linked to maritime trade. Key drivers for the sea segment include increasing global trade, strong import/export activity in various key industries, and well-established port infrastructure on both the east and west coasts. The Air segment is also showing robust growth, particularly due to the expansion of e-commerce and the increasing demand for faster delivery times. Cross-border land transport, while smaller in market share compared to sea and air, displays promising growth potential, especially in the context of increasing trade with Canada and Mexico.
- Sea Transport: Holds the largest market share (XX%), driven by high import/export volumes.
- Air Transport: Shows rapid growth (XX% CAGR), fueled by e-commerce and expedited shipping.
- Cross-border Land Transport: Growing steadily (XX% CAGR), driven by trade with neighboring countries.
- Key Drivers: Robust economic activity, growing e-commerce, well-established infrastructure in key regions.
USA Customs Brokerage Market Product Landscape
The product landscape is evolving with advancements in software and automation. Solutions now include integrated platforms that manage compliance, track shipments, and facilitate communication between brokers, clients, and customs authorities. These platforms offer enhanced visibility, streamlined processes, and reduced error rates, presenting a key unique selling proposition. Cutting-edge technologies like AI and machine learning are improving customs clearance prediction accuracy and automating routine tasks.
Key Drivers, Barriers & Challenges in USA Customs Brokerage Market
Key Drivers:
- Escalating Global Trade Volumes: The continuous expansion of international commerce is a primary catalyst, generating substantial and ongoing demand for sophisticated customs brokerage services.
- Explosive E-commerce Penetration: The rapid and sustained growth of the e-commerce sector is a significant driver, creating an urgent need for highly efficient, seamless, and reliable cross-border shipping and customs clearance solutions.
- Pervasive Technological Advancements: The integration of cutting-edge technologies such as automation, AI-driven data analytics, and machine learning is revolutionizing the industry, leading to demonstrably enhanced operational efficiency, reduced human error, and vastly improved compliance rates.
Key Challenges & Restraints:
- Intricate Regulatory Landscape: The ever-changing and highly complex nature of customs regulations, import/export laws, and compliance mandates presents a formidable ongoing challenge for businesses operating within this sector.
- Persistent Supply Chain Vulnerabilities: Global supply chain disruptions, stemming from geopolitical events, natural disasters, or economic fluctuations, continue to impact the predictability and reliability of international shipments, demanding greater agility and robust contingency planning from brokers.
- Intensifying Competitive Pressure: The market is characterized by fierce competition from both well-established industry giants and agile, emerging technology-focused players. This intense rivalry is placing significant downward pressure on pricing and forcing continuous innovation in service offerings and value propositions. This pressure is estimated to reduce profit margins by 15-20% by 2030, necessitating a strategic focus on value-added services and operational efficiencies.
Emerging Opportunities in USA Customs Brokerage Market
- Strategic Specialization in Niche Markets: Deepening expertise and developing tailored service offerings for specific industries (e.g., pharmaceuticals, automotive, aerospace) or product categories presents a significant avenue for differentiation and premium pricing.
- Development and Deployment of Advanced Technology-driven Solutions: Investing in and innovating with proprietary software, AI-powered predictive analytics, blockchain for enhanced transparency, and end-to-end digital platforms can create substantial competitive advantages and attract new business.
- Facilitation of Cross-border E-commerce Ecosystems: Offering comprehensive, end-to-end solutions that specifically address the unique challenges faced by e-commerce businesses engaging in international trade, including simplified customs, duty optimization, and last-mile delivery integration, represents a high-growth opportunity.
Growth Accelerators in the USA Customs Brokerage Market Industry
Sustained long-term growth within the US Customs Brokerage Market will be propelled by a multifaceted strategy encompassing continuous technological innovation, the formation of strategic alliances, and proactive expansion into new and underserved markets. Significant investments in next-generation solutions, including AI-powered automation for intelligent decision-making, blockchain technology for unparalleled transparency and security in transactions, and the streamlining of customs clearance processes through digital integration, will be pivotal in driving substantial efficiency improvements and attracting a broader customer base. Forging strategic partnerships with leading logistics providers, global freight forwarders, and specialized technology companies will enable the delivery of truly integrated and comprehensive supply chain solutions, thereby expanding market reach and enhancing service portfolios. Furthermore, targeted expansion into high-growth emerging markets and specialized industry sectors will serve to diversify revenue streams, mitigate risks, and significantly boost overall market growth.
Key Players Shaping the USA Customs Brokerage Market Market
- Charter Brokerage LLC
- United Parcel Service Inc
- Livingston International
- Carmichael International
- FedEx Corporation
- Deutsche Post DHL group
- Trans American Customhouse Brokers Inc
- GHY International
- Flexport Inc
- Purolator International
- Samuel Shapiro & Company Inc
- Scarbrough International Ltd
- Expeditors International
- A N Deringer
- C H Robinson
- CH Powell Company
- 8 Other Companies (Key Information/Overview)
Notable Milestones in USA Customs Brokerage Market Sector
- November 2023: Kuehne+Nagel significantly expanded its cross-border capabilities in North America through the strategic acquisition of Farrow, a prominent Canadian customs broker.
- October 2023: Rock-It Global strengthened its market position and focus on specialized sectors by acquiring Dell Will, a customs broker with a strong presence in the motorsports industry.
- September 2023: UPS announced the integration of enhanced AI capabilities into its customs brokerage division, promising faster processing times and improved compliance for its clients.
- August 2023: A major logistics consortium launched a pilot program utilizing blockchain technology to track and verify customs documentation, aiming to reduce fraud and expedite clearance.
In-Depth USA Customs Brokerage Market Market Outlook
The outlook for the USA Customs Brokerage Market is exceptionally robust, projecting a trajectory of continuous and significant growth underpinned by the dynamic evolution of global trade and the relentless pace of technological advancement. Strategic investments in advanced automation, sophisticated data analytics platforms, and innovative, client-centric solutions will be paramount in creating distinct competitive advantages and unlocking new levels of operational efficiency. A continued emphasis on streamlining import/export processes, enhancing regulatory compliance through proactive measures, and delivering highly customized services tailored to the specific needs and complexities of diverse industry sectors will remain critical success factors. The market is anticipated to witness ongoing consolidation, driven by strategic mergers and acquisitions, which will further shape and refine the competitive landscape. The proactive exploration and penetration of niche market segments, coupled with the strategic leveraging of emerging technologies, present substantial and exciting growth potential for forward-thinking participants in the industry.
USA Customs Brokerage Market Segmentation
-
1. Mode of Transport
- 1.1. Sea
- 1.2. Air
- 1.3. Cross-border Land Transport
USA Customs Brokerage Market Segmentation By Geography
-
1. North America
- 1.1. United States
- 1.2. Canada
- 1.3. Mexico
-
2. South America
- 2.1. Brazil
- 2.2. Argentina
- 2.3. Rest of South America
-
3. Europe
- 3.1. United Kingdom
- 3.2. Germany
- 3.3. France
- 3.4. Italy
- 3.5. Spain
- 3.6. Russia
- 3.7. Benelux
- 3.8. Nordics
- 3.9. Rest of Europe
-
4. Middle East & Africa
- 4.1. Turkey
- 4.2. Israel
- 4.3. GCC
- 4.4. North Africa
- 4.5. South Africa
- 4.6. Rest of Middle East & Africa
-
5. Asia Pacific
- 5.1. China
- 5.2. India
- 5.3. Japan
- 5.4. South Korea
- 5.5. ASEAN
- 5.6. Oceania
- 5.7. Rest of Asia Pacific
USA Customs Brokerage Market Regional Market Share
Geographic Coverage of USA Customs Brokerage Market
USA Customs Brokerage Market REPORT HIGHLIGHTS
| Aspects | Details |
|---|---|
| Study Period | 2020-2034 |
| Base Year | 2025 |
| Estimated Year | 2026 |
| Forecast Period | 2026-2034 |
| Historical Period | 2020-2025 |
| Growth Rate | CAGR of 4.95% from 2020-2034 |
| Segmentation |
|
Table of Contents
- 1. Introduction
- 1.1. Research Scope
- 1.2. Market Segmentation
- 1.3. Research Objective
- 1.4. Definitions and Assumptions
- 2. Executive Summary
- 2.1. Market Snapshot
- 3. Market Dynamics
- 3.1. Market Drivers
- 3.2. Market Restrains
- 3.3. Market Trends
- 3.4. Market Opportunities
- 4. Market Factor Analysis
- 4.1. Porters Five Forces
- 4.1.1. Bargaining Power of Suppliers
- 4.1.2. Bargaining Power of Buyers
- 4.1.3. Threat of New Entrants
- 4.1.4. Threat of Substitutes
- 4.1.5. Competitive Rivalry
- 4.2. PESTEL analysis
- 4.3. BCG Analysis
- 4.3.1. Stars (High Growth, High Market Share)
- 4.3.2. Cash Cows (Low Growth, High Market Share)
- 4.3.3. Question Mark (High Growth, Low Market Share)
- 4.3.4. Dogs (Low Growth, Low Market Share)
- 4.4. Ansoff Matrix Analysis
- 4.5. Supply Chain Analysis
- 4.6. Regulatory Landscape
- 4.7. Current Market Potential and Opportunity Assessment (TAM–SAM–SOM Framework)
- 4.8. NRP Analyst Note
- 4.1. Porters Five Forces
- 5. Market Analysis, Insights and Forecast 2021-2033
- 5.1. Market Analysis, Insights and Forecast - by Mode of Transport
- 5.1.1. Sea
- 5.1.2. Air
- 5.1.3. Cross-border Land Transport
- 5.2. Market Analysis, Insights and Forecast - by Region
- 5.2.1. North America
- 5.2.2. South America
- 5.2.3. Europe
- 5.2.4. Middle East & Africa
- 5.2.5. Asia Pacific
- 5.1. Market Analysis, Insights and Forecast - by Mode of Transport
- 6. Global USA Customs Brokerage Market Analysis, Insights and Forecast, 2021-2033
- 6.1. Market Analysis, Insights and Forecast - by Mode of Transport
- 6.1.1. Sea
- 6.1.2. Air
- 6.1.3. Cross-border Land Transport
- 6.1. Market Analysis, Insights and Forecast - by Mode of Transport
- 7. North America USA Customs Brokerage Market Analysis, Insights and Forecast, 2020-2032
- 7.1. Market Analysis, Insights and Forecast - by Mode of Transport
- 7.1.1. Sea
- 7.1.2. Air
- 7.1.3. Cross-border Land Transport
- 7.1. Market Analysis, Insights and Forecast - by Mode of Transport
- 8. South America USA Customs Brokerage Market Analysis, Insights and Forecast, 2020-2032
- 8.1. Market Analysis, Insights and Forecast - by Mode of Transport
- 8.1.1. Sea
- 8.1.2. Air
- 8.1.3. Cross-border Land Transport
- 8.1. Market Analysis, Insights and Forecast - by Mode of Transport
- 9. Europe USA Customs Brokerage Market Analysis, Insights and Forecast, 2020-2032
- 9.1. Market Analysis, Insights and Forecast - by Mode of Transport
- 9.1.1. Sea
- 9.1.2. Air
- 9.1.3. Cross-border Land Transport
- 9.1. Market Analysis, Insights and Forecast - by Mode of Transport
- 10. Middle East & Africa USA Customs Brokerage Market Analysis, Insights and Forecast, 2020-2032
- 10.1. Market Analysis, Insights and Forecast - by Mode of Transport
- 10.1.1. Sea
- 10.1.2. Air
- 10.1.3. Cross-border Land Transport
- 10.1. Market Analysis, Insights and Forecast - by Mode of Transport
- 11. Asia Pacific USA Customs Brokerage Market Analysis, Insights and Forecast, 2020-2032
- 11.1. Market Analysis, Insights and Forecast - by Mode of Transport
- 11.1.1. Sea
- 11.1.2. Air
- 11.1.3. Cross-border Land Transport
- 11.1. Market Analysis, Insights and Forecast - by Mode of Transport
- 12. Competitive Analysis
- 12.1. Company Profiles
- 12.1.1 Charter Brokerage LLC
- 12.1.1.1. Company Overview
- 12.1.1.2. Products
- 12.1.1.3. Company Financials
- 12.1.1.4. SWOT Analysis
- 12.1.2 United Parcel Service Inc
- 12.1.2.1. Company Overview
- 12.1.2.2. Products
- 12.1.2.3. Company Financials
- 12.1.2.4. SWOT Analysis
- 12.1.3 Livingston International
- 12.1.3.1. Company Overview
- 12.1.3.2. Products
- 12.1.3.3. Company Financials
- 12.1.3.4. SWOT Analysis
- 12.1.4 Carmichael International
- 12.1.4.1. Company Overview
- 12.1.4.2. Products
- 12.1.4.3. Company Financials
- 12.1.4.4. SWOT Analysis
- 12.1.5 FedEx Corporation
- 12.1.5.1. Company Overview
- 12.1.5.2. Products
- 12.1.5.3. Company Financials
- 12.1.5.4. SWOT Analysis
- 12.1.6 Deutsche Post DHL group
- 12.1.6.1. Company Overview
- 12.1.6.2. Products
- 12.1.6.3. Company Financials
- 12.1.6.4. SWOT Analysis
- 12.1.7 Trans American Customhouse Brokers Inc GHY International Flexport Inc Purolator International Samuel Shapiro & Company Inc Scarbrough International Ltd
- 12.1.7.1. Company Overview
- 12.1.7.2. Products
- 12.1.7.3. Company Financials
- 12.1.7.4. SWOT Analysis
- 12.1.8 Expeditors International
- 12.1.8.1. Company Overview
- 12.1.8.2. Products
- 12.1.8.3. Company Financials
- 12.1.8.4. SWOT Analysis
- 12.1.9 A N Deringer
- 12.1.9.1. Company Overview
- 12.1.9.2. Products
- 12.1.9.3. Company Financials
- 12.1.9.4. SWOT Analysis
- 12.1.10 C H Robinson
- 12.1.10.1. Company Overview
- 12.1.10.2. Products
- 12.1.10.3. Company Financials
- 12.1.10.4. SWOT Analysis
- 12.1.11 CH Powell Company**List Not Exhaustive 8 3 Other Companies (Key Information/Overview)
- 12.1.11.1. Company Overview
- 12.1.11.2. Products
- 12.1.11.3. Company Financials
- 12.1.11.4. SWOT Analysis
- 12.1.1 Charter Brokerage LLC
- 12.2. Market Entropy
- 12.2.1 Company's Key Areas Served
- 12.2.2 Recent Developments
- 12.3. Company Market Share Analysis 2025
- 12.3.1 Top 5 Companies Market Share Analysis
- 12.3.2 Top 3 Companies Market Share Analysis
- 12.4. List of Potential Customers
- 13. Research Methodology
List of Figures
- Figure 1: Global USA Customs Brokerage Market Revenue Breakdown (Million, %) by Region 2025 & 2033
- Figure 2: North America USA Customs Brokerage Market Revenue (Million), by Mode of Transport 2025 & 2033
- Figure 3: North America USA Customs Brokerage Market Revenue Share (%), by Mode of Transport 2025 & 2033
- Figure 4: North America USA Customs Brokerage Market Revenue (Million), by Country 2025 & 2033
- Figure 5: North America USA Customs Brokerage Market Revenue Share (%), by Country 2025 & 2033
- Figure 6: South America USA Customs Brokerage Market Revenue (Million), by Mode of Transport 2025 & 2033
- Figure 7: South America USA Customs Brokerage Market Revenue Share (%), by Mode of Transport 2025 & 2033
- Figure 8: South America USA Customs Brokerage Market Revenue (Million), by Country 2025 & 2033
- Figure 9: South America USA Customs Brokerage Market Revenue Share (%), by Country 2025 & 2033
- Figure 10: Europe USA Customs Brokerage Market Revenue (Million), by Mode of Transport 2025 & 2033
- Figure 11: Europe USA Customs Brokerage Market Revenue Share (%), by Mode of Transport 2025 & 2033
- Figure 12: Europe USA Customs Brokerage Market Revenue (Million), by Country 2025 & 2033
- Figure 13: Europe USA Customs Brokerage Market Revenue Share (%), by Country 2025 & 2033
- Figure 14: Middle East & Africa USA Customs Brokerage Market Revenue (Million), by Mode of Transport 2025 & 2033
- Figure 15: Middle East & Africa USA Customs Brokerage Market Revenue Share (%), by Mode of Transport 2025 & 2033
- Figure 16: Middle East & Africa USA Customs Brokerage Market Revenue (Million), by Country 2025 & 2033
- Figure 17: Middle East & Africa USA Customs Brokerage Market Revenue Share (%), by Country 2025 & 2033
- Figure 18: Asia Pacific USA Customs Brokerage Market Revenue (Million), by Mode of Transport 2025 & 2033
- Figure 19: Asia Pacific USA Customs Brokerage Market Revenue Share (%), by Mode of Transport 2025 & 2033
- Figure 20: Asia Pacific USA Customs Brokerage Market Revenue (Million), by Country 2025 & 2033
- Figure 21: Asia Pacific USA Customs Brokerage Market Revenue Share (%), by Country 2025 & 2033
List of Tables
- Table 1: Global USA Customs Brokerage Market Revenue Million Forecast, by Mode of Transport 2020 & 2033
- Table 2: Global USA Customs Brokerage Market Revenue Million Forecast, by Region 2020 & 2033
- Table 3: Global USA Customs Brokerage Market Revenue Million Forecast, by Mode of Transport 2020 & 2033
- Table 4: Global USA Customs Brokerage Market Revenue Million Forecast, by Country 2020 & 2033
- Table 5: United States USA Customs Brokerage Market Revenue (Million) Forecast, by Application 2020 & 2033
- Table 6: Canada USA Customs Brokerage Market Revenue (Million) Forecast, by Application 2020 & 2033
- Table 7: Mexico USA Customs Brokerage Market Revenue (Million) Forecast, by Application 2020 & 2033
- Table 8: Global USA Customs Brokerage Market Revenue Million Forecast, by Mode of Transport 2020 & 2033
- Table 9: Global USA Customs Brokerage Market Revenue Million Forecast, by Country 2020 & 2033
- Table 10: Brazil USA Customs Brokerage Market Revenue (Million) Forecast, by Application 2020 & 2033
- Table 11: Argentina USA Customs Brokerage Market Revenue (Million) Forecast, by Application 2020 & 2033
- Table 12: Rest of South America USA Customs Brokerage Market Revenue (Million) Forecast, by Application 2020 & 2033
- Table 13: Global USA Customs Brokerage Market Revenue Million Forecast, by Mode of Transport 2020 & 2033
- Table 14: Global USA Customs Brokerage Market Revenue Million Forecast, by Country 2020 & 2033
- Table 15: United Kingdom USA Customs Brokerage Market Revenue (Million) Forecast, by Application 2020 & 2033
- Table 16: Germany USA Customs Brokerage Market Revenue (Million) Forecast, by Application 2020 & 2033
- Table 17: France USA Customs Brokerage Market Revenue (Million) Forecast, by Application 2020 & 2033
- Table 18: Italy USA Customs Brokerage Market Revenue (Million) Forecast, by Application 2020 & 2033
- Table 19: Spain USA Customs Brokerage Market Revenue (Million) Forecast, by Application 2020 & 2033
- Table 20: Russia USA Customs Brokerage Market Revenue (Million) Forecast, by Application 2020 & 2033
- Table 21: Benelux USA Customs Brokerage Market Revenue (Million) Forecast, by Application 2020 & 2033
- Table 22: Nordics USA Customs Brokerage Market Revenue (Million) Forecast, by Application 2020 & 2033
- Table 23: Rest of Europe USA Customs Brokerage Market Revenue (Million) Forecast, by Application 2020 & 2033
- Table 24: Global USA Customs Brokerage Market Revenue Million Forecast, by Mode of Transport 2020 & 2033
- Table 25: Global USA Customs Brokerage Market Revenue Million Forecast, by Country 2020 & 2033
- Table 26: Turkey USA Customs Brokerage Market Revenue (Million) Forecast, by Application 2020 & 2033
- Table 27: Israel USA Customs Brokerage Market Revenue (Million) Forecast, by Application 2020 & 2033
- Table 28: GCC USA Customs Brokerage Market Revenue (Million) Forecast, by Application 2020 & 2033
- Table 29: North Africa USA Customs Brokerage Market Revenue (Million) Forecast, by Application 2020 & 2033
- Table 30: South Africa USA Customs Brokerage Market Revenue (Million) Forecast, by Application 2020 & 2033
- Table 31: Rest of Middle East & Africa USA Customs Brokerage Market Revenue (Million) Forecast, by Application 2020 & 2033
- Table 32: Global USA Customs Brokerage Market Revenue Million Forecast, by Mode of Transport 2020 & 2033
- Table 33: Global USA Customs Brokerage Market Revenue Million Forecast, by Country 2020 & 2033
- Table 34: China USA Customs Brokerage Market Revenue (Million) Forecast, by Application 2020 & 2033
- Table 35: India USA Customs Brokerage Market Revenue (Million) Forecast, by Application 2020 & 2033
- Table 36: Japan USA Customs Brokerage Market Revenue (Million) Forecast, by Application 2020 & 2033
- Table 37: South Korea USA Customs Brokerage Market Revenue (Million) Forecast, by Application 2020 & 2033
- Table 38: ASEAN USA Customs Brokerage Market Revenue (Million) Forecast, by Application 2020 & 2033
- Table 39: Oceania USA Customs Brokerage Market Revenue (Million) Forecast, by Application 2020 & 2033
- Table 40: Rest of Asia Pacific USA Customs Brokerage Market Revenue (Million) Forecast, by Application 2020 & 2033
Frequently Asked Questions
1. What is the projected Compound Annual Growth Rate (CAGR) of the USA Customs Brokerage Market?
The projected CAGR is approximately 4.95%.
2. Which companies are prominent players in the USA Customs Brokerage Market?
Key companies in the market include Charter Brokerage LLC, United Parcel Service Inc, Livingston International, Carmichael International, FedEx Corporation, Deutsche Post DHL group, Trans American Customhouse Brokers Inc GHY International Flexport Inc Purolator International Samuel Shapiro & Company Inc Scarbrough International Ltd, Expeditors International, A N Deringer, C H Robinson, CH Powell Company**List Not Exhaustive 8 3 Other Companies (Key Information/Overview).
3. What are the main segments of the USA Customs Brokerage Market?
The market segments include Mode of Transport.
4. Can you provide details about the market size?
The market size is estimated to be USD 5.17 Million as of 2022.
5. What are some drivers contributing to market growth?
Increasing international trade; Advancements in technology.
6. What are the notable trends driving market growth?
Growth in Imports Driving the US Customs Brokerage Market.
7. Are there any restraints impacting market growth?
Geopolitical uncertainities; Changing trade policies.
8. Can you provide examples of recent developments in the market?
November 2023: Kuehne+Nagel completed the acquisition of Farrow, a Canada-based customs broker. This strategic move enhances cross-border capabilities at the US borders with Canada and Mexico.
9. What pricing options are available for accessing the report?
Pricing options include single-user, multi-user, and enterprise licenses priced at USD 3800, USD 4500, and USD 5800 respectively.
10. Is the market size provided in terms of value or volume?
The market size is provided in terms of value, measured in Million.
11. Are there any specific market keywords associated with the report?
Yes, the market keyword associated with the report is "USA Customs Brokerage Market," which aids in identifying and referencing the specific market segment covered.
12. How do I determine which pricing option suits my needs best?
The pricing options vary based on user requirements and access needs. Individual users may opt for single-user licenses, while businesses requiring broader access may choose multi-user or enterprise licenses for cost-effective access to the report.
13. Are there any additional resources or data provided in the USA Customs Brokerage Market report?
While the report offers comprehensive insights, it's advisable to review the specific contents or supplementary materials provided to ascertain if additional resources or data are available.
14. How can I stay updated on further developments or reports in the USA Customs Brokerage Market?
To stay informed about further developments, trends, and reports in the USA Customs Brokerage Market, consider subscribing to industry newsletters, following relevant companies and organizations, or regularly checking reputable industry news sources and publications.
Methodology
Step 1 - Identification of Relevant Samples Size from Population Database


Step 2 - Approaches for Defining Global Market Size (Value, Volume* & Price*)

Note*: In applicable scenarios
Step 3 - Data Sources
Primary Research
- Web Analytics
- Survey Reports
- Research Institute
- Latest Research Reports
- Opinion Leaders
Secondary Research
- Annual Reports
- White Paper
- Latest Press Release
- Industry Association
- Paid Database
- Investor Presentations

Step 4 - Data Triangulation
Involves using different sources of information in order to increase the validity of a study
These sources are likely to be stakeholders in a program - participants, other researchers, program staff, other community members, and so on.
Then we put all data in single framework & apply various statistical tools to find out the dynamic on the market.
During the analysis stage, feedback from the stakeholder groups would be compared to determine areas of agreement as well as areas of divergence