

Key Insights
The global Utility Audit Software market is poised for significant expansion, projecting a market size of $6.3 billion in 2025 and is expected to grow at a robust CAGR of 6.9% throughout the forecast period of 2025-2033. This growth is underpinned by a confluence of escalating regulatory compliance demands, the increasing complexity of utility operations, and the growing need for enhanced efficiency and risk mitigation. As utility companies grapple with stringent environmental regulations, safety standards, and financial reporting requirements, the adoption of specialized audit software becomes not just beneficial but imperative. The drive towards digital transformation within the utility sector further fuels this demand, as organizations seek integrated solutions to streamline audit processes, improve data accuracy, and ensure accountability. The market is also being shaped by the continuous advancement of cloud-based solutions, offering greater scalability, accessibility, and cost-effectiveness compared to traditional installed software.
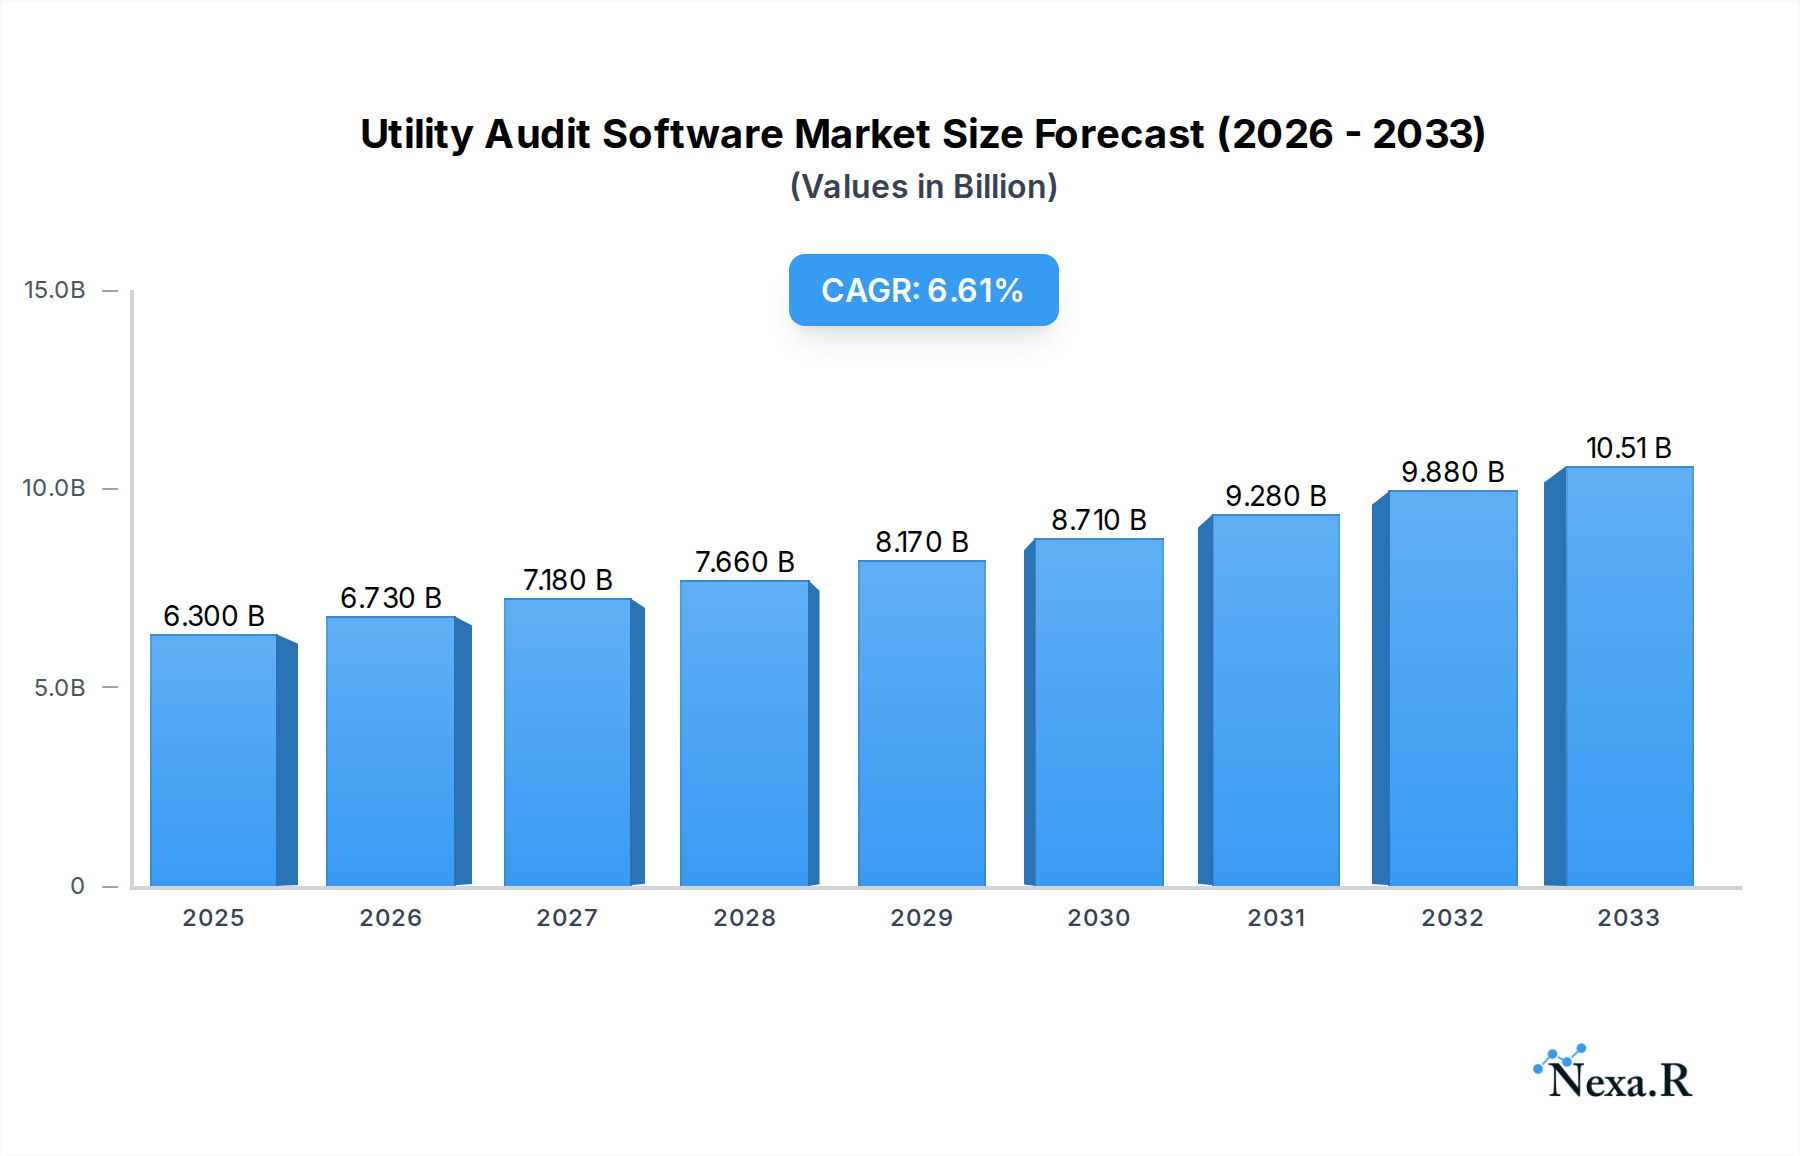
Utility Audit Software Market Size (In Billion)
Key drivers influencing this market trajectory include the growing emphasis on operational efficiency and cost optimization, coupled with the persistent threat of cyber-attacks targeting critical infrastructure, necessitating robust audit trails and security protocols. Furthermore, the expanding scope of audits to encompass sustainability reporting and ESG (Environmental, Social, and Governance) metrics is creating new avenues for market growth. While the market is experiencing strong upward momentum, potential restraints such as the initial implementation costs and the need for specialized training for users might present challenges for smaller organizations. However, the overwhelming benefits of improved compliance, reduced operational risks, and data-driven decision-making are expected to outweigh these concerns, driving widespread adoption across various utility sub-sectors and organizational sizes. The market is segmented by application, catering to small and medium businesses, large enterprises, and other organizations, and by type, with cloud-based and installed-PC solutions.

Utility Audit Software Company Market Share
Utility Audit Software Market Dynamics & Structure
The global utility audit software market exhibits a moderately concentrated structure, with key players like Resolver, Gensuite, and Wolters Kluwer/TeamMate holding significant market shares. Technological innovation is a primary driver, with advancements in AI, machine learning, and IoT integration enabling more sophisticated data analysis and predictive auditing capabilities. Regulatory frameworks, particularly those related to energy efficiency, environmental compliance, and financial reporting, continue to shape demand. Competitive product substitutes include manual auditing processes and broader enterprise resource planning (ERP) systems with limited audit functionalities. End-user demographics span across Small & Medium Businesses, Large Businesses, and Other Organizations, each with distinct needs for cost-efficiency, scalability, and advanced features. Mergers and acquisitions (M&A) trends are notable, with larger entities acquiring niche players to expand their product portfolios and market reach. For instance, the acquisition of smaller compliance software providers by established players aims to consolidate market leadership and enhance service offerings. The ongoing drive for operational efficiency and risk mitigation fuels the adoption of specialized utility audit solutions across various industries.
- Market Concentration: Moderately concentrated, driven by a few key players and a growing number of specialized vendors.
- Technological Innovation Drivers: AI, Machine Learning, IoT integration for predictive analytics and real-time monitoring.
- Regulatory Frameworks: Energy efficiency mandates, environmental compliance standards, financial reporting regulations.
- Competitive Product Substitutes: Manual auditing, general ERP systems.
- End-User Demographics: Small & Medium Business, Large Business, Other Organizations.
- M&A Trends: Strategic acquisitions to expand product suites and market penetration.
Utility Audit Software Growth Trends & Insights
The utility audit software market is poised for robust expansion, driven by increasing regulatory scrutiny, the imperative for cost optimization, and the growing adoption of cloud-based solutions. The global utility audit software market size, estimated at xx billion units in the base year of 2025, is projected to witness a significant Compound Annual Growth Rate (CAGR) during the forecast period of 2025–2033. This growth is underpinned by the shift from reactive cost management to proactive risk mitigation and operational efficiency. Cloud-based solutions are experiencing accelerated adoption due to their scalability, accessibility, and reduced upfront investment, making them particularly attractive for Small & Medium Businesses. Large businesses, on the other hand, are increasingly leveraging advanced analytics and AI-powered features for comprehensive audit trails and predictive maintenance insights. Consumer behavior has shifted towards demanding greater transparency and accountability in utility consumption and management, further propelling the need for effective audit software. Technological disruptions, such as the integration of IoT sensors for real-time data collection and the application of machine learning algorithms for anomaly detection, are enhancing the capabilities of utility audit software, offering more precise and actionable insights. The market penetration of utility audit software is expected to rise considerably as organizations across sectors recognize its value in streamlining operations, ensuring compliance, and optimizing resource allocation. The historical period from 2019–2024 has laid the groundwork for this expansion, characterized by early adoption and increasing awareness of the benefits of automated audit processes. The forecast period will witness a maturation of the market, with a focus on advanced features and integrated solutions.
Dominant Regions, Countries, or Segments in Utility Audit Software
The Cloud-based segment is emerging as the dominant force driving market growth within the utility audit software industry. This dominance is fueled by its inherent advantages in scalability, flexibility, and cost-effectiveness, making it an attractive option for a broad spectrum of organizations, from Small & Medium Businesses to Large Businesses. The ability to access and manage audit data from anywhere, coupled with reduced IT infrastructure overhead, significantly lowers the barrier to entry for many companies. Cloud-based solutions offer seamless integration with other business systems and provide regular updates and maintenance, ensuring users always have access to the latest features and security patches. Furthermore, the increasing reliance on remote work and distributed operations further amplifies the appeal of cloud-based platforms for collaborative auditing processes.
- Cloud-based Dominance: Characterized by high adoption rates due to scalability, accessibility, and cost-efficiency.
- Target Segments: Small & Medium Businesses benefit from lower upfront costs and ease of implementation, while Large Businesses leverage advanced features for comprehensive data analysis and enterprise-wide compliance.
- Key Drivers for Cloud-based Adoption:
- Economic Policies: Government initiatives promoting digital transformation and cloud adoption.
- Infrastructure: The widespread availability of high-speed internet and robust cloud computing infrastructure.
- Technological Advancements: Continuous innovation in cloud security and data analytics capabilities.
- Flexibility and Scalability: Ability to adapt to changing business needs and data volumes.
- Remote Work Trends: Facilitates distributed auditing teams and seamless collaboration.
- Market Share Potential: The cloud-based segment is projected to capture a substantial market share, outpacing the installed-PC segment in terms of growth and overall market penetration.
- Growth Potential: The ongoing digital transformation initiatives globally, coupled with an increasing focus on operational efficiency and compliance, will continue to accelerate the adoption of cloud-based utility audit software. The segment is expected to witness consistent double-digit growth throughout the forecast period.
Utility Audit Software Product Landscape
The utility audit software landscape is characterized by continuous innovation, with solutions offering enhanced functionalities like AI-driven anomaly detection, predictive analytics for resource consumption, and automated compliance reporting. Applications range from optimizing energy usage and reducing operational costs to ensuring adherence to environmental regulations and financial transparency. Performance metrics are increasingly focused on time savings, cost reductions achieved through identified inefficiencies, and the demonstrable improvement in audit accuracy and compliance rates. Unique selling propositions often revolve around customizable workflows, seamless integration capabilities with existing enterprise systems, and advanced data visualization tools that provide actionable insights to stakeholders. Technological advancements are moving towards real-time data processing and predictive modeling, enabling proactive rather than reactive audit approaches.
Key Drivers, Barriers & Challenges in Utility Audit Software
Key Drivers: The primary forces propelling the utility audit software market are the escalating demand for operational efficiency, stringent regulatory compliance requirements across industries, and the growing need for cost optimization in utility consumption. Technological advancements, particularly in data analytics and automation, are making these solutions more powerful and accessible. Furthermore, the increasing awareness of environmental sustainability and corporate social responsibility is driving organizations to adopt robust auditing mechanisms. The transition to cloud-based solutions is also a significant accelerator, offering greater flexibility and scalability.
Barriers & Challenges: Despite strong growth, the market faces challenges such as the initial cost of implementation, especially for complex integrated solutions, and the need for specialized IT expertise. Data security concerns and the risk of data breaches can deter some organizations from adopting cloud-based platforms. Resistance to change and the need for extensive employee training on new software can also pose significant hurdles. Competitive pressures from existing ERP systems with audit modules and the availability of open-source alternatives present a complex market dynamic. Supply chain issues related to hardware components for on-premise solutions, though less prevalent with cloud adoption, can still impact some implementations. Regulatory changes can also create a dynamic environment requiring continuous software updates and adaptation, adding to the operational burden.
Emerging Opportunities in Utility Audit Software
Emerging opportunities in the utility audit software sector lie in the integration of blockchain technology for enhanced data integrity and traceability in energy management. The growing focus on renewable energy sources and smart grids presents a significant avenue for specialized audit software that can monitor and analyze complex energy flows. Furthermore, the increasing demand for ESG (Environmental, Social, and Governance) reporting is creating a need for audit solutions that can seamlessly track and report on sustainability metrics. Untapped markets in developing economies, where the adoption of formal auditing practices is still nascent, offer substantial growth potential. Innovative applications in predictive maintenance for utility infrastructure and the development of AI-powered chatbots for auditor assistance are also promising areas.
Growth Accelerators in the Utility Audit Software Industry
Growth accelerators in the utility audit software industry are primarily driven by transformative technological breakthroughs, such as advancements in AI and machine learning that enable more sophisticated predictive analytics and anomaly detection. Strategic partnerships between software vendors and utility providers, as well as with consulting firms specializing in compliance and sustainability, are expanding market reach and offering integrated solutions. Market expansion strategies targeting specific industry verticals, like manufacturing, healthcare, and retail, where utility costs are a significant operational expense, are also fueling growth. The increasing global emphasis on sustainability and carbon footprint reduction is a powerful catalyst, driving demand for software that can precisely measure, monitor, and report on energy consumption and environmental impact.
Key Players Shaping the Utility Audit Software Market
- Resolver
- Gensuite
- Wolters Kluwer/TeamMate
- Plan Brothers
- Optial
- Perillon Software
- ProcessGene
- Oversight Systems
- MasterControl
- ComplianceBridge
- Tronixss
- Reflexis Systems
- SAI Global
- Isolocity
- Insight Lean Solutions
- AuditFile
Notable Milestones in Utility Audit Software Sector
- 2019: Increased adoption of cloud-based utility audit software solutions, enhancing accessibility and scalability for SMBs.
- 2020: Rise in AI and machine learning integration, enabling predictive analytics for energy consumption and anomaly detection.
- 2021: Focus on ESG reporting capabilities, with software vendors incorporating features for environmental and social impact tracking.
- 2022: Significant M&A activity as larger players acquire niche providers to expand product portfolios and market reach.
- 2023: Enhanced integration with IoT devices, facilitating real-time data collection and more accurate audits.
- 2024: Growing demand for mobile audit capabilities, allowing for field audits and data access on-the-go.
In-Depth Utility Audit Software Market Outlook
The in-depth utility audit software market outlook is exceptionally positive, driven by the sustained emphasis on operational efficiency, stringent regulatory landscapes, and the pervasive push towards sustainability. Growth accelerators, including the continued innovation in AI-driven analytics, the strategic expansion into emerging markets, and the seamless integration of cloud technologies, will propel market expansion. The increasing adoption of utility audit software across diverse sectors, from small businesses seeking cost control to large enterprises prioritizing compliance and ESG mandates, indicates a robust and expanding addressable market. Future opportunities lie in the development of highly specialized solutions for niche industries and the integration of advanced technologies like blockchain for enhanced data security and transparency. The market is poised for significant growth, driven by the indispensable role of utility audit software in modern business operations.
Utility Audit Software Segmentation
-
1. Application
- 1.1. Small & Medium Business
- 1.2. Large Business
- 1.3. Other Organizations
-
2. Type
- 2.1. Cloud-based
- 2.2. Installed-PC
Utility Audit Software Segmentation By Geography
-
1. North America
- 1.1. United States
- 1.2. Canada
- 1.3. Mexico
-
2. South America
- 2.1. Brazil
- 2.2. Argentina
- 2.3. Rest of South America
-
3. Europe
- 3.1. United Kingdom
- 3.2. Germany
- 3.3. France
- 3.4. Italy
- 3.5. Spain
- 3.6. Russia
- 3.7. Benelux
- 3.8. Nordics
- 3.9. Rest of Europe
-
4. Middle East & Africa
- 4.1. Turkey
- 4.2. Israel
- 4.3. GCC
- 4.4. North Africa
- 4.5. South Africa
- 4.6. Rest of Middle East & Africa
-
5. Asia Pacific
- 5.1. China
- 5.2. India
- 5.3. Japan
- 5.4. South Korea
- 5.5. ASEAN
- 5.6. Oceania
- 5.7. Rest of Asia Pacific
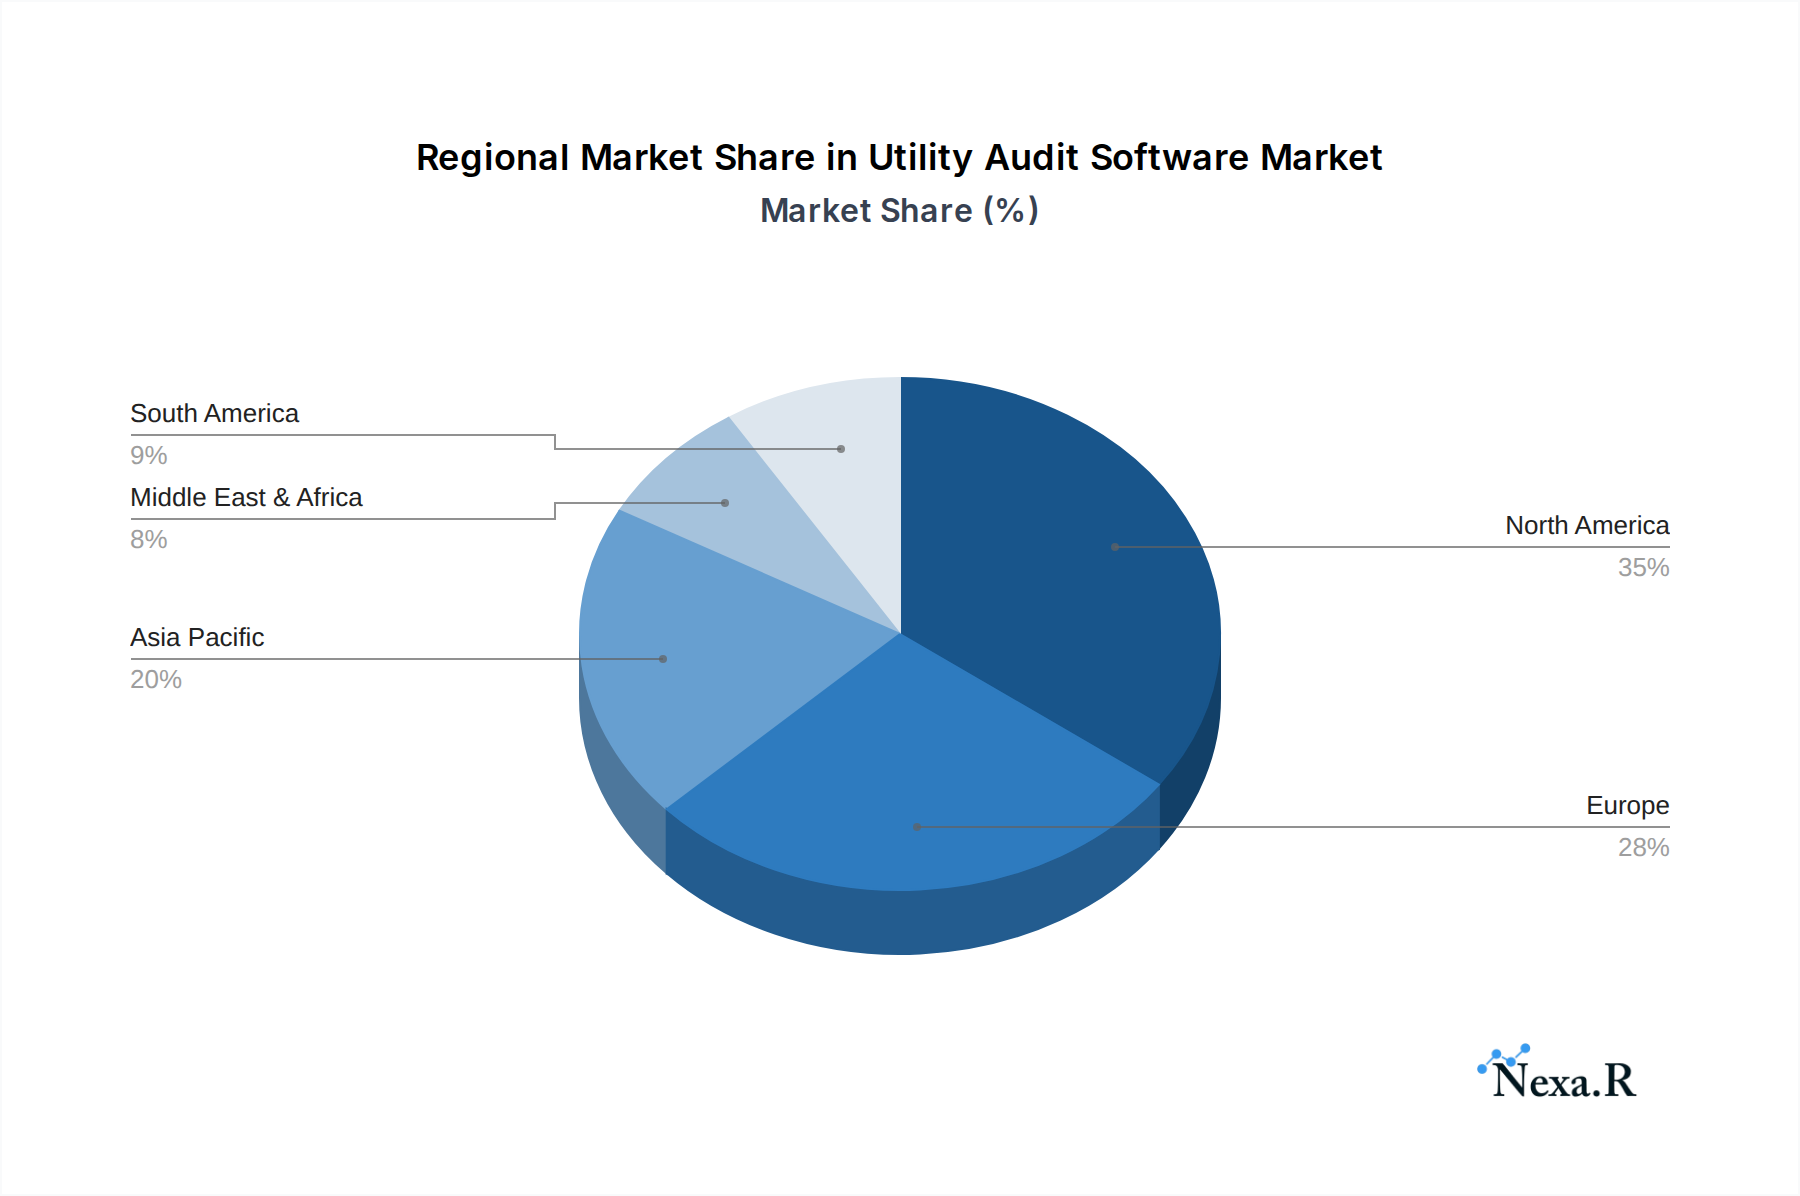
Utility Audit Software Regional Market Share
Geographic Coverage of Utility Audit Software
Utility Audit Software REPORT HIGHLIGHTS
| Aspects | Details |
|---|---|
| Study Period | 2020-2034 |
| Base Year | 2025 |
| Estimated Year | 2026 |
| Forecast Period | 2026-2034 |
| Historical Period | 2020-2025 |
| Growth Rate | CAGR of 6.9% from 2020-2034 |
| Segmentation |
|
Table of Contents
- 1. Introduction
- 1.1. Research Scope
- 1.2. Market Segmentation
- 1.3. Research Objective
- 1.4. Definitions and Assumptions
- 2. Executive Summary
- 2.1. Market Snapshot
- 3. Market Dynamics
- 3.1. Market Drivers
- 3.2. Market Restrains
- 3.3. Market Trends
- 3.4. Market Opportunities
- 4. Market Factor Analysis
- 4.1. Porters Five Forces
- 4.1.1. Bargaining Power of Suppliers
- 4.1.2. Bargaining Power of Buyers
- 4.1.3. Threat of New Entrants
- 4.1.4. Threat of Substitutes
- 4.1.5. Competitive Rivalry
- 4.2. PESTEL analysis
- 4.3. BCG Analysis
- 4.3.1. Stars (High Growth, High Market Share)
- 4.3.2. Cash Cows (Low Growth, High Market Share)
- 4.3.3. Question Mark (High Growth, Low Market Share)
- 4.3.4. Dogs (Low Growth, Low Market Share)
- 4.4. Ansoff Matrix Analysis
- 4.5. Supply Chain Analysis
- 4.6. Regulatory Landscape
- 4.7. Current Market Potential and Opportunity Assessment (TAM–SAM–SOM Framework)
- 4.8. NRP Analyst Note
- 4.1. Porters Five Forces
- 5. Market Analysis, Insights and Forecast 2021-2033
- 5.1. Market Analysis, Insights and Forecast - by Application
- 5.1.1. Small & Medium Business
- 5.1.2. Large Business
- 5.1.3. Other Organizations
- 5.2. Market Analysis, Insights and Forecast - by Type
- 5.2.1. Cloud-based
- 5.2.2. Installed-PC
- 5.3. Market Analysis, Insights and Forecast - by Region
- 5.3.1. North America
- 5.3.2. South America
- 5.3.3. Europe
- 5.3.4. Middle East & Africa
- 5.3.5. Asia Pacific
- 5.1. Market Analysis, Insights and Forecast - by Application
- 6. Global Utility Audit Software Analysis, Insights and Forecast, 2021-2033
- 6.1. Market Analysis, Insights and Forecast - by Application
- 6.1.1. Small & Medium Business
- 6.1.2. Large Business
- 6.1.3. Other Organizations
- 6.2. Market Analysis, Insights and Forecast - by Type
- 6.2.1. Cloud-based
- 6.2.2. Installed-PC
- 6.1. Market Analysis, Insights and Forecast - by Application
- 7. North America Utility Audit Software Analysis, Insights and Forecast, 2020-2032
- 7.1. Market Analysis, Insights and Forecast - by Application
- 7.1.1. Small & Medium Business
- 7.1.2. Large Business
- 7.1.3. Other Organizations
- 7.2. Market Analysis, Insights and Forecast - by Type
- 7.2.1. Cloud-based
- 7.2.2. Installed-PC
- 7.1. Market Analysis, Insights and Forecast - by Application
- 8. South America Utility Audit Software Analysis, Insights and Forecast, 2020-2032
- 8.1. Market Analysis, Insights and Forecast - by Application
- 8.1.1. Small & Medium Business
- 8.1.2. Large Business
- 8.1.3. Other Organizations
- 8.2. Market Analysis, Insights and Forecast - by Type
- 8.2.1. Cloud-based
- 8.2.2. Installed-PC
- 8.1. Market Analysis, Insights and Forecast - by Application
- 9. Europe Utility Audit Software Analysis, Insights and Forecast, 2020-2032
- 9.1. Market Analysis, Insights and Forecast - by Application
- 9.1.1. Small & Medium Business
- 9.1.2. Large Business
- 9.1.3. Other Organizations
- 9.2. Market Analysis, Insights and Forecast - by Type
- 9.2.1. Cloud-based
- 9.2.2. Installed-PC
- 9.1. Market Analysis, Insights and Forecast - by Application
- 10. Middle East & Africa Utility Audit Software Analysis, Insights and Forecast, 2020-2032
- 10.1. Market Analysis, Insights and Forecast - by Application
- 10.1.1. Small & Medium Business
- 10.1.2. Large Business
- 10.1.3. Other Organizations
- 10.2. Market Analysis, Insights and Forecast - by Type
- 10.2.1. Cloud-based
- 10.2.2. Installed-PC
- 10.1. Market Analysis, Insights and Forecast - by Application
- 11. Asia Pacific Utility Audit Software Analysis, Insights and Forecast, 2020-2032
- 11.1. Market Analysis, Insights and Forecast - by Application
- 11.1.1. Small & Medium Business
- 11.1.2. Large Business
- 11.1.3. Other Organizations
- 11.2. Market Analysis, Insights and Forecast - by Type
- 11.2.1. Cloud-based
- 11.2.2. Installed-PC
- 11.1. Market Analysis, Insights and Forecast - by Application
- 12. Competitive Analysis
- 12.1. Company Profiles
- 12.1.1 Resolver
- 12.1.1.1. Company Overview
- 12.1.1.2. Products
- 12.1.1.3. Company Financials
- 12.1.1.4. SWOT Analysis
- 12.1.2 Gensuite
- 12.1.2.1. Company Overview
- 12.1.2.2. Products
- 12.1.2.3. Company Financials
- 12.1.2.4. SWOT Analysis
- 12.1.3 Wolters Kluwer/TeamMate
- 12.1.3.1. Company Overview
- 12.1.3.2. Products
- 12.1.3.3. Company Financials
- 12.1.3.4. SWOT Analysis
- 12.1.4 Plan Brothers
- 12.1.4.1. Company Overview
- 12.1.4.2. Products
- 12.1.4.3. Company Financials
- 12.1.4.4. SWOT Analysis
- 12.1.5 Optial
- 12.1.5.1. Company Overview
- 12.1.5.2. Products
- 12.1.5.3. Company Financials
- 12.1.5.4. SWOT Analysis
- 12.1.6 Perillon Software
- 12.1.6.1. Company Overview
- 12.1.6.2. Products
- 12.1.6.3. Company Financials
- 12.1.6.4. SWOT Analysis
- 12.1.7 ProcessGene
- 12.1.7.1. Company Overview
- 12.1.7.2. Products
- 12.1.7.3. Company Financials
- 12.1.7.4. SWOT Analysis
- 12.1.8 Oversight Systems
- 12.1.8.1. Company Overview
- 12.1.8.2. Products
- 12.1.8.3. Company Financials
- 12.1.8.4. SWOT Analysis
- 12.1.9 MasterControl
- 12.1.9.1. Company Overview
- 12.1.9.2. Products
- 12.1.9.3. Company Financials
- 12.1.9.4. SWOT Analysis
- 12.1.10 ComplianceBridge
- 12.1.10.1. Company Overview
- 12.1.10.2. Products
- 12.1.10.3. Company Financials
- 12.1.10.4. SWOT Analysis
- 12.1.11 Tronixss
- 12.1.11.1. Company Overview
- 12.1.11.2. Products
- 12.1.11.3. Company Financials
- 12.1.11.4. SWOT Analysis
- 12.1.12 Reflexis Systems
- 12.1.12.1. Company Overview
- 12.1.12.2. Products
- 12.1.12.3. Company Financials
- 12.1.12.4. SWOT Analysis
- 12.1.13 SAI Global
- 12.1.13.1. Company Overview
- 12.1.13.2. Products
- 12.1.13.3. Company Financials
- 12.1.13.4. SWOT Analysis
- 12.1.14 Isolocity
- 12.1.14.1. Company Overview
- 12.1.14.2. Products
- 12.1.14.3. Company Financials
- 12.1.14.4. SWOT Analysis
- 12.1.15 Insight Lean Solutions
- 12.1.15.1. Company Overview
- 12.1.15.2. Products
- 12.1.15.3. Company Financials
- 12.1.15.4. SWOT Analysis
- 12.1.16 AuditFile
- 12.1.16.1. Company Overview
- 12.1.16.2. Products
- 12.1.16.3. Company Financials
- 12.1.16.4. SWOT Analysis
- 12.1.1 Resolver
- 12.2. Market Entropy
- 12.2.1 Company's Key Areas Served
- 12.2.2 Recent Developments
- 12.3. Company Market Share Analysis 2025
- 12.3.1 Top 5 Companies Market Share Analysis
- 12.3.2 Top 3 Companies Market Share Analysis
- 12.4. List of Potential Customers
- 13. Research Methodology
List of Figures
- Figure 1: Global Utility Audit Software Revenue Breakdown (undefined, %) by Region 2025 & 2033
- Figure 2: North America Utility Audit Software Revenue (undefined), by Application 2025 & 2033
- Figure 3: North America Utility Audit Software Revenue Share (%), by Application 2025 & 2033
- Figure 4: North America Utility Audit Software Revenue (undefined), by Type 2025 & 2033
- Figure 5: North America Utility Audit Software Revenue Share (%), by Type 2025 & 2033
- Figure 6: North America Utility Audit Software Revenue (undefined), by Country 2025 & 2033
- Figure 7: North America Utility Audit Software Revenue Share (%), by Country 2025 & 2033
- Figure 8: South America Utility Audit Software Revenue (undefined), by Application 2025 & 2033
- Figure 9: South America Utility Audit Software Revenue Share (%), by Application 2025 & 2033
- Figure 10: South America Utility Audit Software Revenue (undefined), by Type 2025 & 2033
- Figure 11: South America Utility Audit Software Revenue Share (%), by Type 2025 & 2033
- Figure 12: South America Utility Audit Software Revenue (undefined), by Country 2025 & 2033
- Figure 13: South America Utility Audit Software Revenue Share (%), by Country 2025 & 2033
- Figure 14: Europe Utility Audit Software Revenue (undefined), by Application 2025 & 2033
- Figure 15: Europe Utility Audit Software Revenue Share (%), by Application 2025 & 2033
- Figure 16: Europe Utility Audit Software Revenue (undefined), by Type 2025 & 2033
- Figure 17: Europe Utility Audit Software Revenue Share (%), by Type 2025 & 2033
- Figure 18: Europe Utility Audit Software Revenue (undefined), by Country 2025 & 2033
- Figure 19: Europe Utility Audit Software Revenue Share (%), by Country 2025 & 2033
- Figure 20: Middle East & Africa Utility Audit Software Revenue (undefined), by Application 2025 & 2033
- Figure 21: Middle East & Africa Utility Audit Software Revenue Share (%), by Application 2025 & 2033
- Figure 22: Middle East & Africa Utility Audit Software Revenue (undefined), by Type 2025 & 2033
- Figure 23: Middle East & Africa Utility Audit Software Revenue Share (%), by Type 2025 & 2033
- Figure 24: Middle East & Africa Utility Audit Software Revenue (undefined), by Country 2025 & 2033
- Figure 25: Middle East & Africa Utility Audit Software Revenue Share (%), by Country 2025 & 2033
- Figure 26: Asia Pacific Utility Audit Software Revenue (undefined), by Application 2025 & 2033
- Figure 27: Asia Pacific Utility Audit Software Revenue Share (%), by Application 2025 & 2033
- Figure 28: Asia Pacific Utility Audit Software Revenue (undefined), by Type 2025 & 2033
- Figure 29: Asia Pacific Utility Audit Software Revenue Share (%), by Type 2025 & 2033
- Figure 30: Asia Pacific Utility Audit Software Revenue (undefined), by Country 2025 & 2033
- Figure 31: Asia Pacific Utility Audit Software Revenue Share (%), by Country 2025 & 2033
List of Tables
- Table 1: Global Utility Audit Software Revenue undefined Forecast, by Application 2020 & 2033
- Table 2: Global Utility Audit Software Revenue undefined Forecast, by Type 2020 & 2033
- Table 3: Global Utility Audit Software Revenue undefined Forecast, by Region 2020 & 2033
- Table 4: Global Utility Audit Software Revenue undefined Forecast, by Application 2020 & 2033
- Table 5: Global Utility Audit Software Revenue undefined Forecast, by Type 2020 & 2033
- Table 6: Global Utility Audit Software Revenue undefined Forecast, by Country 2020 & 2033
- Table 7: United States Utility Audit Software Revenue (undefined) Forecast, by Application 2020 & 2033
- Table 8: Canada Utility Audit Software Revenue (undefined) Forecast, by Application 2020 & 2033
- Table 9: Mexico Utility Audit Software Revenue (undefined) Forecast, by Application 2020 & 2033
- Table 10: Global Utility Audit Software Revenue undefined Forecast, by Application 2020 & 2033
- Table 11: Global Utility Audit Software Revenue undefined Forecast, by Type 2020 & 2033
- Table 12: Global Utility Audit Software Revenue undefined Forecast, by Country 2020 & 2033
- Table 13: Brazil Utility Audit Software Revenue (undefined) Forecast, by Application 2020 & 2033
- Table 14: Argentina Utility Audit Software Revenue (undefined) Forecast, by Application 2020 & 2033
- Table 15: Rest of South America Utility Audit Software Revenue (undefined) Forecast, by Application 2020 & 2033
- Table 16: Global Utility Audit Software Revenue undefined Forecast, by Application 2020 & 2033
- Table 17: Global Utility Audit Software Revenue undefined Forecast, by Type 2020 & 2033
- Table 18: Global Utility Audit Software Revenue undefined Forecast, by Country 2020 & 2033
- Table 19: United Kingdom Utility Audit Software Revenue (undefined) Forecast, by Application 2020 & 2033
- Table 20: Germany Utility Audit Software Revenue (undefined) Forecast, by Application 2020 & 2033
- Table 21: France Utility Audit Software Revenue (undefined) Forecast, by Application 2020 & 2033
- Table 22: Italy Utility Audit Software Revenue (undefined) Forecast, by Application 2020 & 2033
- Table 23: Spain Utility Audit Software Revenue (undefined) Forecast, by Application 2020 & 2033
- Table 24: Russia Utility Audit Software Revenue (undefined) Forecast, by Application 2020 & 2033
- Table 25: Benelux Utility Audit Software Revenue (undefined) Forecast, by Application 2020 & 2033
- Table 26: Nordics Utility Audit Software Revenue (undefined) Forecast, by Application 2020 & 2033
- Table 27: Rest of Europe Utility Audit Software Revenue (undefined) Forecast, by Application 2020 & 2033
- Table 28: Global Utility Audit Software Revenue undefined Forecast, by Application 2020 & 2033
- Table 29: Global Utility Audit Software Revenue undefined Forecast, by Type 2020 & 2033
- Table 30: Global Utility Audit Software Revenue undefined Forecast, by Country 2020 & 2033
- Table 31: Turkey Utility Audit Software Revenue (undefined) Forecast, by Application 2020 & 2033
- Table 32: Israel Utility Audit Software Revenue (undefined) Forecast, by Application 2020 & 2033
- Table 33: GCC Utility Audit Software Revenue (undefined) Forecast, by Application 2020 & 2033
- Table 34: North Africa Utility Audit Software Revenue (undefined) Forecast, by Application 2020 & 2033
- Table 35: South Africa Utility Audit Software Revenue (undefined) Forecast, by Application 2020 & 2033
- Table 36: Rest of Middle East & Africa Utility Audit Software Revenue (undefined) Forecast, by Application 2020 & 2033
- Table 37: Global Utility Audit Software Revenue undefined Forecast, by Application 2020 & 2033
- Table 38: Global Utility Audit Software Revenue undefined Forecast, by Type 2020 & 2033
- Table 39: Global Utility Audit Software Revenue undefined Forecast, by Country 2020 & 2033
- Table 40: China Utility Audit Software Revenue (undefined) Forecast, by Application 2020 & 2033
- Table 41: India Utility Audit Software Revenue (undefined) Forecast, by Application 2020 & 2033
- Table 42: Japan Utility Audit Software Revenue (undefined) Forecast, by Application 2020 & 2033
- Table 43: South Korea Utility Audit Software Revenue (undefined) Forecast, by Application 2020 & 2033
- Table 44: ASEAN Utility Audit Software Revenue (undefined) Forecast, by Application 2020 & 2033
- Table 45: Oceania Utility Audit Software Revenue (undefined) Forecast, by Application 2020 & 2033
- Table 46: Rest of Asia Pacific Utility Audit Software Revenue (undefined) Forecast, by Application 2020 & 2033
Frequently Asked Questions
1. What is the projected Compound Annual Growth Rate (CAGR) of the Utility Audit Software?
The projected CAGR is approximately 6.9%.
2. Which companies are prominent players in the Utility Audit Software?
Key companies in the market include Resolver, Gensuite, Wolters Kluwer/TeamMate, Plan Brothers, Optial, Perillon Software, ProcessGene, Oversight Systems, MasterControl, ComplianceBridge, Tronixss, Reflexis Systems, SAI Global, Isolocity, Insight Lean Solutions, AuditFile.
3. What are the main segments of the Utility Audit Software?
The market segments include Application, Type.
4. Can you provide details about the market size?
The market size is estimated to be USD XXX N/A as of 2022.
5. What are some drivers contributing to market growth?
N/A
6. What are the notable trends driving market growth?
N/A
7. Are there any restraints impacting market growth?
N/A
8. Can you provide examples of recent developments in the market?
N/A
9. What pricing options are available for accessing the report?
Pricing options include single-user, multi-user, and enterprise licenses priced at USD 3950.00, USD 5925.00, and USD 7900.00 respectively.
10. Is the market size provided in terms of value or volume?
The market size is provided in terms of value, measured in N/A.
11. Are there any specific market keywords associated with the report?
Yes, the market keyword associated with the report is "Utility Audit Software," which aids in identifying and referencing the specific market segment covered.
12. How do I determine which pricing option suits my needs best?
The pricing options vary based on user requirements and access needs. Individual users may opt for single-user licenses, while businesses requiring broader access may choose multi-user or enterprise licenses for cost-effective access to the report.
13. Are there any additional resources or data provided in the Utility Audit Software report?
While the report offers comprehensive insights, it's advisable to review the specific contents or supplementary materials provided to ascertain if additional resources or data are available.
14. How can I stay updated on further developments or reports in the Utility Audit Software?
To stay informed about further developments, trends, and reports in the Utility Audit Software, consider subscribing to industry newsletters, following relevant companies and organizations, or regularly checking reputable industry news sources and publications.
Methodology
Step 1 - Identification of Relevant Samples Size from Population Database


Step 2 - Approaches for Defining Global Market Size (Value, Volume* & Price*)

Note*: In applicable scenarios
Step 3 - Data Sources
Primary Research
- Web Analytics
- Survey Reports
- Research Institute
- Latest Research Reports
- Opinion Leaders
Secondary Research
- Annual Reports
- White Paper
- Latest Press Release
- Industry Association
- Paid Database
- Investor Presentations

Step 4 - Data Triangulation
Involves using different sources of information in order to increase the validity of a study
These sources are likely to be stakeholders in a program - participants, other researchers, program staff, other community members, and so on.
Then we put all data in single framework & apply various statistical tools to find out the dynamic on the market.
During the analysis stage, feedback from the stakeholder groups would be compared to determine areas of agreement as well as areas of divergence