

Key Insights
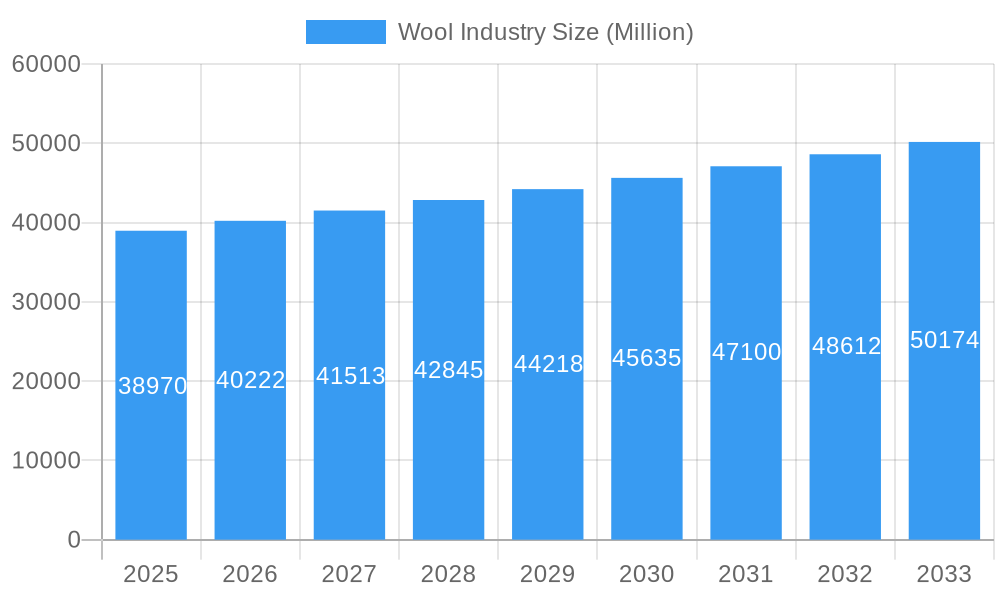
The global wool industry, valued at $38.97 billion in 2025, is projected to experience steady growth, exhibiting a compound annual growth rate (CAGR) of 3.20% from 2025 to 2033. This growth is driven by several factors. The increasing demand for sustainable and eco-friendly textiles is fueling the popularity of wool, a naturally renewable and biodegradable fiber. Furthermore, the rising popularity of luxury apparel and home furnishings, coupled with the inherent qualities of wool such as warmth, breathability, and moisture-wicking capabilities, are contributing significantly to market expansion. Growth is also propelled by innovations in wool processing technologies, leading to improved yarn quality and enhanced product offerings. While challenges such as price fluctuations in raw materials and competition from synthetic fibers exist, the industry is strategically addressing these issues through product diversification, focusing on niche markets, and promoting the unique benefits of wool to consumers. The knitwear yarn segment, a major contributor to the market, is expected to witness strong growth, driven by the increasing demand for comfortable and stylish clothing. Similarly, the textile and apparel segment continues to be a dominant end-use industry for wool, owing to its versatility and widespread usage. Geographic growth is expected across regions, with North America and Europe maintaining strong positions, while Asia-Pacific exhibits high potential due to its burgeoning textile and apparel industries and growing middle class.
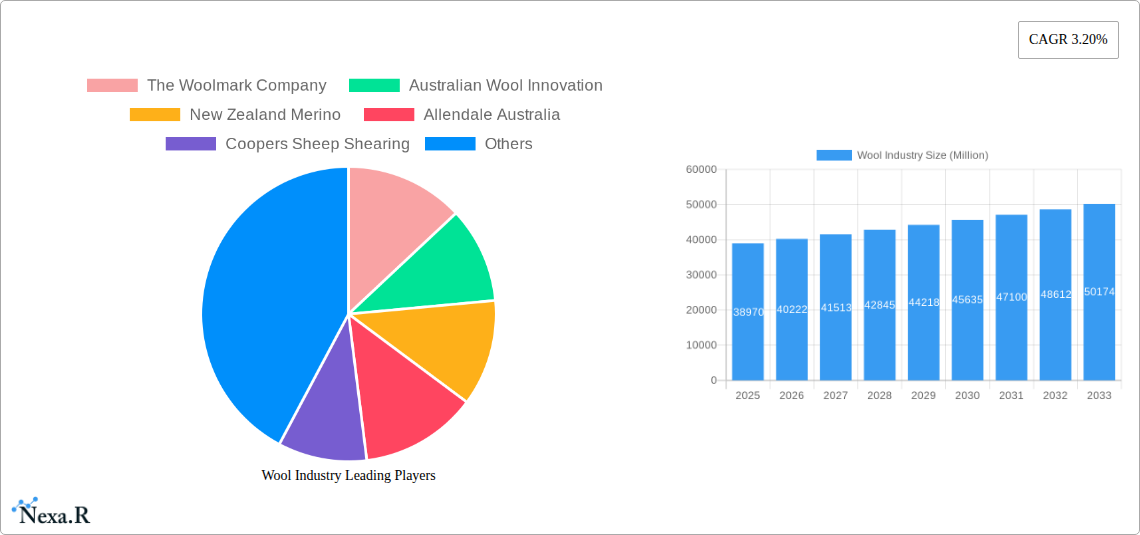
Wool Industry Market Size (In Billion)
The industry's segmentation into product types (knitwear yarn, woven fabrics) and end-use industries (textile and apparel, home furnishings, industrial) allows for targeted strategies and tailored product development. Key players like The Woolmark Company and Australian Wool Innovation are actively involved in promoting wool's sustainability and quality, further influencing market dynamics. Regional variations will exist, reflecting differing economic conditions, consumer preferences, and government policies related to textile production and sustainability. Market penetration in developing regions presents a significant opportunity for future growth, especially through collaborations with local manufacturers and suppliers. Continuous innovation in wool processing and the development of high-performance wool blends will further enhance market competitiveness. Careful monitoring of price volatility and adaptation to evolving consumer trends will be crucial to maintain the sustained growth of the wool industry.
Wool Industry Company Market Share
Wool Industry Market Report: 2019-2033
This comprehensive report provides a detailed analysis of the global wool industry, encompassing market dynamics, growth trends, regional performance, product landscape, key players, and future outlook. The study period covers 2019-2033, with 2025 as the base and estimated year. This report is invaluable for industry professionals, investors, and strategic decision-makers seeking a deep understanding of this dynamic market.
Wool Industry Market Dynamics & Structure
The global wool market, valued at xx million units in 2025, is characterized by moderate concentration, with key players like The Woolmark Company, Australian Wool Innovation, and New Zealand Merino holding significant market share. Technological innovation, particularly in fiber processing and textile manufacturing, is a key driver, while regulatory frameworks concerning animal welfare and sustainability are increasingly influential. Competitive substitutes, such as synthetic fibers, pose a challenge, necessitating continuous innovation in wool's value proposition. End-user demographics are shifting towards environmentally conscious consumers, fueling demand for sustainably sourced wool. M&A activity within the industry has been moderate in recent years, with an estimated xx deals completed between 2019 and 2024.
- Market Concentration: Moderately concentrated, with top 5 players holding approximately xx% market share in 2025.
- Technological Innovation: Focus on improving fiber properties, sustainable processing, and reducing environmental impact.
- Regulatory Framework: Increasing emphasis on animal welfare, traceability, and sustainable practices.
- Competitive Substitutes: Synthetic fibers (polyester, nylon) pose significant competition.
- End-User Demographics: Growing demand from environmentally conscious consumers and increasing interest in luxury goods.
- M&A Trends: Moderate activity, with xx deals valued at xx million units between 2019 and 2024. Innovation barriers include high R&D costs and the need for specialized equipment.
Wool Industry Growth Trends & Insights
The global wool market exhibited a CAGR of xx% during the historical period (2019-2024), reaching xx million units in 2025. This growth is attributed to factors such as increasing consumer demand for natural fibers, rising disposable incomes in emerging markets, and the growing popularity of sustainable and ethically produced products. The forecast period (2025-2033) projects a CAGR of xx%, driven by continued innovation in product development and marketing strategies emphasizing wool's unique properties. Market penetration remains relatively high in established markets, while significant growth opportunities exist in emerging economies. Technological disruptions, such as advancements in fiber processing and smart textiles, are expected to further accelerate market expansion. Consumer behavior shifts towards sustainable and premium products will continue to support wool's appeal.
Dominant Regions, Countries, or Segments in Wool Industry
The largest segments within the wool industry in 2025 are Knitwear Yarn (xx million units), followed by Woven Fabrics (xx million units). Within end-use industries, Textile and Apparel dominates with a market share of xx%, followed by Home Furnishings (xx%) and Industrial (xx%). Australia and New Zealand remain leading producers and exporters of wool, benefiting from favorable climatic conditions and established industry infrastructure. Growth in these regions is fueled by strong government support for wool production and ongoing innovation in processing technologies. China's continued dominance as a major consumer of wool further contributes to regional growth.
- Key Drivers (Australia & New Zealand):
- Favorable climatic conditions for sheep farming.
- Established industry infrastructure and expertise.
- Government support for wool production and research.
- Key Drivers (China):
- Large and growing consumer market for wool products.
- Robust textile and apparel manufacturing sector.
- Market Share: Australia holds xx%, New Zealand holds xx% of global wool production in 2025.
Wool Industry Product Landscape
The wool industry offers a diverse range of products, from fine merino wool yarns for luxury knitwear to durable fabrics for outerwear and home furnishings. Innovation focuses on developing performance-enhancing treatments, such as water-repellency and wrinkle resistance, while maintaining wool's inherent softness and breathability. Technological advancements in spinning and weaving techniques continue to improve fabric quality and production efficiency. The unique selling propositions of wool include its natural breathability, moisture-wicking properties, and inherent insulation, making it highly desirable for various applications.
Key Drivers, Barriers & Challenges in Wool Industry
Key Drivers:
- Increasing demand for sustainable and eco-friendly materials.
- Growing awareness of wool's unique performance properties.
- Technological advancements in processing and production.
- Government support for wool production in key regions.
Challenges and Restraints:
- Competition from synthetic fibers and other natural materials.
- Fluctuations in wool prices due to supply and demand dynamics.
- Sustainability concerns related to sheep farming practices. (estimated xx% increase in production costs to meet rising sustainability standards by 2033)
- High initial investment costs for advanced processing technologies.
Emerging Opportunities in Wool Industry
Emerging opportunities include the growth of the circular economy, increased focus on traceability and transparency within the supply chain, and the development of innovative applications in areas such as smart textiles and medical textiles. Untapped markets in emerging economies present substantial potential for expansion. Evolving consumer preferences towards sustainable and ethically produced products will continue to drive innovation and growth.
Growth Accelerators in the Wool Industry
Long-term growth is expected to be driven by technological advancements in fiber processing and textile manufacturing, enhancing wool's performance and sustainability profile. Strategic partnerships between wool producers, textile manufacturers, and brand owners will play a crucial role in expanding market reach and driving consumer demand. Market expansion into new regions and applications, such as technical textiles and medical applications, will create new avenues for growth.
Key Players Shaping the Wool Industry Market
- The Woolmark Company
- Australian Wool Innovation
- New Zealand Merino
- Allendale Australia
- Coopers Sheep Shearing
Notable Milestones in Wool Industry Sector
- 2020: Launch of a new sustainable wool certification program by The Woolmark Company.
- 2022: Australian Wool Innovation invests in research into new wool processing technologies.
- 2023: New Zealand Merino partners with a major fashion brand to promote sustainable wool.
In-Depth Wool Industry Market Outlook
The future of the wool industry is bright, with significant opportunities for growth driven by technological innovation, sustainability initiatives, and increasing consumer demand for natural and high-performance materials. Strategic partnerships and market expansion into new regions and applications will play a pivotal role in shaping the industry's trajectory over the next decade. The market is poised for continued growth, with a projected value of xx million units by 2033, offering attractive prospects for both established and emerging players.
Wool Industry Segmentation
- 1. Production Analysis
- 2. Consumption Analysis
- 3. Import Market Analysis (Value & Volume)
- 4. Export Market Analysis (Value & Volume)
- 5. Price Trend Analysis
Wool Industry Segmentation By Geography
-
1. North America
- 1.1. United States
- 1.2. Mexico
-
2. Europe
- 2.1. Germany
- 2.2. Belgium
- 2.3. United Kingdom
- 2.4. Italy
- 2.5. Netherlands
- 2.6. Turkey
-
3. Asia Pacific
- 3.1. China
- 3.2. India
- 3.3. Japan
- 3.4. Australia
- 3.5. New Zealand
-
4. South America
- 4.1. Brazil
- 4.2. Argentina
-
5. Middle East and Africa
- 5.1. UAE
- 5.2. Saudi Arabia
- 5.3. Oman
- 5.4. Morocco
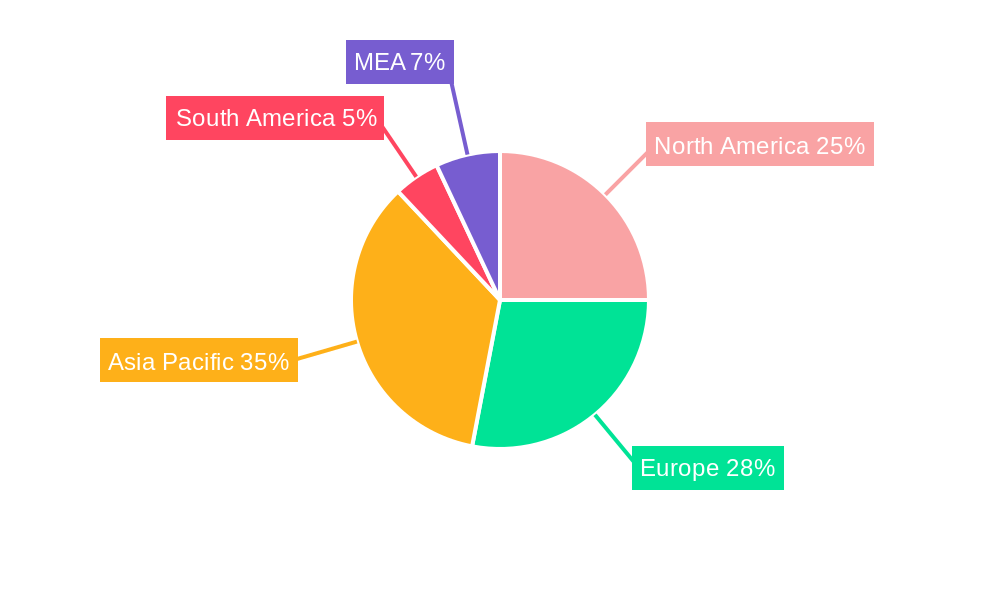
Wool Industry Regional Market Share
Geographic Coverage of Wool Industry
Wool Industry REPORT HIGHLIGHTS
| Aspects | Details |
|---|---|
| Study Period | 2020-2034 |
| Base Year | 2025 |
| Estimated Year | 2026 |
| Forecast Period | 2026-2034 |
| Historical Period | 2020-2025 |
| Growth Rate | CAGR of 3.20% from 2020-2034 |
| Segmentation |
|
Table of Contents
- 1. Introduction
- 1.1. Research Scope
- 1.2. Market Segmentation
- 1.3. Research Objective
- 1.4. Definitions and Assumptions
- 2. Executive Summary
- 2.1. Market Snapshot
- 3. Market Dynamics
- 3.1. Market Drivers
- 3.2. Market Restrains
- 3.3. Market Trends
- 3.4. Market Opportunities
- 4. Market Factor Analysis
- 4.1. Porters Five Forces
- 4.1.1. Bargaining Power of Suppliers
- 4.1.2. Bargaining Power of Buyers
- 4.1.3. Threat of New Entrants
- 4.1.4. Threat of Substitutes
- 4.1.5. Competitive Rivalry
- 4.2. PESTEL analysis
- 4.3. BCG Analysis
- 4.3.1. Stars (High Growth, High Market Share)
- 4.3.2. Cash Cows (Low Growth, High Market Share)
- 4.3.3. Question Mark (High Growth, Low Market Share)
- 4.3.4. Dogs (Low Growth, Low Market Share)
- 4.4. Ansoff Matrix Analysis
- 4.5. Supply Chain Analysis
- 4.6. Regulatory Landscape
- 4.7. Current Market Potential and Opportunity Assessment (TAM–SAM–SOM Framework)
- 4.8. NRP Analyst Note
- 4.1. Porters Five Forces
- 5. Market Analysis, Insights and Forecast 2021-2033
- 5.1. Market Analysis, Insights and Forecast - by Production Analysis
- 5.2. Market Analysis, Insights and Forecast - by Consumption Analysis
- 5.3. Market Analysis, Insights and Forecast - by Import Market Analysis (Value & Volume)
- 5.4. Market Analysis, Insights and Forecast - by Export Market Analysis (Value & Volume)
- 5.5. Market Analysis, Insights and Forecast - by Price Trend Analysis
- 5.6. Market Analysis, Insights and Forecast - by Region
- 5.6.1. North America
- 5.6.2. Europe
- 5.6.3. Asia Pacific
- 5.6.4. South America
- 5.6.5. Middle East and Africa
- 6. Global Wool Industry Analysis, Insights and Forecast, 2021-2033
- 6.1. Market Analysis, Insights and Forecast - by Production Analysis
- 6.2. Market Analysis, Insights and Forecast - by Consumption Analysis
- 6.3. Market Analysis, Insights and Forecast - by Import Market Analysis (Value & Volume)
- 6.4. Market Analysis, Insights and Forecast - by Export Market Analysis (Value & Volume)
- 6.5. Market Analysis, Insights and Forecast - by Price Trend Analysis
- 7. North America Wool Industry Analysis, Insights and Forecast, 2020-2032
- 7.1. Market Analysis, Insights and Forecast - by Production Analysis
- 7.2. Market Analysis, Insights and Forecast - by Consumption Analysis
- 7.3. Market Analysis, Insights and Forecast - by Import Market Analysis (Value & Volume)
- 7.4. Market Analysis, Insights and Forecast - by Export Market Analysis (Value & Volume)
- 7.5. Market Analysis, Insights and Forecast - by Price Trend Analysis
- 8. Europe Wool Industry Analysis, Insights and Forecast, 2020-2032
- 8.1. Market Analysis, Insights and Forecast - by Production Analysis
- 8.2. Market Analysis, Insights and Forecast - by Consumption Analysis
- 8.3. Market Analysis, Insights and Forecast - by Import Market Analysis (Value & Volume)
- 8.4. Market Analysis, Insights and Forecast - by Export Market Analysis (Value & Volume)
- 8.5. Market Analysis, Insights and Forecast - by Price Trend Analysis
- 9. Asia Pacific Wool Industry Analysis, Insights and Forecast, 2020-2032
- 9.1. Market Analysis, Insights and Forecast - by Production Analysis
- 9.2. Market Analysis, Insights and Forecast - by Consumption Analysis
- 9.3. Market Analysis, Insights and Forecast - by Import Market Analysis (Value & Volume)
- 9.4. Market Analysis, Insights and Forecast - by Export Market Analysis (Value & Volume)
- 9.5. Market Analysis, Insights and Forecast - by Price Trend Analysis
- 10. South America Wool Industry Analysis, Insights and Forecast, 2020-2032
- 10.1. Market Analysis, Insights and Forecast - by Production Analysis
- 10.2. Market Analysis, Insights and Forecast - by Consumption Analysis
- 10.3. Market Analysis, Insights and Forecast - by Import Market Analysis (Value & Volume)
- 10.4. Market Analysis, Insights and Forecast - by Export Market Analysis (Value & Volume)
- 10.5. Market Analysis, Insights and Forecast - by Price Trend Analysis
- 11. Middle East and Africa Wool Industry Analysis, Insights and Forecast, 2020-2032
- 11.1. Market Analysis, Insights and Forecast - by Production Analysis
- 11.2. Market Analysis, Insights and Forecast - by Consumption Analysis
- 11.3. Market Analysis, Insights and Forecast - by Import Market Analysis (Value & Volume)
- 11.4. Market Analysis, Insights and Forecast - by Export Market Analysis (Value & Volume)
- 11.5. Market Analysis, Insights and Forecast - by Price Trend Analysis
- 12. Competitive Analysis
- 12.1. Company Profiles
- 12.1.1 The Woolmark Company
- 12.1.1.1. Company Overview
- 12.1.1.2. Products
- 12.1.1.3. Company Financials
- 12.1.1.4. SWOT Analysis
- 12.1.2 Australian Wool Innovation
- 12.1.2.1. Company Overview
- 12.1.2.2. Products
- 12.1.2.3. Company Financials
- 12.1.2.4. SWOT Analysis
- 12.1.3 New Zealand Merino
- 12.1.3.1. Company Overview
- 12.1.3.2. Products
- 12.1.3.3. Company Financials
- 12.1.3.4. SWOT Analysis
- 12.1.4 Allendale Australia
- 12.1.4.1. Company Overview
- 12.1.4.2. Products
- 12.1.4.3. Company Financials
- 12.1.4.4. SWOT Analysis
- 12.1.5 Coopers Sheep Shearing
- 12.1.5.1. Company Overview
- 12.1.5.2. Products
- 12.1.5.3. Company Financials
- 12.1.5.4. SWOT Analysis
- 12.1.1 The Woolmark Company
- 12.2. Market Entropy
- 12.2.1 Company's Key Areas Served
- 12.2.2 Recent Developments
- 12.3. Company Market Share Analysis 2025
- 12.3.1 Top 5 Companies Market Share Analysis
- 12.3.2 Top 3 Companies Market Share Analysis
- 12.4. List of Potential Customers
- 13. Research Methodology
List of Figures
- Figure 1: Global Wool Industry Revenue Breakdown (Million, %) by Region 2025 & 2033
- Figure 2: North America Wool Industry Revenue (Million), by Production Analysis 2025 & 2033
- Figure 3: North America Wool Industry Revenue Share (%), by Production Analysis 2025 & 2033
- Figure 4: North America Wool Industry Revenue (Million), by Consumption Analysis 2025 & 2033
- Figure 5: North America Wool Industry Revenue Share (%), by Consumption Analysis 2025 & 2033
- Figure 6: North America Wool Industry Revenue (Million), by Import Market Analysis (Value & Volume) 2025 & 2033
- Figure 7: North America Wool Industry Revenue Share (%), by Import Market Analysis (Value & Volume) 2025 & 2033
- Figure 8: North America Wool Industry Revenue (Million), by Export Market Analysis (Value & Volume) 2025 & 2033
- Figure 9: North America Wool Industry Revenue Share (%), by Export Market Analysis (Value & Volume) 2025 & 2033
- Figure 10: North America Wool Industry Revenue (Million), by Price Trend Analysis 2025 & 2033
- Figure 11: North America Wool Industry Revenue Share (%), by Price Trend Analysis 2025 & 2033
- Figure 12: North America Wool Industry Revenue (Million), by Country 2025 & 2033
- Figure 13: North America Wool Industry Revenue Share (%), by Country 2025 & 2033
- Figure 14: Europe Wool Industry Revenue (Million), by Production Analysis 2025 & 2033
- Figure 15: Europe Wool Industry Revenue Share (%), by Production Analysis 2025 & 2033
- Figure 16: Europe Wool Industry Revenue (Million), by Consumption Analysis 2025 & 2033
- Figure 17: Europe Wool Industry Revenue Share (%), by Consumption Analysis 2025 & 2033
- Figure 18: Europe Wool Industry Revenue (Million), by Import Market Analysis (Value & Volume) 2025 & 2033
- Figure 19: Europe Wool Industry Revenue Share (%), by Import Market Analysis (Value & Volume) 2025 & 2033
- Figure 20: Europe Wool Industry Revenue (Million), by Export Market Analysis (Value & Volume) 2025 & 2033
- Figure 21: Europe Wool Industry Revenue Share (%), by Export Market Analysis (Value & Volume) 2025 & 2033
- Figure 22: Europe Wool Industry Revenue (Million), by Price Trend Analysis 2025 & 2033
- Figure 23: Europe Wool Industry Revenue Share (%), by Price Trend Analysis 2025 & 2033
- Figure 24: Europe Wool Industry Revenue (Million), by Country 2025 & 2033
- Figure 25: Europe Wool Industry Revenue Share (%), by Country 2025 & 2033
- Figure 26: Asia Pacific Wool Industry Revenue (Million), by Production Analysis 2025 & 2033
- Figure 27: Asia Pacific Wool Industry Revenue Share (%), by Production Analysis 2025 & 2033
- Figure 28: Asia Pacific Wool Industry Revenue (Million), by Consumption Analysis 2025 & 2033
- Figure 29: Asia Pacific Wool Industry Revenue Share (%), by Consumption Analysis 2025 & 2033
- Figure 30: Asia Pacific Wool Industry Revenue (Million), by Import Market Analysis (Value & Volume) 2025 & 2033
- Figure 31: Asia Pacific Wool Industry Revenue Share (%), by Import Market Analysis (Value & Volume) 2025 & 2033
- Figure 32: Asia Pacific Wool Industry Revenue (Million), by Export Market Analysis (Value & Volume) 2025 & 2033
- Figure 33: Asia Pacific Wool Industry Revenue Share (%), by Export Market Analysis (Value & Volume) 2025 & 2033
- Figure 34: Asia Pacific Wool Industry Revenue (Million), by Price Trend Analysis 2025 & 2033
- Figure 35: Asia Pacific Wool Industry Revenue Share (%), by Price Trend Analysis 2025 & 2033
- Figure 36: Asia Pacific Wool Industry Revenue (Million), by Country 2025 & 2033
- Figure 37: Asia Pacific Wool Industry Revenue Share (%), by Country 2025 & 2033
- Figure 38: South America Wool Industry Revenue (Million), by Production Analysis 2025 & 2033
- Figure 39: South America Wool Industry Revenue Share (%), by Production Analysis 2025 & 2033
- Figure 40: South America Wool Industry Revenue (Million), by Consumption Analysis 2025 & 2033
- Figure 41: South America Wool Industry Revenue Share (%), by Consumption Analysis 2025 & 2033
- Figure 42: South America Wool Industry Revenue (Million), by Import Market Analysis (Value & Volume) 2025 & 2033
- Figure 43: South America Wool Industry Revenue Share (%), by Import Market Analysis (Value & Volume) 2025 & 2033
- Figure 44: South America Wool Industry Revenue (Million), by Export Market Analysis (Value & Volume) 2025 & 2033
- Figure 45: South America Wool Industry Revenue Share (%), by Export Market Analysis (Value & Volume) 2025 & 2033
- Figure 46: South America Wool Industry Revenue (Million), by Price Trend Analysis 2025 & 2033
- Figure 47: South America Wool Industry Revenue Share (%), by Price Trend Analysis 2025 & 2033
- Figure 48: South America Wool Industry Revenue (Million), by Country 2025 & 2033
- Figure 49: South America Wool Industry Revenue Share (%), by Country 2025 & 2033
- Figure 50: Middle East and Africa Wool Industry Revenue (Million), by Production Analysis 2025 & 2033
- Figure 51: Middle East and Africa Wool Industry Revenue Share (%), by Production Analysis 2025 & 2033
- Figure 52: Middle East and Africa Wool Industry Revenue (Million), by Consumption Analysis 2025 & 2033
- Figure 53: Middle East and Africa Wool Industry Revenue Share (%), by Consumption Analysis 2025 & 2033
- Figure 54: Middle East and Africa Wool Industry Revenue (Million), by Import Market Analysis (Value & Volume) 2025 & 2033
- Figure 55: Middle East and Africa Wool Industry Revenue Share (%), by Import Market Analysis (Value & Volume) 2025 & 2033
- Figure 56: Middle East and Africa Wool Industry Revenue (Million), by Export Market Analysis (Value & Volume) 2025 & 2033
- Figure 57: Middle East and Africa Wool Industry Revenue Share (%), by Export Market Analysis (Value & Volume) 2025 & 2033
- Figure 58: Middle East and Africa Wool Industry Revenue (Million), by Price Trend Analysis 2025 & 2033
- Figure 59: Middle East and Africa Wool Industry Revenue Share (%), by Price Trend Analysis 2025 & 2033
- Figure 60: Middle East and Africa Wool Industry Revenue (Million), by Country 2025 & 2033
- Figure 61: Middle East and Africa Wool Industry Revenue Share (%), by Country 2025 & 2033
List of Tables
- Table 1: Global Wool Industry Revenue Million Forecast, by Production Analysis 2020 & 2033
- Table 2: Global Wool Industry Revenue Million Forecast, by Consumption Analysis 2020 & 2033
- Table 3: Global Wool Industry Revenue Million Forecast, by Import Market Analysis (Value & Volume) 2020 & 2033
- Table 4: Global Wool Industry Revenue Million Forecast, by Export Market Analysis (Value & Volume) 2020 & 2033
- Table 5: Global Wool Industry Revenue Million Forecast, by Price Trend Analysis 2020 & 2033
- Table 6: Global Wool Industry Revenue Million Forecast, by Region 2020 & 2033
- Table 7: Global Wool Industry Revenue Million Forecast, by Production Analysis 2020 & 2033
- Table 8: Global Wool Industry Revenue Million Forecast, by Consumption Analysis 2020 & 2033
- Table 9: Global Wool Industry Revenue Million Forecast, by Import Market Analysis (Value & Volume) 2020 & 2033
- Table 10: Global Wool Industry Revenue Million Forecast, by Export Market Analysis (Value & Volume) 2020 & 2033
- Table 11: Global Wool Industry Revenue Million Forecast, by Price Trend Analysis 2020 & 2033
- Table 12: Global Wool Industry Revenue Million Forecast, by Country 2020 & 2033
- Table 13: United States Wool Industry Revenue (Million) Forecast, by Application 2020 & 2033
- Table 14: Mexico Wool Industry Revenue (Million) Forecast, by Application 2020 & 2033
- Table 15: Global Wool Industry Revenue Million Forecast, by Production Analysis 2020 & 2033
- Table 16: Global Wool Industry Revenue Million Forecast, by Consumption Analysis 2020 & 2033
- Table 17: Global Wool Industry Revenue Million Forecast, by Import Market Analysis (Value & Volume) 2020 & 2033
- Table 18: Global Wool Industry Revenue Million Forecast, by Export Market Analysis (Value & Volume) 2020 & 2033
- Table 19: Global Wool Industry Revenue Million Forecast, by Price Trend Analysis 2020 & 2033
- Table 20: Global Wool Industry Revenue Million Forecast, by Country 2020 & 2033
- Table 21: Germany Wool Industry Revenue (Million) Forecast, by Application 2020 & 2033
- Table 22: Belgium Wool Industry Revenue (Million) Forecast, by Application 2020 & 2033
- Table 23: United Kingdom Wool Industry Revenue (Million) Forecast, by Application 2020 & 2033
- Table 24: Italy Wool Industry Revenue (Million) Forecast, by Application 2020 & 2033
- Table 25: Netherlands Wool Industry Revenue (Million) Forecast, by Application 2020 & 2033
- Table 26: Turkey Wool Industry Revenue (Million) Forecast, by Application 2020 & 2033
- Table 27: Global Wool Industry Revenue Million Forecast, by Production Analysis 2020 & 2033
- Table 28: Global Wool Industry Revenue Million Forecast, by Consumption Analysis 2020 & 2033
- Table 29: Global Wool Industry Revenue Million Forecast, by Import Market Analysis (Value & Volume) 2020 & 2033
- Table 30: Global Wool Industry Revenue Million Forecast, by Export Market Analysis (Value & Volume) 2020 & 2033
- Table 31: Global Wool Industry Revenue Million Forecast, by Price Trend Analysis 2020 & 2033
- Table 32: Global Wool Industry Revenue Million Forecast, by Country 2020 & 2033
- Table 33: China Wool Industry Revenue (Million) Forecast, by Application 2020 & 2033
- Table 34: India Wool Industry Revenue (Million) Forecast, by Application 2020 & 2033
- Table 35: Japan Wool Industry Revenue (Million) Forecast, by Application 2020 & 2033
- Table 36: Australia Wool Industry Revenue (Million) Forecast, by Application 2020 & 2033
- Table 37: New Zealand Wool Industry Revenue (Million) Forecast, by Application 2020 & 2033
- Table 38: Global Wool Industry Revenue Million Forecast, by Production Analysis 2020 & 2033
- Table 39: Global Wool Industry Revenue Million Forecast, by Consumption Analysis 2020 & 2033
- Table 40: Global Wool Industry Revenue Million Forecast, by Import Market Analysis (Value & Volume) 2020 & 2033
- Table 41: Global Wool Industry Revenue Million Forecast, by Export Market Analysis (Value & Volume) 2020 & 2033
- Table 42: Global Wool Industry Revenue Million Forecast, by Price Trend Analysis 2020 & 2033
- Table 43: Global Wool Industry Revenue Million Forecast, by Country 2020 & 2033
- Table 44: Brazil Wool Industry Revenue (Million) Forecast, by Application 2020 & 2033
- Table 45: Argentina Wool Industry Revenue (Million) Forecast, by Application 2020 & 2033
- Table 46: Global Wool Industry Revenue Million Forecast, by Production Analysis 2020 & 2033
- Table 47: Global Wool Industry Revenue Million Forecast, by Consumption Analysis 2020 & 2033
- Table 48: Global Wool Industry Revenue Million Forecast, by Import Market Analysis (Value & Volume) 2020 & 2033
- Table 49: Global Wool Industry Revenue Million Forecast, by Export Market Analysis (Value & Volume) 2020 & 2033
- Table 50: Global Wool Industry Revenue Million Forecast, by Price Trend Analysis 2020 & 2033
- Table 51: Global Wool Industry Revenue Million Forecast, by Country 2020 & 2033
- Table 52: UAE Wool Industry Revenue (Million) Forecast, by Application 2020 & 2033
- Table 53: Saudi Arabia Wool Industry Revenue (Million) Forecast, by Application 2020 & 2033
- Table 54: Oman Wool Industry Revenue (Million) Forecast, by Application 2020 & 2033
- Table 55: Morocco Wool Industry Revenue (Million) Forecast, by Application 2020 & 2033
Frequently Asked Questions
1. What is the projected Compound Annual Growth Rate (CAGR) of the Wool Industry?
The projected CAGR is approximately 3.20%.
2. Which companies are prominent players in the Wool Industry?
Key companies in the market include The Woolmark Company , Australian Wool Innovation , New Zealand Merino , Allendale Australia , Coopers Sheep Shearing.
3. What are the main segments of the Wool Industry?
The market segments include Production Analysis, Consumption Analysis, Import Market Analysis (Value & Volume), Export Market Analysis (Value & Volume), Price Trend Analysis.
4. Can you provide details about the market size?
The market size is estimated to be USD 38.97 Million as of 2022.
5. What are some drivers contributing to market growth?
; Awareness About Health Benefits Associated With Pecan Consumption; Wide Application of Pecan.
6. What are the notable trends driving market growth?
Institutional Initiatives Ensuring the Quality is Driving the Production.
7. Are there any restraints impacting market growth?
; Volatility in the Prices; Adverse Weather Conditions Affecting Yield.
8. Can you provide examples of recent developments in the market?
N/A
9. What pricing options are available for accessing the report?
Pricing options include single-user, multi-user, and enterprise licenses priced at USD 4750, USD 5250, and USD 8750 respectively.
10. Is the market size provided in terms of value or volume?
The market size is provided in terms of value, measured in Million.
11. Are there any specific market keywords associated with the report?
Yes, the market keyword associated with the report is "Wool Industry," which aids in identifying and referencing the specific market segment covered.
12. How do I determine which pricing option suits my needs best?
The pricing options vary based on user requirements and access needs. Individual users may opt for single-user licenses, while businesses requiring broader access may choose multi-user or enterprise licenses for cost-effective access to the report.
13. Are there any additional resources or data provided in the Wool Industry report?
While the report offers comprehensive insights, it's advisable to review the specific contents or supplementary materials provided to ascertain if additional resources or data are available.
14. How can I stay updated on further developments or reports in the Wool Industry?
To stay informed about further developments, trends, and reports in the Wool Industry, consider subscribing to industry newsletters, following relevant companies and organizations, or regularly checking reputable industry news sources and publications.
Methodology
Step 1 - Identification of Relevant Samples Size from Population Database


Step 2 - Approaches for Defining Global Market Size (Value, Volume* & Price*)

Note*: In applicable scenarios
Step 3 - Data Sources
Primary Research
- Web Analytics
- Survey Reports
- Research Institute
- Latest Research Reports
- Opinion Leaders
Secondary Research
- Annual Reports
- White Paper
- Latest Press Release
- Industry Association
- Paid Database
- Investor Presentations

Step 4 - Data Triangulation
Involves using different sources of information in order to increase the validity of a study
These sources are likely to be stakeholders in a program - participants, other researchers, program staff, other community members, and so on.
Then we put all data in single framework & apply various statistical tools to find out the dynamic on the market.
During the analysis stage, feedback from the stakeholder groups would be compared to determine areas of agreement as well as areas of divergence